10-K: Annual report pursuant to Section 13 and 15(d)
Published on June 4, 2014
SECURITIES AND EXCHANGE COMMISSION
WASHINGTON, D.C. 20549
FORM 10-K
(MARK ONE)
[X] ANNUAL REPORT PURSUANT TO SECTION 13 OR 15 (d) OF THE SECURITIES EXCHANGE ACT OF 1934
FOR THE FISCAL YEAR ENDED: DECEMBER 31, 2013
OR
[ ] TRANSITION REPORT PURSUANT TO SECTION 13 OR 15 (d) OF THE SECURITIES EXCHANGE ACT OF 1934
FOR THE TRANSITION PERIOD FROM TO
COMMISSION FILE NUMBER: 1-33796
CHIMERA INVESTMENT CORPORATION
(Exact Name of Registrant as Specified in its Charter)
|
MARYLAND
|
26-0630461
|
|
(State or other jurisdiction of incorporation of organization)
|
(I.R.S. Employer Identification Number)
|
|
1211 Avenue of the Americas, Suite 2902
|
|
|
New York, New York
|
10036
|
|
(Address of Principal Executive Offices)
|
(Zip Code)
|
(646) 454-3759
(Registrant's telephone number, including area code)
Securities registered pursuant to Section 12(b) of the Act:
|
Title of Each Class
|
Name of Each Exchange on Which Registered
|
|
Common Stock, par value $.01 per share
|
New York Stock Exchange
|
Securities registered pursuant to Section 12(g) of the Act:
None.
Indicate by check mark whether the Registrant is a well-known seasoned issuer, as defined in Rule 405 of the Securities Act.
Yes o No þ
Indicate by check mark if the Registrant is not required to file reports pursuant to Section 13 or Section 15(d) of the Act. Yes o No þ
Indicate by check mark whether the Registrant (1) has filed all reports required to be filed by Section 13 or 15(d) of the Securities Exchange Act of 1934 during the preceding 12 months (or for such shorter period that the Registrant was required to file such reports), and (2) has been subject to such filing requirements for the past 90 days:
Yes o No þ
Indicate by check mark whether the registrant has submitted electronically and posted on its corporate Web site, if any, every Interactive Data File required to be submitted and posted pursuant to Rule 405 of Regulation S-T (§ 232.405 of this chapter) during the preceding 12 months (or for such shorter period that the registrant was required to submit and post such files).
Yes o No þ
Indicate by check mark if disclosure of delinquent filers pursuant to Item 405 of Regulation S-K is not contained herein, and will not be contained, to the best of registrant’s knowledge, in definitive proxy or information statements incorporated by reference in Part III of this Form 10-K or any amendment to this Form 10-K. þ
Indicate by check mark whether the registrant is a large accelerated filer, an accelerated filer, a non-accelerated filer or a smaller reporting company. See the definitions of “accelerated filer, large accelerated filer and smaller reporting company” in Rule 12b-2 of the Exchange Act. (Check one):
Large accelerated filer þ Accelerated filer o Non-accelerated filer o Smaller reporting company o
Indicate by check mark whether the Registrant is a shell company (as defined in Rule 12b-2 of the Act). Yes o No þ
At June 30, 2013, the aggregate market value of the voting stock held by non-affiliates of the Registrant was $2,941,478,436 based on the closing sale price on the New York Stock Exchange on that date.
The number of shares of the Registrant’s Common Stock outstanding on May 30, 2014 was 1,027,509,949.
CHIMERA INVESTMENT CORPORATION
2013 FORM 10-K ANNUAL REPORT
TABLE OF CONTENTS
|
PAGE
|
||
|
PART I
|
||
|
ITEM 1.
|
BUSINESS
|
3 |
|
ITEM 1A.
|
RISK FACTORS
|
13
|
|
ITEM 1B.
|
UNRESOLVED STAFF COMMENTS
|
49
|
|
ITEM 2.
|
PROPERTIES
|
49
|
|
ITEM 3.
|
LEGAL PROCEEDINGS
|
49
|
|
ITEM 4.
|
MINE SAFETY DISCLOSURES
|
50
|
|
PART II
|
||
|
ITEM 5.
|
MARKET FOR REGISTRANT’S COMMON EQUITY, RELATED STOCKHOLDER
MATTERS AND ISSUER PURCHASES OF EQUITY SECURITIES
|
51
|
|
ITEM 6.
|
SELECTED FINANCIAL DATA
|
53
|
|
ITEM 7.
|
MANAGEMENT’S DISCUSSION AND ANALYSIS OF FINANCIAL CONDITION AND
RESULTS OF OPERATIONS
|
54
|
|
ITEM 7A.
|
QUANTITATIVE AND QUALITATIVE DISCLOSURES ABOUT MARKET RISK
|
82
|
|
ITEM 8.
|
FINANCIAL STATEMENTS AND SUPPLEMENTARY DATA
|
87
|
|
ITEM 9.
|
CHANGES IN AND DISAGREEMENTS WITH ACCOUNTANTS ON ACCOUNTING AND
FINANCIAL DISCLOSURE
|
87
|
|
ITEM 9A.
|
CONTROLS AND PROCEDURES
|
87
|
|
ITEM 9B.
|
OTHER INFORMATION
|
89
|
|
PART III
|
||
|
ITEM 10.
|
DIRECTORS, EXECUTIVE OFFICERS AND CORPORATE GOVERNANCE
|
89
|
|
ITEM 11.
|
EXECUTIVE COMPENSATION
|
95
|
|
ITEM 12.
|
SECURITY OWNERSHIP OF CERTAIN BENEFICIAL OWNERS AND MANAGEMENT AND
RELATED STOCKHOLDER MATTERS
|
101
|
|
ITEM 13.
|
CERTAIN RELATIONSHIPS AND RELATED TRANSACTIONS AND DIRECTOR INDEPENDENCE
|
104
|
|
ITEM 14.
|
PRINCIPAL ACCOUNTANT FEES AND SERVICES
|
106
|
|
PART IV
|
||
|
ITEM 15.
|
EXHIBITS AND FINANCIAL STATEMENT SCHEDULES
|
108
|
|
FINANCIAL STATEMENTS
|
F-1
|
|
|
SIGNATURES
|
S-1
|
|
|
EXHIBITS
|
||
SPECIAL NOTE REGARDING FORWARD-LOOKING STATEMENTS
We make forward-looking statements in this report that are subject to risks and uncertainties. These forward-looking statements include information about possible or assumed future results of our business, financial condition, liquidity, results of operations, plans and objectives. When we use the words ‘‘believe,’’ ‘‘expect,’’ ‘‘anticipate,’’ ‘‘estimate,’’ ‘‘plan,’’ ‘‘continue,’’ ‘‘intend,’’ ‘‘should,’’ ‘‘may,’’ ‘‘would,’’ ‘‘will’’ or similar expressions, we intend to identify forward-looking statements. Statements regarding the following subjects, among others, are forward-looking by their nature:
|
●
|
our business and investment strategy;
|
|
●
|
our ability to maintain existing financing arrangements and our ability to obtain future financing arrangements;
|
|
●
|
our ability to timely file our periodic reports with the Securities and Exchange Commission, or SEC;
|
|
●
|
our expectations regarding materiality or significance;
|
|
●
|
the effectiveness of our disclosure controls and procedures;
|
|
●
|
material weaknesses in our internal controls over financial reporting;
|
|
●
|
additional information that may arise from the preparation of our financial statements;
|
|
●
|
inadequacy of or weakness in our internal controls over financial reporting of which we are not currently aware or which have not been detected;
|
|
●
|
general volatility of the securities markets in which we invest;
|
|
●
|
the impact of and changes to various government programs;
|
|
●
|
our expected investments;
|
|
●
|
changes in the value of our investments;
|
|
●
|
interest rate mismatches between our investments and our borrowings used to finance such purchases;
|
|
●
|
changes in interest rates and mortgage prepayment rates;
|
|
●
|
effects of interest rate caps on our adjustable-rate investments;
|
|
●
|
rates of default, delinquencies or decreased recovery rates on our investments;
|
|
●
|
prepayments of the mortgage and other loans underlying our mortgage-backed securities, or RMBS, or other asset-backed securities, or ABS;
|
|
●
|
the degree to which our hedging strategies may or may not protect us from interest rate volatility;
|
|
●
|
the potential delisting of our common stock from the New York Stock Exchange, or NYSE:
|
|
●
|
impact of and changes in governmental regulations, tax law and rates, accounting guidance, and similar matters;
|
|
●
|
availability of investment opportunities in real estate-related and other securities;
|
1
|
●
|
availability of qualified personnel;
|
|
●
|
estimates relating to our ability to make distributions to our stockholders in the future;
|
|
●
|
our understanding of our competition;
|
|
●
|
market trends in our industry, interest rates, the debt securities markets or the general economy;
|
|
●
|
our ability to maintain our classification as a real estate investment trust, or REIT, for federal income tax purposes; and
|
|
●
|
our ability to maintain our exemption from registration under the Investment Company Act of 1940, as amended, or 1940 Act.
|
The forward-looking statements are based on our beliefs, assumptions and expectations of our future performance, taking into account all information currently available to us. You should not place undue reliance on these forward-looking statements. These beliefs, assumptions and expectations can change as a result of many possible events or factors, not all of which are known to us. Some of these factors are described under the caption ‘‘Risk Factors’’ in this 2013 Form 10-K. If a change occurs, our business, financial condition, liquidity and results of operations may vary materially from those expressed in our forward-looking statements. Any forward-looking statement speaks only as of the date on which it is made. New risks and uncertainties arise from time to time, and it is impossible for us to predict those events or how they may affect us. Except as required by law, we are not obligated to, and do not intend to, update or revise any forward-looking statements, whether as a result of new information, future events or otherwise.
Special Note Regarding this Form 10-K
Unless otherwise indicated herein or as may be required by law, the disclosure included in this Form 10-K is presented as of December 31, 2013. Accordingly, this Form 10-K does not reflect all events occurring after December 31, 2013 (except as required by law, or as required by ASC 855, Subsequent Events), and we have not undertaken to update each and every item included in this Form 10-K to reflect such events. Therefore, this Form 10-K should be read in conjunction with our filings we have previously made with the SEC subsequent to December 31, 2013.
2
PART I
Item 1. Business
The Company
We are a specialty finance company that invests, either directly or indirectly through our subsidiaries, in residential mortgage-backed securities, or RMBS, residential mortgage loans, commercial mortgage loans, real estate-related securities and various other asset classes. We elected to be taxed as a REIT for federal income tax purposes commencing with our taxable year ended December 31, 2007. Therefore, we generally will not be subject to federal income tax on our taxable income that is distributed to our stockholders. We were incorporated in Maryland in June 2007 and commenced operations in November 2007. We listed our common stock on the NYSE in November 2007 and trade under the symbol “CIM”.
We are externally managed by Fixed Income Discount Advisory Company, which we refer to as our Manager or FIDAC. Our Manager is an investment advisor registered with the SEC. Additionally, our Manager is a wholly-owned subsidiary of Annaly Capital Management, Inc., or Annaly, a NYSE-listed REIT, which has a long track record of managing investments in U.S. government agency mortgage-backed securities, or Agency RMBS, and other real-estate related investments.
Our Manager
We are externally managed and advised by FIDAC, a fixed-income management company, pursuant to a management agreement. All of our officers are employees of our Manager or one of its affiliates. We believe our relationship with our Manager enables us to leverage our Manager’s well-respected and established portfolio management resources for each of our targeted asset classes and we utilize our Manager’s infrastructure, including its investment professionals that focus on residential mortgage loans, Agency RMBS, that are guaranteed by the Federal National Mortgage Association, or Fannie Mae, the Federal Home Loan Mortgage Corporation, or Freddie Mac, and the Government National Mortgage Association, or Ginnie Mae, Non-Agency RMBS, commercial mortgage loans, commercial mortgage-backed securities, or CMBS, and ABS. Additionally, we utilize our Manager’s finance and administration functions, which address accounting, legal, compliance, investor relations and operational matters, including portfolio management, trade allocation and execution, securities valuation, risk management and information technologies in connection with the performance of its duties. Our Manager commenced active investment management operations in 1994.
Our Manager is responsible for administering our business activities and day-to-day operations. Pursuant to the terms of the management agreement, our Manager provides us with our management team, including our officers, along with appropriate support personnel. Our Manager is at all times subject to the supervision and oversight of our Board of Directors and has only such functions and authority as we delegate to it.
Our Investment Strategy
Our objective is to provide attractive risk-adjusted returns to our investors over the long-term, primarily through dividends and secondarily through capital appreciation. We intend to achieve this objective by investing in a diversified investment portfolio of RMBS, residential mortgage loans, real estate-related securities and various other asset classes, subject to maintaining our REIT status and exemption from registration under the 1940 Act. The RMBS, ABS, CMBS, and CDOs we purchase may include investment-grade and non-investment grade classes, including the BB-rated, B-rated and non-rated classes.
We rely on our Manager’s expertise in identifying assets within our target asset classes. Our Manager makes investment decisions based on various factors, including expected cash yield, relative value, risk-adjusted returns, current and projected credit fundamentals, current and projected macroeconomic considerations, current and projected supply and demand, credit and market risk concentration limits, liquidity, cost of financing and financing availability, as well as maintaining our REIT qualification and our exemption from registration under the 1940 Act.
3
Over time, we will modify our investment allocation strategy as market conditions change to seek to maximize the returns from our investment portfolio. We believe this strategy, combined with our Manager’s experience, will enable us to pay dividends and achieve capital appreciation through various changing interest rate and credit cycles and provide attractive long-term returns to investors.
Our targeted asset classes and the principal investments we have made and in which we may in the future invest are:
|
Asset Class
|
Principal Investments
|
|
|
RMBS
|
● | Non-Agency RMBS, including investment-grade and non-investment grade classes, including the BB-rated, B-rated and non-rated classes. |
| ● | Agency RMBS. | |
| ● | Interest-only RMBS. | |
|
Residential Mortgage Loans
|
● |
Prime mortgage loans, which are mortgage loans that conform to the underwriting guidelines of Fannie Mae and Freddie Mac, which we refer to as Agency Guidelines; and jumbo prime mortgage loans, which are mortgage loans that conform to the Agency Guidelines except as to loan size.
|
| ● |
Alt-A mortgage loans, which are mortgage loans that may have been originated using documentation standards that are less stringent than the documentation standards applied by certain other first lien mortgage loan purchase programs, such as the Agency Guidelines, but have one or more compensating factors such as a borrower with a strong credit or mortgage history or significant assets.
|
|
| ● |
FHA/VA insured loans, which are mortgage loans that comply with the underwriting guidelines of the Federal Housing Administration (FHA) or Department of Veteran Affairs (VA) and which are guaranteed by the FHA or VA, respectively.
|
|
| ● |
Mortgage servicing rights associated with residential mortgage loans, which reflect the value of the future stream of expected cash flows from the contractual rights to service a given pool of residential mortgage loans.
|
4
|
Commercial Mortgage Loans
|
● |
First or second lien loans secured by multifamily properties, which are residential rental properties consisting of five or more dwelling units; and mixed residential or other commercial properties; retail properties; office properties; or industrial properties, which may or may not conform to the Agency Guidelines.
|
|
Other Asset-Backed Securities
|
● |
CMBS.
|
| ● |
Debt and equity tranches of CDOs.
|
|
| ● |
Consumer and non-consumer ABS, including investment-grade and non-investment grade classes, including the BB-rated, B-rated and non-rated classes.
|
|
|
Hedging Instruments
|
● |
Swaps
|
| ● |
Swaptions
|
|
| ● |
Futures
|
|
|
|
||
|
|
● |
Index options
|
| ● |
Mortgage options
|
Since we commenced operations in November 2007, we have focused our investment activities on acquiring Non-Agency and Agency RMBS and on purchasing residential mortgage loans that have been originated by select originators, including the retail lending operations of leading commercial banks. Our investment portfolio at December 31, 2013 was weighted toward Non-Agency RMBS. At December 31, 2013, based on the amortized cost balance of our interest earning assets, approximately 49.8% of our investment portfolio was Non-Agency RMBS, 36.1% of our investment portfolio was Agency RMBS, and 14.1% of our investment portfolio was securitized residential mortgage loans. At December 31, 2012, based on the amortized cost balance of our interest earning assets, approximately 50.3% of our investment portfolio was Non-Agency RMBS, 28.2% of our investment portfolio was Agency RMBS, and 21.5% of our investment portfolio was securitized residential mortgage loans. We expect that over the near term, our investment portfolio will continue to be weighted toward Non-Agency RMBS, subject to maintaining our REIT qualification and our 1940 Act exemption.
Following our initial public offering we initially engaged in transactions with residential mortgage lending operations of leading commercial banks and other originators in which we identified and re-underwrote residential mortgage loans owned by such entities, and purchased and securitized such residential mortgage loans ourselves. In the past we have also acquired formerly AAA-rated Non-Agency RMBS and immediately re-securitized those securities. We sold the resulting AAA-rated super senior RMBS and retained the rated or unrated mezzanine RMBS. More recently we have engaged in transactions with residential mortgage lending operations of leading commercial banks and other originators in which we identified and re-underwrote residential mortgage loans owned by such entities, and rather than purchasing and securitizing such residential mortgage loans ourselves, we and the originator or another entity, such as an investment bank, structured the securitization and purchased the resulting mezzanine and subordinate Non-Agency RMBS. Our investment decisions depend on prevailing market conditions and our business opportunities at such time and we expect that these will change over time. As a result, we cannot predict the percentage of our assets that will be invested in each asset class or whether we will invest in other classes of investments. We may change our investment strategy and policies without a vote of our stockholders.
5
Our investment strategy is intended to take advantage of opportunities in the current interest rate and credit environment. We expect to adjust our strategy to changing market conditions by shifting our asset allocations across these various asset classes as interest rate and credit cycles change over time. We believe that our strategy, combined with FIDAC’s experience, will enable us to pay dividends and achieve capital appreciation throughout changing market cycles. We expect to take a long-term view of assets and liabilities, and our reported earnings and estimates of the fair value of our investments at the end of a financial reporting period will not significantly impact our objective of providing attractive risk-adjusted returns to our stockholders over the long-term.
We use leverage to seek to increase our potential returns and to finance the acquisition of our assets. Our income is generated primarily by the difference, or net spread, between the income we earn on our assets and the cost of our borrowings. We expect to finance our investments using a variety of financing sources including, when available, repurchase agreements, warehouse facilities and securitizations. We may manage our debt and interest rate risk by utilizing interest rate hedges, such as interest rate swaps, caps, options and futures to reduce the effect of interest rate fluctuations related to our financing sources.
We have elected to be taxed as a REIT and operate our business to be exempt from registration under the 1940 Act, and therefore we are required to invest a substantial majority of our assets in loans secured by mortgages on real estate and real estate-related assets. Subject to maintaining our REIT qualification and our 1940 Act exemption, we do not have any limitations on the amounts we may invest in any of our targeted asset classes.
Investment Portfolio
The following briefly discusses the principal types of investments that we have made and may in the future make:
Residential Mortgage-Backed Securities
We have invested in and intend to continue to invest in RMBS which are typically pass-through certificates created by the securitization of a pool of mortgage loans that are collateralized by residential real estate properties.
The securitization process is governed by one or more of the rating agencies, including Fitch Ratings, Moody’s Investors Service, Standard & Poor’s, and DBRS Limited which determine the respective bond class sizes, generally based on a sequential payment structure. Bonds that are rated from AAA to BBB by the rating agencies are considered “investment grade.” Bond classes that are subordinate to the BBB class are considered “below-investment grade” or “non-investment grade.” The respective bond class sizes are determined based on the review of the underlying collateral by the rating agencies. The payments received from the underlying loans are used to make the payments on the RMBS. Based on the sequential payment priority, the risk of nonpayment for the investment grade RMBS is lower than the risk of nonpayment for the non-investment grade bonds. Accordingly, the investment grade class is typically sold at a lower yield compared to the non-investment grade classes which are sold at higher yields.
We invest in investment grade and non-investment grade RMBS. We evaluate certain credit characteristics of these types of securities, including, but not limited to, loan balance distribution, geographic concentration, property type, occupancy, periodic and lifetime caps, weighted-average loan-to-value and weighted-average Fair Isaac Corporation (“FICO”) score. Qualifying securities are then analyzed using base line expectations of expected prepayments and loss severities, the current state of the fixed-income market and broader economy in general. Losses and prepayments are stressed simultaneously based on a credit risk-based model. Securities in this portfolio are monitored for variance from expected prepayments, severities, losses and cash flow. The due diligence process is particularly important and costly with respect to newly formed originators or issuers because there may be little or no information publicly available about these entities and investments.
We may invest in net interest margin securities, or NIMs, which are notes that are payable from and secured by excess cash flow that is generated by RMBS or home equity line of credit-backed securities, or HELOCs, after paying the debt service, expenses and fees on such securities. The excess cash flow represents all or a portion of a residual that is generally retained by the originator of the RMBS or HELOCs. The residual is illiquid, and thus the originator will monetize the position by securitizing the residual and issuing a NIM, usually in the form of a note that is backed by the excess cash flow generated in the underlying securitization. We may also invest in interest-only (“IO”) Agency and Non-Agency RMBS. These IO RMBS represent the Company’s right to receive a specified proportion of the contractual interest flows of the collateral.
6
We may invest in mortgage pass-through certificates issued or guaranteed by Ginnie Mae, Fannie Mae or Freddie Mac which are securities representing interests in “pools” of mortgage loans secured by residential real property where payments of both interest and principal, plus pre-paid principal, on the securities are made monthly to holders of the security, in effect passing through monthly payments made by the individual borrowers on the mortgage loans that underlie the securities, net of fees paid to the issuer/guarantor and servicers of the securities. We may also invest in collateralized mortgage obligations, or CMOs, issued by the Agencies. CMOs consist of multiple classes of securities, with each class bearing different stated maturity dates. Monthly payments of principal, including prepayments, are first returned to investors holding the shortest maturity class; investors holding the longer maturity classes receive principal only after the first class has been retired.
Agency RMBS are collateralized by either fixed-rate mortgage loans, or FRMs, adjustable-rate mortgage loans, or ARMs, or hybrid ARMs. Hybrid ARMs are mortgage loans that have interest rates that are fixed for an initial period (typically three, five, seven or ten years) and thereafter reset at regular intervals subject to interest rate caps. Our allocation between securities collateralized by FRMs, ARMs or hybrid ARMs will depend on various factors including, but not limited to, relative value, expected future prepayment trends, supply and demand, costs of financing, costs of hedging, expected future interest rate volatility and the overall shape of the U.S. Treasury and interest rate swap yield curves. We take these factors into account when we make these types of investments.
Residential Mortgage Loans
We have invested in and may in the future invest in residential mortgage loans (mortgage loans secured by residential real property) primarily through direct purchases from selected mortgage originators. We may enter into additional mortgage loan purchase agreements with a number of primary mortgage loan originators, including mortgage bankers, commercial banks, savings and loan associations, home builders, credit unions and mortgage conduits. We may also purchase mortgage loans on the secondary market. We expect these loans to be secured primarily by residential properties in the United States.
The residential mortgage loans in which we have previously invested were primarily underwritten to our specifications. The originators performed the credit review of the borrowers, the appraisal of the properties securing the loan, and maintained other quality control procedures. We generally considered the purchase of loans when the originators have verified the borrowers’ income and assets, verified their credit history and obtained appraisals of the properties. We or a third party performed an independent underwriting review of the processing, underwriting and loan closing methodologies that the originators used in qualifying a borrower for a loan. Depending on the size of the loans, we may not have reviewed all of the loans in a pool, but rather selected loans for underwriting review based upon specific risk-based criteria such as property location, loan size, effective loan-to-value ratio, borrower’s credit score and other criteria we believe to be important indicators of credit risk. Additionally, before the purchase of loans, we obtained representations and warranties from each originator stating that each loan was underwritten to our requirements or, in the event underwriting exceptions have been made, we were informed so that we may evaluate whether to accept or reject the loans. An originator who breaches these representations and warranties in making a loan that we purchase may be obligated to repurchase the loan from us. As added security, we used the services of a third-party document custodian to insure the quality and accuracy of all individual mortgage loan closing documents and to hold the documents in safekeeping. As a result, all of the original loan collateral documents that are signed by the borrower, other than the original credit verification documents, were examined, verified and held by the third-party document custodian.
We may originate mortgage loans or provide other types of financing to the owners of real estate. We currently do not intend to establish a loan servicing platform, but expect to retain highly-rated servicers to service any mortgage loan portfolio we acquire. We have previously purchased certain residential mortgage loans on a servicing-retained basis. In the future, however, we may decide to originate mortgage loans or other types of financing, and we may elect to service mortgage loans and other types of assets.
We expect that all servicers servicing any loans we acquire will be highly rated by the rating agencies. We also conduct a due diligence review of each servicer before executing a servicing agreement. Servicing procedures would typically follow Fannie Mae guidelines but will be specified in each servicing agreement. All servicing agreements will meet standards for inclusion in highly rated mortgage-backed or asset-backed securitizations.
7
We expect that any loans we acquire will be first lien, single-family residential traditional fixed-rate, adjustable-rate and hybrid adjustable-rate loans with original terms to maturity of not more than 40 years and are either fully amortizing or are interest-only for up to ten years, and fully amortizing thereafter. Fixed-rate mortgage loans bear an interest rate that is fixed for the life of the loan. All adjustable-rate and hybrid adjustable-rate residential mortgage loans will bear an interest rate tied to an interest rate index. Most loans have periodic and lifetime constraints on how much the loan interest rate can change on any predetermined interest rate reset date. The interest rate on each adjustable-rate mortgage loan resets monthly, semi-annually or annually and generally adjusts to a margin over a U.S. Treasury index or London Interbank Offer Rate, or LIBOR, index. Hybrid ARMs have a fixed rate for an initial period, generally three to ten years, and then convert to ARMs for their remaining term to maturity.
We have in the past and may in the future acquire residential mortgage loans for our portfolio with the intention of either securitizing them and retaining them in our portfolio as securitized mortgage loans, or holding them in our residential mortgage loan portfolio. To facilitate the securitization or financing of our loans, we may create subordinate certificates, which provide a specified amount of credit enhancement. We may issue securities through securities underwriters and either retain these securities or finance them in the repurchase agreement market. There is no limit on the amount we may retain of these below-investment-grade subordinate certificates. Until we securitize our residential mortgage loans, we expect to finance our residential mortgage loan portfolio through the use of warehouse facilities and repurchase agreements.
As a result of our failure to have timely financial statements we withdrew our licenses in various jurisdictions to avoid not being in good standing under such licenses. The failure to maintain licenses or our good standing in various jurisdictions may temporarily require us to cease certain business strategies or modify the way in which we execute such strategies. For example, without the state licenses necessary to purchase residential mortgage loans, it was necessary for us to structure securitization transactions in a different manner than we may otherwise have chosen to do. This may, among other things, cause us to be unable to execute aspects of our business which may have otherwise been profitable, or we may incur additional costs related to such business operations that we otherwise would not have. These conditions may have a material adverse effect on our business, financial condition and results of operations.
Commercial Mortgage Loans
We may invest in commercial mortgage loans. Generally, we may invest in first or second lien loans secured by multifamily properties, which are residential rental properties consisting of five or more dwelling units, or by mixed residential or other commercial properties, retail properties, office properties or industrial properties. These loans may or may not conform to the Agency guidelines.
Other Asset-Backed Securities
We may invest in securities issued in various CDO offerings to gain exposure to bank loans, corporate bonds, ABS, mortgages, RMBS, CMBS, and other instruments. To avoid any actual or perceived conflicts of interest with our Manager, an investment in any such security structured or managed by our Manager will be approved by a majority of our independent directors.
We may invest in CMBS, which are secured by, or evidence ownership interests in, a single commercial mortgage loan or a pool of mortgage loans secured by commercial properties. These securities may be senior, subordinated, investment grade or non-investment grade. We intend to invest in CMBS that will yield current interest income and where we consider the return of principal to be likely. We intend to acquire CMBS from private originators of, or investors in, mortgage loans, including savings and loan associations, mortgage bankers, commercial banks, finance companies, investment banks and other entities.
8
Investment Guidelines
We have adopted a set of investment guidelines that set out the asset classes, risk tolerance levels, diversification requirements and other criteria used to evaluate the merits of specific investments as well as the overall portfolio composition. Our Manager’s investment committee (“Investment Committee”) periodically reviews our compliance with the investment guidelines. Our board also reviews our investment portfolio and related compliance with our investment policies and procedures and investment guidelines at each regularly scheduled board of directors meeting.
Our board of directors and our Manager’s Investment Committee have adopted the following guidelines for our investments and borrowings:
|
●
|
No investment shall be made that would cause us to fail to qualify as a REIT for federal income tax purposes;
|
|
●
|
No investment shall be made that would cause us to be regulated as an investment company under the 1940 Act;
|
|
●
|
With the exception of real estate and housing, no single industry shall represent greater than 20% of the securities or aggregate risk exposure in our portfolio; and
|
|
●
|
Investments in non-rated or deeply subordinated ABS or other securities that are non-qualifying assets for purposes of the 75% REIT asset test will be limited to an amount not to exceed 50% of our stockholders’ equity.
|
These investment guidelines may be changed by a majority of our board of directors without the approval of our stockholders.
Our board of directors has also adopted a separate set of investment guidelines and procedures to govern our relationships with FIDAC. We have also adopted detailed compliance policies to govern our interaction with FIDAC, including when FIDAC is in receipt of material non-public information.
Our Financing Strategy
We use leverage to increase potential returns to our stockholders. We are not required to maintain any specific debt-to-equity ratio as we believe the appropriate leverage for the particular assets we are financing depends on the credit quality and risk of those assets. At December 31, 2013, our ratio of debt-to-equity was 1.0:1. For purposes of calculating this ratio, our equity is equal to the Total stockholders’ equity on our Consolidated Statements of Financial Condition, and our debt consists of repurchase agreements and securitized debt. As part of our borrowing, we have entered into a RMBS repurchase agreement with RCap Securities, Inc., or RCAP, which is a wholly-owned subsidiary of Annaly. As of December 31, 2013, Annaly owns approximately 4.38% of our outstanding shares of common stock. As of December 31, 2013 and 2012, we had no financing under our agreement with RCap. To date, we have not had any counterparties to our repurchase agreement borrowing arrangements terminate any relationships as a result of our failure to be current in our reporting requirements with the SEC. However, beginning in the fourth quarter of 2011 we proactively reduced the amount of borrowings under our master repurchase agreements with respect to Agency RMBS to ensure that we are able to meet any margin calls.
Subject to our maintaining our qualification as a REIT, we may use a number of sources to finance our investments, including the following:
|
●
|
Repurchase Agreements. We have financed certain of our assets through the use of repurchase agreements. We anticipate that repurchase agreements will be one of the sources we will use to achieve our desired amount of leverage for our residential real estate assets. We maintain formal relationships with multiple counterparties to obtain financing on favorable terms.
|
|
●
|
Warehouse Facilities. We have utilized and may in the future utilize credit facilities for capital needed to fund our assets. We intend to maintain formal relationships with multiple counterparties to maintain warehouse lines on favorable terms.
|
9
|
●
|
Securitization. We have acquired and may in the future acquire residential mortgage loans for our portfolio with the intention of securitizing them and retaining a portion of the securitized mortgage loans in our portfolio. To facilitate the securitization or financing of our loans, we generally create subordinate certificates, providing a specified amount of credit enhancement, which we intend to retain in our portfolio.
|
|
●
|
Re-REMICs. We have acquired and may in the future acquire Non-Agency RMBS for our portfolio with the intention of re-securitizing them and retaining a portion of the re-securitized Non-Agency RMBS in our portfolio, typically the subordinate certificates. To facilitate the re-securitization, we transfer Non-Agency RMBS to a special purpose entity that has been formed as a securitization vehicle that will issue multiple classes of securities secured by and payable from cash flows on the underlying Non-Agency RMBS.
|
Our Interest Rate Hedging and Risk Management Strategy
From time to time, we use derivative financial instruments to hedge all or a portion of the interest rate risk associated with our borrowings. Under the federal income tax laws applicable to REITs, we generally enter into certain transactions to hedge indebtedness that we incur, or plan to incur, to acquire or carry real estate assets.
We may engage in a variety of interest rate management techniques that seek to mitigate changes in interest rates or other potential influences on the values of our assets. The federal income tax rules applicable to REITs may require us to implement certain of these techniques through a taxable REIT subsidiary, or TRS, that is fully subject to corporate income taxation. Our interest rate management techniques may include:
|
●
|
puts and calls on securities or indices of securities;
|
|
●
|
Eurodollar futures contracts and options on such contracts;
|
|
●
|
interest rate caps, swaps and swaptions;
|
|
●
|
U.S. Treasury securities and options on U.S. Treasury securities; and
|
|
●
|
other similar transactions.
|
We may attempt to reduce interest rate risks and to minimize exposure to interest rate fluctuations through the use of match funded financing structures, when appropriate, whereby we seek (i) to match the maturities of our debt obligations with the maturities of our assets and (ii) to match the interest rates on our investments with like-kind debt (i.e., floating rate assets are financed with floating rate debt and fixed-rate assets are financed with fixed-rate debt), directly or through the use of interest rate swaps, caps or other financial instruments, or through a combination of these strategies. This will allow us to minimize the risk that we have to refinance our liabilities before the maturities of our assets and to reduce the impact of changing interest rates on our earnings.
Compliance with REIT and Investment Company Requirements
We monitor our investment securities and the income from these securities and, to the extent we enter into hedging transactions, we monitor income from our hedging transactions as well, so as to ensure at all times that we maintain our qualification as a REIT and our exempt status under the 1940 Act.
Employees
We are externally managed and advised by our Manager pursuant to a management agreement as discussed below. We have no employees. All our named executive officers are employees of our Manager or one of its affiliates. Our Manager is not obligated to dedicate certain of its employees exclusively to us, nor is it or its employees obligated to dedicate any specific portion of its time to our business. Our Manager uses the proceeds from its management fee in part to pay compensation to its officers and employees who, notwithstanding that certain of them also are our officers, receive no cash compensation directly from us.
10
Management Agreement
On November 15, 2007 we entered into a management agreement with FIDAC, which provided for an initial term through December 31, 2010 with an automatic one-year extension option and subject to certain termination rights. In 2011 and 2010, we paid to our Manager a quarterly management fee equal to 1.50% per annum of our gross Stockholders’ Equity (as defined in the management agreement). Effective November 28, 2012, the management fee was reduced to 0.75% per annum of gross Stockholders’ Equity, which reduction will remain in effect until we are current on all of our filings required under applicable securities laws.
We are obligated to reimburse our Manager for its costs incurred under the management agreement. In addition, the management agreement permits our Manager to require us to pay for its pro rata portion of rent, telephone, utilities, office furniture, equipment, machinery and other office, internal and overhead expenses that our Manager incurred in connection with our operations. These expenses are allocated between our Manager and us based on the ratio of the proportion of gross assets compared to the gross assets managed by our Manager as calculated at each quarter end. Together we will modify this allocation methodology, subject to the approval of our board of directors if the allocation becomes inequitable (i.e., if we become very highly leveraged compared to our Manager’s other funds and accounts).
March 2013 Amendment to Management Agreement
Because of the Restatement Filing, on March 8, 2013 we amended the management agreement. In the amendment, we memorialized the reduction in the management fee effective on November 28, 2012. Additionally, our Manager agreed to pay all past and future expenses that we and/or our Audit Committee incur to: (1) evaluate our accounting policy related to the application of GAAP to our Non-Agency RMBS portfolio (the Evaluation); (2) restate our financial statements for the period covering 2008 through 2011 as a result of the Evaluation (the Restatement Filing); and (3) investigate and evaluate any shareholder derivative demands arising from the Evaluation and/or the Restatement Filing (the Investigation); provided, however, that our Manager’s obligation to pay expenses applies only to expenses not paid by our insurers under our insurance policies. Expenses shall include, without limitation, fees and costs incurred with respect to auditors, outside counsel, and consultants engaged by us and/or our Audit Committee for the Evaluation, Restatement Filing and the Investigation.
The amended management agreement is automatically renewed for a one-year term on each anniversary date, although two-thirds of the Independent directors or the holders of a majority of the outstanding shares of common stock (other than those held by Annaly or its affiliates) may elect to terminate the management agreement upon 30 days notice at any time in their sole discretion without the payment of a termination fee. Additionally, we may terminate the management agreement effective immediately if (i) our Manager engages in any act of fraud, misappropriation of funds, or embezzlement against the us, (ii) there is an event of any gross negligence on the part of our Manager in the performance of its duties under the management agreement, (iii) there is a commencement of any proceeding relating to our Manager’s bankruptcy or insolvency, (iv) there is a dissolution of our Manager, or (v) our Manager is convicted of (including a plea of nolo contendere) a felony.
Fees Paid Under the Management Agreement
For the years ended December 31, 2013, 2012 and 2011, our Manager earned management fees of $26.0 million, $49.5 million and $52.0 million, respectively and received expense reimbursement of $493 thousand, $447 thousand and $625 thousand, respectively. From our inception through 2009, our Manager waived its right to require us to pay our pro rata portion of rent, telephone, utilities, office furniture, equipment, machinery and other office, internal and overhead expenses of our Manager and its affiliates required for our operations.
Competition
Our net income depends, in large part, on our ability to acquire assets at favorable spreads over our borrowing costs. In acquiring real estate-related assets, we will compete with other mortgage REITs, specialty finance companies, savings and loan associations, banks, mortgage bankers, insurance companies, mutual funds, institutional investors, investment banking firms, financial institutions, hedge funds, governmental bodies (including the U.S. Federal Reserve) and other entities. In addition, there are numerous mortgage REITs with similar asset acquisition objectives, and others that may be organized in the future. These other REITs will increase competition for the available supply of mortgage assets suitable for purchase. Many of our competitors are significantly larger than we are, have access to greater capital and other resources and may have other advantages over us. In addition, some of our competitors may have higher risk tolerances or different risk assessments, which could allow them to consider a wider variety of investments and establish more favorable relationships than we can. Current market conditions may attract more competitors, which may increase the competition for sources of financing. An increase in the competition for sources of funding could adversely affect the availability and cost of financing, and thereby adversely affect the market price of our common stock.
11
Distributions
To maintain our qualification as a REIT, we must distribute substantially all of our REIT taxable income to our stockholders for each year, and we intend to distribute all such taxable income to satisfy such requirement. We have declared and paid regular quarterly dividends in the past and intend to do so in the future. The Board of Directors declared and paid common stock cash dividends of $0.09 per common share for each of the quarters of 2013.
The Board of Directors also declared and paid a special dividend of $0.20 per share that was paid on January 31, 2014 to shareholders of record on January 8, 2014 and a quarterly dividend of $0.09 per common share for the first quarter of 2014. The Board of Directors has also determined that there will be a quarterly dividend of $0.09 per share for the second, third and fourth quarters of 2014.
Available Information
Our investor relations website is www.chimerareit.com. We make available on the website under "Investor Relations/SEC filings," free of charge, our annual report on Form 10-K, our quarterly reports on Form 10-Q, our current reports on Form 8-K and any other reports (including any amendments to such reports) as soon as reasonably practicable after we electronically file or furnish such materials to the SEC. Information on our website, however, is not part of this Annual Report on Form 10-K. All reports filed with the SEC may also be read and copied at the SEC’s public reference room at 100 F Street, N.E., Washington, D.C. 20549. Further information regarding the operation of the public reference room may be obtained by calling 1-800-SEC-0330. In addition, all of our filed reports can be obtained at the SEC’s website at www.sec.gov.
12
Item 1A. Risk Factors
You should carefully consider the following factors, together with all the other information included in this 2013 Form 10-K, in evaluating our company and our business. If any of the following risks actually occur, our business, financial condition and results of operations could be materially and adversely affected, and the value of our stock could decline. Additional risks and uncertainties not presently known to us or that we currently deem immaterial also may impair our business operations. As such, you should not consider this list to be a complete statement of all potential risks or uncertainties.
Risks Associated With Adverse Developments in the Mortgage Finance and Credit Markets
Difficult conditions in the financial markets and the economy generally have caused us and may continue to cause us market value losses related to our holdings.
Our results of operations are materially affected by conditions in the mortgage market, the financial markets and the economy generally. Concerns over monetary policy, inflation, energy costs, geopolitical issues, the availability and cost of credit, the mortgage market and the real estate market may contribute to increased volatility and diminished expectations for the economy and markets going forward.
A substantial portion of our assets are classified for accounting purposes as “available-for-sale” and carried at fair value. Changes in the fair values of those assets are directly charged or credited to Other comprehensive income (loss), or OCI. As a result, a decline in values may reduce the book value of our assets. Moreover, if the decline in value of an available-for-sale security is other-than-temporary, such decline will reduce earnings.
All of our repurchase agreements and interest rate swap agreements are subject to bilateral margin calls in the event that the collateral securing our obligations under those facilities exceeds or does not meet our collateralization requirements. We can provide no assurances that we can find funding which may result in us having to dispose of assets at an inopportune time when prices are depressed.
We rely on the availability of financing to acquire residential mortgage loans, real estate-related securities and real estate loans on a leveraged basis. Institutions from which we will seek to obtain financing may own or finance residential mortgage loans, real estate-related securities and real estate loans, which may decline in value and cause them to suffer losses based on conditions in the residential mortgage market. This may cause lenders and institutional investors to reduce or cease to provide funding to borrowers, including other financial institutions. Under these conditions, it may be more difficult for us to obtain financing on favorable terms or at all. Our profitability may be adversely affected if we are unable to obtain cost-effective financing for our investments.
Mortgage loan modification programs, future legislative action and changes in the requirements necessary to qualify for refinancing a mortgage may adversely affect the value of, and the returns on, the assets in which we invest.
The U.S. Government, through the Federal Housing Administration, or FHA, and the Federal Deposit Insurance Corporate, or FDIC, has implemented programs designed to provide homeowners with assistance in avoiding residential mortgage loan foreclosures including the Hope for Homeowners Act of 2008, which allows certain distressed borrowers to refinance their mortgages into FHA-insured loans and the Home Affordable Modification Program, or HAMP, which provides a detailed, uniform model for one-time modification of eligible residential mortgage loans. The programs may also involve, among other things, the modification of mortgage loans to reduce the principal amount of the loans or the rate of interest payable on the loans, or to extend the payment terms of the loans. These loan modification programs, including future legislative or regulatory actions and amendments to the bankruptcy laws, that result in the modification of outstanding mortgage loans, as well as changes in the requirements necessary to qualify for refinancing a mortgage may affect the value of, and the returns on, our Non-Agency RMBS and Agency RMBS. Depending on whether or not we purchased an instrument at a premium or discount, the yield we receive may be positively or negatively impacted by any modification.
13
The U.S. Government's efforts to encourage refinancing of certain loans may affect prepayment rates for mortgage loans in mortgage-backed securities.
In addition to the increased pressure upon residential mortgage loan investors and servicers to engage in loss mitigation activities, the U.S. Government is pressing for refinancing of certain loans, and this encouragement may affect prepayment rates for mortgage loans in mortgage-backed securities.
To the extent these and other economic stabilization or stimulus efforts are successful in increasing prepayment speeds for residential mortgage loans, such as those in mortgage-backed securities, that could potentially have a negative impact on our income and operating results, particularly in connection with loans or mortgage-backed securities purchased at a premium or our interest-only securities.
Any further downgrade, or perceived potential of a downgrade, of U.S. sovereign credit ratings by the various credit rating agencies may have a materially adverse effect on our business.
During the summer of 2011, S&P downgraded the U.S. sovereign credit rating in response to the protracted debate over the U.S. debt ceiling limit and S&P’s perception of the U.S. Government’s ability to address its long-term budget deficit. In addition, the credit rating of government sponsored enterprises, or GSEs, was also downgraded by S&P in response to the downgrade in the U.S. sovereign credit rating, as the value of the Agency MBS issued by such GSEs and their ability to meet their obligations under such Agency MBS is impacted by the support provided to them by the U.S. Government and market perceptions of the strength of such support and the likelihood of its continuity. Additionally, in October 2013 a second protracted debate over the U.S. debt ceiling occurred along with a shutdown of the U.S. federal government. To the extent that the credit rating of any or all of the GSEs were to be downgraded by other credit rating agencies or further downgraded by S&P, the value of our Agency MBS could be negatively impacted. In addition, we could be negatively affected in a number of ways in the event of a default by the U.S. Government or a downgrade of the U.S. sovereign credit rating by other credit rating agencies or a further downgrade by S&P. Such negative impacts could include changes in the financing terms of our repurchase agreements collateralized by Agency MBS, which could include higher financing costs and/or a reduction in the amount of financing provided based on the market value of collateral posted under these agreements. These outcomes could in turn materially adversely affect our operations and financial condition in a number of ways, including a reduction in the net interest spread between our assets and associated repurchase agreement borrowings or by decreasing our ability to obtain repurchase agreement financing on acceptable terms, or at all.
The conservatorship of Fannie Mae and Freddie Mac, their reliance upon the U.S. Government for solvency, and related efforts that may significantly affect Fannie Mae and Freddie Mac and their relationship with the U.S. Government, may adversely affect our business, operations and financial condition.
Due to increased market concerns about Fannie Mae and Freddie Mac’s ability to withstand future credit losses associated with securities held in their investment portfolios and on which they provide guarantees, without the direct support of the U.S. Government, Congress passed the Housing and Economic Recovery Act of 2008, or the HERA. Among other things, the HERA established the Federal Housing Finance Agency, or FHFA, which has broad regulatory powers over Fannie Mae and Freddie Mac. On September 6, 2008, the FHFA placed Fannie Mae and Freddie Mac into conservatorship and, together with the Treasury, established a program designed to boost investor confidence in Fannie Mae’s and Freddie Mac’s debt and mortgage-backed securities. As the conservator of Fannie Mae and Freddie Mac, the FHFA controls and directs their operations and may (1) take over the assets of and operate Fannie Mae and Freddie Mac with all the powers of their shareholders, directors and officers of Fannie Mae and Freddie Mac and conduct all business of Fannie Mae and Freddie Mac; (2) collect all obligations and money due to Fannie Mae and Freddie Mac; (3) perform all functions of Fannie Mae and Freddie Mac which are consistent with the conservator’s appointment; (4) preserve and conserve the assets and property of Fannie Mae and Freddie Mac; and (5) contract for assistance in fulfilling any function, activity, action or duty of the conservator.
The problems faced by Fannie Mae and Freddie Mac resulting in their placement into federal conservatorship and receipt of significant U.S. Government support have sparked debate among some federal policy makers regarding the continued role of the U.S. Government in providing liquidity for mortgage loans and mortgage-backed securities. With Fannie Mae’s and Freddie Mac’s future under debate, the nature of their guarantee obligations could be considerably limited relative to historical measurements. Any changes to the nature of their guarantee obligations could redefine what constitutes a mortgage-backed security and could have broad adverse implications for the market and our business, operations and financial condition. If Fannie Mae or Freddie Mac are eliminated, or their structures change radically (i.e., limitation or removal of the guarantee obligation), we may be unable to acquire Agency RMBS.
14
Although the Treasury previously committed capital to Fannie Mae and Freddie Mac through 2012, and in the report issued on February 11, 2011 by the U.S. Department of Treasury titled “Reforming America’s Housing Finance Market” committed to providing sufficient capital to enable Fannie Mae and Freddie Mac to meet their current and future guarantee obligations, there can be no assurance that these actions will be adequate for their needs. If these actions are inadequate, Fannie Mae and Freddie Mac could continue to suffer losses and could fail to honor their guarantees and other obligations. Furthermore, the current credit support provided by the Treasury to Fannie Mae and Freddie Mac, and any additional credit support it may provide in the future, could have the effect of lowering the interest rates we expect to receive from RMBS, and tightening the spread between the interest we earn on our RMBS and the cost of financing those assets.
Future policies that change the relationship between Fannie Mae and Freddie Mac and the U.S. Government, including those that result in their winding down, nationalization, privatization, or elimination, may create market uncertainty and have the effect of reducing the actual or perceived credit quality of securities issued or guaranteed by Fannie Mae or Freddie Mac. As a result, such policies could increase the risk of loss on investments in mortgage-backed securities guaranteed by Fannie Mae and/or Freddie Mac. It also is possible that such policies could adversely impact the market for such securities and other securities types and spreads at which they trade. All of the foregoing could materially and adversely affect our business, operations and financial condition.
We have exposure to European financial counterparties.
A significant portion of our Agency RMBS are financed with repurchase agreements. We secure our borrowings under these agreements by pledging our Agency RMBS as collateral to the lender. The collateral we pledge exceeds the amount of the borrowings under each agreement, typically with the extent of over collateralization being at least 5% of the amount borrowed. If the counterparty to the repurchase agreement defaults on its obligations and we are not able to recover our pledged assets, we are at risk of losing the over-collateralized amount. The amount of this exposure is the difference between the amount loaned to us plus interest due to the counterparty and the fair value of the collateral pledged by us to the lender including accrued interest receivable on such collateral.
We also use interest rate swaps to manage our interest rate risks. Under these swap agreements, we pledge Agency RMBS as collateral as part of a margin arrangement for interest rate swaps that are in an unrealized loss position. If a counterparty were to default on its obligation, we would be exposed to a loss to a swap counterparty to the extent that the amount of our Agency RMBS pledged exceeded the unrealized loss on the associated swaps and we were not able to recover the excess collateral.
Over the past several years, several large European financial institutions have experienced financial difficulty and have been either rescued by government assistance or by other large European banks or institutions. Some of these
financial institutions or their U.S. subsidiaries have provided us financing under repurchase agreements or we have entered into interest rate swaps with such institutions. We have entered into repurchase agreements and/or interest rate swaps with six financial institution counterparties that are either domiciled in Europe or a U.S.-based subsidiary of a European domiciled financial institution. It is possible that European credit crisis may impact the operations of the U.S. subsidiaries of a European domiciled financial institution. Our financings and operations could be adversely affected by such events.
We have received financing from a wholly-owned subsidiary of Annaly, which is a significant shareholder of ours and which owns our Manager.
Our ability to fund our investments on a leveraged basis depends to a large extent upon our ability to secure warehouse, repurchase and/or credit financing on acceptable terms. The current state of the Non-Agency mortgage sector has made it difficult for us to obtain short-term financing on favorable terms. As a result, we have completed loan securitizations in order to obtain long-term financing and terminated our un-utilized whole loan repurchase agreements in order to avoid paying non-usage fees under those agreements. In addition, commencing in 2009, we entered into a RMBS repurchase agreement with RCap, a wholly-owned subsidiary of Annaly. Annaly owns approximately 4.38% of our outstanding shares of common stock as of December 31, 2013. This agreement contains customary representations, warranties and covenants contained in such agreements including RCap having the right to make margin calls if the value of our RMBS collateralizing the agreement falls. As of December 31, 2013 and 2012, we had no amounts outstanding under this agreement. We cannot assure you that RCap will provide us with financing in the future. If RCap does not provide us with financing at a time we are unable to obtain other financing, we could be forced to sell our assets at an inopportune time when prices are depressed.
15
Risks Associated With Our Management and Relationship With Our Manager
We are dependent on our Manager and its key personnel for our success.
We have no separate facilities and are completely reliant on our Manager. We have no employees. Our executive officers are employees of our Manager, which has significant discretion as to the implementation of our investment and operating policies and strategies. Accordingly, we depend on the diligence, skill and network of business contacts of the senior management of our Manager. Our Manager’s employees evaluate, negotiate, structure, close and monitor our investments; therefore, our success will depend on their continued service. The departure of any of the senior managers of our Manager could have a material adverse effect on our performance. In addition, we can offer no assurance that our Manager will remain our investment manager or that we will continue to have access to our Manager’s senior managers. If the management agreement is terminated and no suitable replacement is found to manage us, we may not be able to execute our business plan. Moreover, our Manager is not obligated to dedicate certain of its employees exclusively to us nor is it obligated to dedicate any specific portion of its time to our business, and none of our Manager’s employees are contractually dedicated to us under our management agreement with our Manager. The only employees of our Manager who are primarily dedicated to our operations are Matthew Lambiase, our President and Chief Executive Officer, Robert Colligan, our Chief Financial Officer and Secretary, Mohit Marria, our Chief Investment Officer, and William B. Dyer, our Head of Underwriting.
There are conflicts of interest in our relationship with our Manager and Annaly, which could result in decisions that are not in the best interests of our stockholders.
We are subject to conflicts of interest arising out of our relationship with Annaly and our Manager. Specifically, each of our officers also serves as an employee of our Manager or its affiliates. As a result, our Manager and our officers may have conflicts between their duties to us and their duties to, and interests in, Annaly or our Manager.
There may also be conflicts in allocating investments which are suitable both for us and Annaly. Annaly may compete with us with respect to certain investments which we may want to acquire, and as a result we may either not be presented with the opportunity or have to compete with Annaly to acquire these investments. Our Manager and our officers may choose to allocate favorable investments to Annaly instead of to us. The ability of our Manager and its officers and employees to engage in other business activities may reduce the time our Manager spends managing us. Further, during turbulent conditions in the mortgage industry, distress in the credit markets or other times when we will need focused support and assistance from our Manager, Annaly will likewise require greater focus and attention, placing our Manager’s resources in high demand. In such situations, we may not receive the necessary support and assistance we require or would otherwise receive if we were internally managed. There is no assurance that the allocation policy that addresses some of the conflicts relating to our investments will be adequate to address all of the conflicts that may arise. In addition, we have entered into a repurchase agreement with RCap, our Manager’s affiliate, to finance our RMBS. This financing arrangement may give rise to further conflicts because RCap may be a creditor of ours. As one of our creditors, RCap’s interests may diverge from the interests of our stockholders.
16
We pay our Manager substantial management fees regardless of the performance of our portfolio. Our Manager’s entitlement to substantial nonperformance-based compensation might reduce its incentive to devote its time and effort to seeking investments that provide attractive risk-adjusted returns for our portfolio. This in turn could have a negative impact on both our ability to make distributions to our stockholders and the market price of our common stock. As of December 31, 2013, Annaly owns approximately 4.38% of our outstanding shares of common stock which entitles them to receive quarterly distributions. In evaluating investments and other management strategies, this may lead our Manager to place emphasis on the maximization of revenues at the expense of other criteria, such as preservation of capital. Investments with higher yield potential are generally riskier or more speculative. This could result in increased risk to the value of our invested portfolio. Annaly may sell their shares in us at any time. To the extent Annaly sells some of its shares, its interests may be less aligned with our interests.
The management agreement with our Manager was not negotiated on an arm’s-length basis and may not be as favorable to us as if it had been negotiated with an unaffiliated third party and may be difficult to terminate.
Our President and Chief Executive Officer, Chief Financial Officer and Secretary, Chief Investment Officer, and Head of Underwriting also serve as employees of our Manager. Our management agreement with our Manager was negotiated between related parties, and its terms, including fees payable, may not be as favorable to us as if it had been negotiated with an unaffiliated third party. Although our management agreement has been amended, termination of the management agreement may be difficult.
Our board of directors approved very broad investment guidelines for our Manager and will not approve each investment decision made by our Manager.
Our Manager is authorized to follow very broad investment guidelines. Our board of directors periodically reviews our investment guidelines and our investment portfolio, but does not, and is not required to review all of our proposed investments or any type or category of investment, except that an investment in a security structured or managed by our Manager must be approved by a majority of our independent directors. In addition, in conducting periodic reviews, our board of directors relies primarily on information provided to them by our Manager. Furthermore, our Manager uses complex strategies, and transactions entered into by our Manager may be difficult or impossible to unwind by the time they are reviewed by our board of directors. Our Manager has great latitude within the broad investment guidelines in determining the types of assets it may decide are proper investments for us, which could result in investment returns that are substantially below expectations or that result in losses, which would materially and adversely affect our business operations and results.
We may change our investment strategy, asset allocation, or financing plans without stockholder consent, which may result in riskier investments.
We may change our investment strategy, asset allocation, or financing plans at any time without the consent of our stockholders, which could result in our making investments that are different from, and possibly riskier than, the investments described in this 2013 Form 10-K. A change in our investment strategy or financing plans may increase our exposure to interest rate and default risk and real estate market fluctuations. Furthermore, a change in our asset allocation could result in our making investments in asset categories different from those described in this 2013 Form 10-K. These changes could adversely affect the market price of our common stock and our ability to make distributions to our stockholders.
While investments in investment vehicles managed by our Manager require approval by a majority of our independent directors, our Manager has an incentive to invest our funds in investment vehicles managed by our Manager because of the possibility of generating an additional incremental management fee, which may reduce other investment opportunities available to us. In addition, we cannot assure you that investments in investment vehicles managed by our Manager will prove beneficial to us.
Our investment focus is different from those of other entities that have been managed by our Manager.
Our investment focus is different from those of other entities that have been managed by our Manager. Accordingly, our Manager’s historical returns are not indicative of its performance for our investment strategy and we can offer no assurance that our Manager will replicate the historical performance of the Manager’s investment professionals in their previous endeavors. Our investment returns could be substantially lower than the returns achieved by our Manager’s investment professionals’ previous endeavors.
17
We compete with Annaly for access to our Manager’s resources and investment opportunities.
Some of our Manager’s personnel are also employees of Annaly and in that capacity are involved in Annaly’s investment process. Accordingly, we will compete with Annaly for our Manager’s resources. Annaly has an investment focus that overlaps with ours, which could result in us competing for access to the benefits that we expect our relationship with our Manager will provide to us.
Risks Related To Our Business
Our reported GAAP financial results differ from the taxable income results that impact our dividend distribution requirements and, therefore, our GAAP results may not be an accurate indicator of future taxable income and dividend distributions.
Generally, the cumulative net income we report over the life of an asset will be the same for GAAP and tax purposes, although the timing of this income recognition over the life of the asset could be materially different. Differences exist in the accounting for GAAP net income and REIT taxable income which can lead to significant variances in the amount and timing of when income and losses are recognized under these two measures. Due to these differences, our reported GAAP financial results could materially differ from our determination of taxable income results, which impacts our dividend distribution requirements, and, therefore, our GAAP results may not be an accurate indicator of future taxable income and dividend distributions.
We may generate taxable income in excess of our GAAP income on Non-Agency RMBS purchased at a discount to par value, which may result in significant timing variances in the recognition of income and losses.
We have acquired and intend to continue to acquire Non-Agency RMBS at prices that reflect significant market discounts on their unpaid principal balances. For financial statement reporting purposes, we generally establish a portion of this market discount as a Non-Accretable Difference. This credit reserve is generally not accreted into income for financial statement reporting purposes. For tax purposes, however, we are not permitted to anticipate, or establish a reserve for, credit losses prior to their occurrence. As a result, the entire market discount is accreted into income in determining taxable income during periods in which no actual losses are incurred. Losses are only recognized for tax purposes when incurred (thus lowering taxable income in periods in which losses are incurred). These differences in accounting for tax and GAAP can lead to significant timing variances in the recognition of income and losses. Taxable income on Non-Agency RMBS purchased at a discount to their par value may be higher than GAAP earnings in early periods (before losses are actually incurred). Because we distribute dividends to our stockholders based on our taxable income, our dividend distributions could exceed our GAAP income in periods during which our taxable income exceeds our GAAP income on Non-Agency RMBS purchased at discount to par value.
Failure to procure adequate capital and funding on favorable terms, or at all, would adversely affect our results and may, in turn, negatively affect the market price of shares of our common stock and our ability to distribute dividends to our stockholders.
We depend upon the availability of adequate funding and capital for our operations. We intend to finance our assets over the long-term through a variety of means, including repurchase agreements, credit facilities and securitizations. Our access to capital depends upon a number of factors over which we have little or no control, including:
|
●
|
general market conditions;
|
|
●
|
the market’s perception of our growth potential;
|
|
●
|
our current and potential future earnings and cash distributions;
|
|
●
|
the market price of the shares of our capital stock; and
|
|
●
|
the market’s view of the quality of our assets.
|
18
We have used and may in the future use a number of sources to finance our investments, including repurchase agreements, warehouse facilities and securitizations. Current market conditions have affected the cost and availability of financing from each of these sources — and their individual providers — to different degrees; some are available but at a high cost, and some are largely unaffected. For example, in the repurchase agreement market, borrowers have been affected differently depending on the type of security they are financing. Non-Agency RMBS have been harder or more expensive to finance, depending on the type of assets collateralizing the RMBS.
The impairment of financial institutions could negatively affect us. If one or more major market participants fail or otherwise experience a major liquidity crisis, it could adversely affect the marketability of all fixed income securities and this could negatively impact the value of the securities we acquire, thus reducing our net book value.
Furthermore, if any of our lenders or any of our potential lenders are unwilling or unable to provide us with financing, we could be forced to sell our securities or residential mortgage loans at an inopportune time when prices are depressed.
Our business, results of operations and financial condition may be materially adversely affected by disruptions in the financial markets. We cannot assure you, under such extreme conditions, that these markets will remain an efficient source of long-term financing for our assets. If our strategy is not viable, we will have to find alternative forms of financing for our assets, which may not be available. Further, as a REIT, we are required to distribute annually at least 90% of our REIT taxable income (subject to certain adjustments) to our stockholders and are, therefore, not able to retain significant amounts of our earnings for new investments. We cannot assure you that any, or sufficient, funding or capital will be available to us in the future on terms that are acceptable to us. If we cannot obtain sufficient funding on acceptable terms, there may be a negative impact on the market price of our common stock and our ability to make distributions to our stockholders. Moreover, our ability to grow will be dependent on our ability to procure additional funding. To the extent we are not able to raise additional funds through the issuance of additional equity or borrowings, our growth will be constrained.
We operate in a highly competitive market for investment opportunities and more established competitors may be able to compete more effectively for investment opportunities than we can.
A number of entities compete with us to make the types of investments that we plan to make. We compete with other REITs, public and private funds, commercial and investment banks and commercial finance companies. Many of our competitors are substantially larger and have considerably greater financial, technical and marketing resources than we do. Several other REITs have raised, or are expected to raise, significant amounts of capital, and may have investment objectives that overlap with ours, which may create competition for investment opportunities. Some competitors may have a lower cost of funds and access to funding sources that are not available to us. In addition, some of our competitors may have higher risk tolerances or different risk assessments, which could allow them to consider a wider variety of investments and establish more favorable relationships than us. We cannot assure you that the competitive pressures we face will not have a material adverse effect on our business, financial condition and results of operations. Also, as a result of this competition, we may not be able to take advantage of attractive investment opportunities from time to time, and we can offer no assurance that we will be able to identify and make investments that are consistent with our investment objectives.
Loss of our 1940 Act exemption would adversely affect us and negatively affect the market price of shares of our common stock and our ability to distribute dividends and could result in the termination of the management agreement with our Manager.
We conduct our operations so that neither we nor any of our subsidiaries are required to register as an investment company under the 1940 Act. Because we are a holding company that will conduct its businesses primarily through wholly-owned subsidiaries, the securities issued by these subsidiaries that are excepted from the definition of “investment company” under Section 3(c)(1) or Section 3(c)(7) of the 1940 Act, together with any other investment securities we may own, may not have a combined value in excess of 40% of the value of our adjusted total assets on an unconsolidated basis. This requirement limits the types of businesses in which we may engage through our subsidiaries. In addition, the assets we and our subsidiaries may acquire are limited by the provisions of the 1940 Act, the rules and regulations promulgated under the 1940 Act and SEC staff interpretative guidance, which may adversely affect our performance.
19
If the value of securities issued by our subsidiaries that are excepted from the definition of “investment company” by Section 3(c)(1) or 3(c)(7) of the 1940 Act, together with any other investment securities we own, exceeds 40% of our adjusted total assets on an unconsolidated basis, or if one or more of such subsidiaries fail to maintain an exception or exemption from the 1940 Act, we could, among other things, be required either (a) to substantially change the manner in which we conduct our operations to avoid being required to register as an investment company or (b) to register as an investment company under the 1940 Act, either of which could have an adverse effect on us and the market price of our securities. If we were required to register as an investment company under the 1940 Act, we would become subject to substantial regulation with respect to our capital structure (including our ability to use leverage), management, operations, transactions with affiliated persons (as defined in the 1940 Act), portfolio composition, including restrictions with respect to diversification and industry concentration, and other matters.
Certain of our subsidiaries rely on the exemption from registration provided by Section 3(c)(5)(C) of the 1940 Act. Section 3(c)(5)(C) as interpreted by the staff of the SEC, requires us to invest at least 55% of our assets in “mortgages and other liens on and interest in real estate” (or Qualifying Real Estate Assets) and at least 80% of our assets in Qualifying Real Estate Assets plus real estate related assets. The assets that we acquire, therefore, are limited by the provisions of the 1940 Act and the rules and regulations promulgated under the 1940 Act. On August 31, 2011, the SEC issued a concept release titled “Companies Engaged in the Business of Acquiring Mortgages and Mortgage-Related Instruments” (SEC Release No. IC-29778). Under the concept release, the SEC is reviewing interpretive issues related to the Section 3(c)(5)(C) exemption. The potential outcomes of the SEC’s actions are unclear as is the SEC’s timetable for its review and actions. If the SEC determines that any of our securities are not Qualifying Real Estate Assets or real estate related assets or otherwise believes we do not satisfy the exemption under Section 3(c)(5)(C), we could be required to restructure our activities or sell certain of our assets. The net effect of these factors will be to lower our net interest income. If we fail to qualify for exemption from registration as an investment company, our ability to use leverage would be substantially reduced, and we would not be able to conduct our business as described. Our business will be materially and adversely affected if we fail to qualify for this exemption.
Certain of our subsidiaries may rely on the exemption provided by Section 3(c)(6) which excludes from the definition of “investment company” any company primarily engaged, directly or through majority-owned subsidiaries, in a business, among others, described in Section 3(c)(5)(C) of the 1940 Act (from which not less than 25% of such company’s gross income during its last fiscal year was derived) together with an additional business or additional businesses other than investing, reinvesting, owning, holding or trading in securities. The SEC staff has issued little interpretive guidance with respect to Section 3(c)(6) and any guidance published by the staff could require us to adjust our strategy accordingly.
We expect certain of our subsidiaries we may form in the future to rely on Section 3(c)(7) for their 1940 Act exemption and, therefore our interest in each of these subsidiaries would constitute an “investment security” for purposes of determining whether we pass the 40% test.
We may in the future, however, organize one or more subsidiaries that seek to rely on the 1940 Act exemption provided to certain structured financing vehicles by Rule 3a-7. If we organize subsidiaries that rely on Rule 3a-7 for an exemption from the 1940 Act, these subsidiaries will also need to comply with the restrictions described in “Business—Operating and Regulatory Structure—1940 Act Exemption.” In general, Rule 3a-7 exempts from the 1940 Act issuers that limit their activities as follows:
|
●
|
the issuer issues securities the payment of which depends primarily on the cash flow from “eligible assets” that by their terms convert into cash within a finite time period;
|
|
●
|
the securities sold are fixed income securities rated investment grade by at least one rating agency (fixed income securities which are unrated or rated below investment grade may be sold to institutional accredited investors and any securities may be sold to “qualified institutional buyers” and to persons involved in the organization or operation of the issuer);
|
20
|
●
|
the issuer acquires and disposes of eligible assets (1) only in accordance with the agreements pursuant to which the securities are issued, (2) so that the acquisition or disposition does not result in a downgrading of the issuer’s fixed income securities and (3) the eligible assets are not acquired or disposed of for the primary purpose of recognizing gains or decreasing losses resulting from market value changes; and
|
|
●
|
unless the issuer is issuing only commercial paper, the issuer appoints an independent trustee, takes reasonable steps to transfer to the trustee an ownership or perfected security interest in the eligible assets, and meets rating agency requirements for commingling of cash flows.
|
Any subsidiary also would need to be structured to comply with any guidance that may be issued by the Division of Investment Management of the SEC on how the subsidiary must be organized to comply with the restrictions contained in Rule 3a-7. Compliance with Rule 3a-7 may require that the indenture governing the subsidiary include additional limitations on the types of assets the subsidiary may sell or acquire out of the proceeds of assets that mature, are refinanced or otherwise sold, on the period of time during which such transactions may occur, and on the amount of transactions that may occur. In light of the requirements of Rule 3a-7, our ability to manage assets held in a special purpose subsidiary that complies with Rule 3a-7 will be limited and we may not be able to purchase or sell assets owned by that subsidiary when we would otherwise desire to do so, which could lead to losses. We currently limit the aggregate value of our interests in our subsidiaries that may in the future seek to rely on Rule 3a-7 to 20% or less of our total assets on an unconsolidated basis, as we continue to discuss with the SEC staff the use of subsidiaries that rely on Rule 3a-7 to finance our operations.
The determination of whether an entity is a majority-owned subsidiary of our company is made by us. The 1940 Act defines a majority-owned subsidiary of a person as a company of which 50% or more of the outstanding voting securities are owned by such person, or by another company which is a majority-owned subsidiary of such person. The 1940 Act further defines voting securities as any security presently entitling the owner or holder thereof to vote for the election of directors of a company. We treat companies in which we own at least a majority of the outstanding voting securities as majority-owned subsidiaries for purposes of the 40% test. We have not requested the SEC to approve our treatment of any company as a majority-owned subsidiary and the SEC has not done so. If the SEC were to disagree with our treatment of one or more companies as majority-owned subsidiaries, we would need to adjust our strategy and our assets in order to continue to pass the 40% test. Any such adjustment in our strategy could have a material adverse effect on us.
There can be no assurance that the laws and regulations governing the 1940 Act status of REITs, including the Division of Investment Management of the SEC providing more specific or different guidance regarding these exemptions, will not change in a manner that adversely affects our operations. If we or our subsidiaries fail to maintain an exception or exemption from the 1940 Act, we could, among other things, be required either to (a) change the manner in which we conduct our operations to avoid being required to register as an investment company, (b) effect sales of our assets in a manner that, or at a time when, we would not otherwise choose to do so, or (c) register as an investment company, any of which could negatively affect the value of our common stock, the sustainability of our business model, and our ability to make distributions which could have an adverse effect on our business and the market price for our shares of common stock.
Rapid changes in the values of our RMBS, residential mortgage loans, and other real estate-related investments may make it more difficult for us to maintain our qualification as a REIT or our exemption from the 1940 Act.
If the market value or income potential of our RMBS, residential mortgage loans, and other real estate-related investments declines as a result of increased interest rates, prepayment rates or other factors, we may need to increase our real estate investments and income or liquidate our non-qualifying assets to maintain our REIT qualification or our exemption from the 1940 Act. If the decline in real estate asset values or income occurs quickly, this may be especially difficult to accomplish. This difficulty may be exacerbated by the illiquid nature of any non-real estate assets we may own. We may have to make investment decisions that we otherwise would not make absent the REIT and 1940 Act considerations.
21
We may have significant credit risk, especially on Non-Agency RMBS, in certain geographic areas and may be disproportionately affected by economic or housing downturns, natural disasters, terrorist events, adverse climate changes or other adverse events specific to those markets.
A significant number of the mortgages collateralizing our RMBS may be concentrated in certain geographic areas. For example, with respect to our Non-Agency RMBS portfolio, we have significantly higher exposure in California, Florida, New York, New Jersey and Maryland. Certain markets within these states (particularly California and Florida) experienced significant decreases in residential home value during the recent housing crisis and continue to experience challenging economic and real estate conditions. Any event that adversely affects the economy or real estate market in these states could have a disproportionately adverse effect on our Non-Agency RMBS portfolio. In general, any material decline in the economy or significant difficulties in the real estate markets would be likely to cause a decline in the value of residential properties securing the mortgages in the relevant geographic area. This, in turn, would increase the risk of delinquency, default and foreclosure on real estate collateralizing our Non-Agency RMBS in this area. This may then materially adversely affect our credit loss experience on our Non-Agency RMBS in such area if unexpectedly high rates of default (e.g., in excess of the default rates forecasted) and/or higher than expected loss severities on the mortgages collateralizing such securities were to occur.
The occurrence of a natural disaster (such as an earthquake, tornado, hurricane or a flood) or a significant adverse climate change may cause a sudden decrease in the value of real estate and would likely reduce the value of the properties securing the mortgages collateralizing our Non-Agency RMBS. Since certain natural disasters may not typically be covered by the standard hazard insurance policies maintained by borrowers, the borrowers may have to pay for repairs due to the disasters. Borrowers may not repair their property or may stop paying their mortgages under those circumstances. This would likely cause defaults and credit loss severities to increase on the pool of mortgages securing our Non-Agency RMBS which, unlike Agency RMBS, are not guaranteed as to principal and/or interest by the U.S. Government, any federal agency or federally chartered corporation.
We leverage our investments, which may adversely affect our return on our investments and may reduce cash available for distribution to our stockholders.
We leverage our investments through borrowings, generally through the use of repurchase agreements, warehouse facilities, credit facilities and securitizations. We are not required to maintain any specific debt-to-equity ratio. The amount of leverage we use varies depending on our ability to obtain credit facilities, the lenders’ and rating agencies’ estimates of the stability of the investments’ cash flow, and our assessment of the appropriate amount of leverage for the particular assets we are funding. Under some credit facilities, we expect to be required to maintain minimum average cash balances in connection with borrowings. Our return on our investments and cash available for distribution to our stockholders may be reduced to the extent that changes in market conditions prevent us from leveraging our investments, require us to decrease our rate of leverage, increase the amount of collateral we post, or increase the cost of our financing relative to the income that can be derived from the assets acquired. Our debt service payments will reduce cash flow available for distributions to stockholders, which could adversely affect the price of our common stock. We may not be able to meet our debt service obligations, and, to the extent that we cannot, we risk the loss of some or all of our assets to foreclosure or sale to satisfy the obligations. We leverage certain of our assets through repurchase agreements. A decrease in the value of these assets may lead to margin calls which we will have to satisfy. We may not have the funds available to satisfy any such margin calls and we may be forced to sell assets at significantly depressed prices due to market conditions or otherwise. The satisfaction of such margin calls may reduce cash flow available for distribution to our stockholders. Any reduction in distributions to our stockholders or sales of assets at inopportune times or prices may cause the value of our common stock to decline, in some cases, precipitously.
We depend on warehouse and repurchase facilities and credit facilities to execute our business plan, and our inability to access funding could have a material adverse effect on our results of operations, financial condition and business.
Our ability to fund our investments depends to a large extent upon our ability to secure warehouse, repurchase and credit financing on acceptable terms. We can provide no assurance that we will be successful in establishing sufficient warehouse, repurchase, and credit facilities. In addition, because warehouse, repurchase, and credit facilities are short-term commitments of capital, the lenders may respond to market conditions, which may favor an alternative investment strategy for them, making it more difficult for us to secure continued financing. During certain periods of the credit cycle, such as recently, lenders may curtail their willingness to provide financing. If we are not able to renew our then existing warehouse, repurchase, and credit facilities or arrange for new financing on terms acceptable to us, or if we default on our covenants or are otherwise unable to access funds under any of these facilities, we will have to curtail our asset acquisition activities.
22
It is possible that the lenders that provide us with financing could experience changes in their ability to advance funds to us, independent of our performance or the performance of our investments, including our mortgage loans. In addition, if the regulatory capital requirements imposed on our lenders change, they may be required to significantly increase the cost of the warehouse facilities that they provide to us. Our lenders also may revise their eligibility requirements for the types of residential mortgage loans they are willing to finance or the terms of such financings, based on, among other factors, the regulatory environment and their management of perceived risk, particularly with respect to assignee liability. Financing of equity-based lending, for example, may become more difficult in the future. Moreover, the amount of financing we will receive under our warehouse and repurchase facilities will be directly related to the lenders’ valuation of the assets that secure the outstanding borrowings. Typically warehouse, repurchase, and credit facilities grant the respective lender the absolute right to reevaluate the market value of the assets that secure outstanding borrowings at any time. If a lender determines in its sole discretion that the value of the assets has decreased, it has the right to initiate a margin call. A margin call would require us to transfer additional assets to such lender without any advance of funds from the lender for such transfer or to repay a portion of the outstanding borrowings. Any such margin call could have a material adverse effect on our results of operations, financial condition, business, liquidity and ability to make distributions to our stockholders, and could cause the value of our common stock to decline. We may be forced to sell assets at significantly depressed prices to meet such margin calls and to maintain adequate liquidity, which could cause us to incur losses. Moreover, to the extent we are forced to sell assets at such time, given market conditions, we may be forced to sell assets at the same time as others facing similar pressures to sell similar assets, which could greatly exacerbate a difficult market environment and which could result in our incurring significantly greater losses on our sale of such assets. In an extreme case of market duress, a market may not even be present for certain of our assets at any price.
Certain financing facilities may contain covenants that restrict our operations and may inhibit our ability to grow our business and increase revenues.
Certain financing facilities we may enter into may contain extensive restrictions, covenants, and representations and warranties that, among other things, require us to satisfy specified financial, asset quality, loan eligibility and loan performance tests. If we fail to meet or satisfy any of these covenants or representations and warranties, we would be in default under these agreements and our lenders could elect to declare all amounts outstanding under the agreements to be immediately due and payable, enforce their respective interests against collateral pledged under such agreements and restrict our ability to make additional borrowings. Certain financing agreements may contain cross-default provisions, so that if a default occurs under any one agreement, the lenders under our other agreements could also declare a default. The covenants and restrictions we expect in our financing facilities may restrict our ability to, among other things:
|
●
|
incur or guarantee additional debt;
|
|
●
|
make certain investments or acquisitions;
|
|
●
|
make distributions on or repurchase or redeem capital stock;
|
|
●
|
engage in mergers or consolidations;
|
|
●
|
finance mortgage loans with certain attributes;
|
|
●
|
reduce liquidity below certain levels;
|
|
●
|
grant liens;
|
|
●
|
incur operating losses for more than a specified period;
|
|
●
|
enter into transactions with affiliates; and
|
|
●
|
hold mortgage loans for longer than established time periods.
|
Our failure to be current in our reporting requirements with the SEC diminishes our ability to enable our counterparties who do not have transparency into our financial performance. We currently finance only that portion of our portfolio that is Agency RMBS. To date, we have not had any counterparties to our borrowing arrangements terminate any relationships as a result of our failure to be current in our reporting requirements with the SEC, however, we have proactively reduced the amount of borrowings under our master repurchase agreements with respect to Agency RMBS to ensure that we are able to meet any margin calls.
23
These restrictions may interfere with our ability to obtain financing, or to engage in other business activities, which may have a significant negative impact on our business, financial condition, liquidity and results of operations. A default and resulting repayment acceleration could significantly reduce our liquidity, which could require us to sell our assets to repay amounts due and outstanding. This could also significantly harm our business, financial condition, results of operations, and our ability to make distributions, which could cause the value of our common stock to decline. A default will also significantly limit our financing alternatives such that we will be unable to pursue our leverage strategy, which could curtail our investment returns.
The repurchase agreements, warehouse facilities and credit facilities that we use to finance our investments may require us to provide additional collateral and may restrict us from leveraging our assets as fully as desired.
We use repurchase agreements, warehouse facilities and credit facilities to finance our investments. We currently have uncommitted repurchase agreements with 16 counterparties, including RCap, for financing our RMBS. We expect to add additional repurchase counterparties in the future. Our repurchase agreements are uncommitted and the counterparty may refuse to advance funds under the agreements to us. If the market value of the loans or securities pledged or sold by us to a funding source decline in value, we may be required by the lending institution to provide additional collateral or pay down a portion of the funds advanced, but we may not have the funds available to do so. Posting additional collateral will reduce our liquidity and limit our ability to leverage our assets, which could adversely affect our business. In the event we do not have sufficient liquidity to meet such requirements, lending institutions can accelerate repayment of our indebtedness, increase our borrowing rates, liquidate our collateral or terminate our ability to borrow. Such a situation would likely result in a rapid deterioration of our financial condition and possibly necessitate a filing for protection under the U.S. Bankruptcy Code. Further, financial institutions may require us to maintain a certain amount of cash that is not invested or to set aside non-levered assets sufficient to maintain a specified liquidity position which would allow us to satisfy our collateral obligations. As a result, we may not be able to leverage our assets as fully as we would choose which could reduce our return on equity. If we are unable to meet these collateral obligations, then, as described above, our financial condition could deteriorate rapidly.
If the counterparty to our repurchase transactions defaults on its obligation to resell the underlying security back to us at the end of the transaction term, or if the value of the underlying security has declined as of the end of that term or if we default on our obligations under the repurchase agreement, we will lose money on our repurchase transactions.
When we engage in a repurchase transaction, we generally sell securities to the transaction counterparty and receive cash from the counterparty. The counterparty is obligated to resell the securities back to us at the end of the term of the transaction, which is typically 30-90 days. Because the cash we receive from the counterparty when we initially sell the securities to the counterparty is less than the value of those securities (this difference is referred to as the haircut), if the counterparty defaults on its obligation to resell the securities back to us we would incur a loss on the transaction equal to the amount of the haircut (assuming there was no change in the value of the securities). We would also lose money on a repurchase transaction if the value of the underlying securities has declined as of the end of the transaction term, as we would have to repurchase the securities for their initial value but would receive securities worth less than that amount. Any losses we incur on our repurchase transactions could adversely affect our earnings, and thus our cash available for distribution to our stockholders. If we default on one of our obligations under a repurchase transaction, the counterparty can terminate the transaction and cease entering into any other repurchase transactions with us. In that case, we would likely need to establish a replacement repurchase facility with another repurchase dealer in order to continue to leverage our portfolio and carry out our investment strategy. There is no assurance we would be able to establish a suitable replacement facility.
24
Our rights under our repurchase agreements are subject to the effects of the bankruptcy laws in the event of the bankruptcy or insolvency of us or our lenders under the repurchase agreements.
In the event of our insolvency or bankruptcy, certain repurchase agreements may qualify for special treatment under the U.S. Bankruptcy Code, the effect of which, among other things, would be to allow the lender under the applicable repurchase agreement to avoid the automatic stay provisions of the U.S. Bankruptcy Code and to foreclose on the collateral agreement without delay. In the event of the insolvency or bankruptcy of a lender during the term of a repurchase agreement, the lender may be permitted, under applicable insolvency laws, to repudiate the contract, and our claim against the lender for damages may be treated simply as an unsecured creditor. In addition, if the lender is a broker or dealer subject to the Securities Investor Protection Act of 1970, or an insured depository institution subject to the Federal Deposit Insurance Act, our ability to exercise our rights to recover our securities under a repurchase agreement or to be compensated for any damages resulting from the lender’s insolvency may be further limited by those statutes. These claims would be subject to significant delay and, if and when received, may be substantially less than the damages we actually incur.
An increase in our borrowing costs relative to the interest we receive on our assets may adversely affect our profitability, and thus our cash available for distribution to our stockholders.
As our repurchase agreements and other short-term borrowings mature, we will be required either to enter into new borrowings or to sell certain of our investments. An increase in short-term interest rates at the time that we seek to enter into new borrowings would reduce the spread between our returns on our assets and the cost of our borrowings. This would adversely affect our returns on our assets that are subject to prepayment risk, including our RMBS, which might reduce earnings and, in turn, cash available for distribution to our stockholders.
If we issue senior securities we will be exposed to additional risks.
If we decide to issue senior securities in the future, it is likely that they will be governed by an indenture or other instrument containing covenants restricting our operating flexibility. Additionally, any convertible or exchangeable securities that we issue in the future may have rights, preferences and privileges more favorable than those of our common stock and may result in dilution to owners of our common stock. We and, indirectly, our stockholders, will bear the cost of issuing and servicing such securities.
Our securitizations will expose us to additional risks.
We securitize and may continue to securitize certain of our portfolio investments to generate cash for funding new investments. We expect to structure these transactions either as financing transactions or as sales for GAAP. In each such transaction, we convey a pool of assets to a special purpose vehicle, the issuing entity, and the issuing entity issues one or more classes of non-recourse notes pursuant to the terms of an indenture. The notes are secured by the pool of assets. In exchange for the transfer of assets to the issuing entity, we receive the cash proceeds of the sale of non-recourse notes and a 100% interest in the equity of the issuing entity. The securitization of our portfolio investments might magnify our exposure to losses on those portfolio investments because any equity interest we retain in the issuing entity would be subordinate to the notes issued to investors and we would, therefore, absorb all of the losses sustained with respect to a securitized pool of assets before the owners of the notes experience any losses. Moreover, we cannot be assured that we will be able to access the securitization market, or be able to do so at favorable rates. The inability to securitize our portfolio could hurt our performance and our ability to grow our business.
Hedging against interest rate exposure may adversely affect our earnings, which could reduce our cash available for distribution to our stockholders.
Subject to maintaining our qualification as a REIT, we pursue various hedging strategies to seek to reduce our exposure to losses from adverse changes in interest rates. Our hedging activity varies in scope based on the level and volatility of interest rates, the type of assets held and other changing market conditions. Interest rate hedging may fail to protect or could adversely affect us because, among other things:
|
●
|
interest rate hedging can be expensive, particularly during periods of rising and volatile interest rates;
|
|
●
|
available interest rate hedges may not correspond directly with the interest rate risk for which protection is sought;
|
|
●
|
the duration of the hedge may not match the duration of the related liability;
|
|
●
|
the amount of income that a REIT may earn from hedging transactions to offset interest rate losses may be limited by federal tax provisions governing REITs;
|
|
●
|
the credit quality of the party owing money on the hedge may be downgraded to such an extent that it impairs our ability to sell or assign our side of the hedging transaction; and
|
|
●
|
the party owing money in the hedging transaction may default on its obligation to pay.
|
25
Our hedging transactions, which are intended to limit losses, may actually limit gains and increase our exposure to losses. As a result, our hedging activity may adversely affect our earnings, which could reduce our cash available for distribution to our stockholders. In addition, some hedging instruments involve risk since they are not currently traded on regulated exchanges, guaranteed by an exchange or its clearing house, or regulated by any U.S. or foreign governmental authorities. Consequently, there are no requirements with respect to record keeping, financial responsibility or segregation of customer funds and positions. Furthermore, the enforceability of agreements underlying derivative transactions may depend on compliance with applicable statutory and commodity and other regulatory requirements and, depending on the identity of the counterparty, applicable international requirements. The business failure of a hedging counterparty with whom we enter into a hedging transaction will most likely result in its default. Default by a party with whom we enter into a hedging transaction may result in the loss of unrealized profits and force us to cover our commitments, if any, at the then current market price. Although generally we will seek to reserve the right to terminate our hedging positions, it may not always be possible to dispose of or close out a hedging position without the consent of the hedging counterparty, and we may not be able to enter into an offsetting contract in order to cover our risk. We cannot assure you that a liquid secondary market will exist for hedging instruments purchased or sold, and we may be required to maintain a position until exercise or expiration, which could result in losses.
Our hedging strategies may not be successful in mitigating the risks associated with interest rates.
Subject to complying with REIT tax requirements, we have employed and intend to continue to employ techniques that limit, or hedge, the adverse effects of rising interest rates on our short-term repurchase agreements. In general, our hedging strategy depends on our view of our entire portfolio, consisting of assets, liabilities and derivative instruments, in light of prevailing market conditions. We could misjudge the condition of our investment portfolio or the market.
Our hedging activity will vary in scope based on the level and volatility of interest rates and principal repayments, the type of securities held and other changing market conditions. Our actual hedging decisions will be determined in light of the facts and circumstances existing at the time and may differ from our currently anticipated hedging strategy. These techniques may include entering into interest rate caps, collars, floors, forward contracts, futures, options or swap agreements. We may conduct certain hedging transactions through a TRS, which will be subject to federal, state and, if applicable, local income tax.
There are no perfect hedging strategies, and interest rate hedging may fail to protect us from loss. Alternatively, we may fail to properly assess a risk to our investment portfolio or may fail to recognize a risk entirely, leaving us exposed to losses without the benefit of any offsetting hedging activities. The derivative financial instruments we select may not have the effect of reducing our interest rate risk. The nature and timing of hedging transactions may influence the effectiveness of these strategies. Poorly designed strategies or improperly executed transactions could actually increase our risk and losses. In addition, hedging activities could result in losses if the event against which we hedge does not occur. For example, interest rate hedging could fail to protect us or adversely affect us because, among other things:
|
●
|
available interest rate hedging may not correspond directly with the interest rate risk for which protection is sought;
|
|
●
|
the duration of the hedge may not match the duration of the related liability;
|
|
●
|
as explained in further detail in the risk factor immediately below, the party owing money in the hedging transaction may default on its obligation to pay;
|
|
●
|
the credit quality of the party owing money on the hedge may be downgraded to such an extent that it impairs our ability to sell or assign our side of the hedging transaction; and
|
|
●
|
the value of derivatives used for hedging may be adjusted from time to time in accordance with accounting rules to reflect changes in fair value. Downward adjustments, or “mark-to-market losses,” would reduce our stockholders’ equity.
|
Whether the derivatives we acquire achieve hedge accounting treatment or not, hedging generally involves costs and risks. Our hedging strategies may adversely affect us because hedging activities involve costs that we will incur regardless of the effectiveness of the hedging activity. Those costs may be higher in periods of market volatility, both because the counterparties to our derivative agreements may demand a higher payment for taking risks, and transaction costs to adjust our hedges during periods of interest rate changes also may increase costs. Especially if our hedging strategies are not effective, we could incur significant hedging-related costs without any corresponding economic benefits.
26
We have elected not to qualify for hedge accounting treatment.
We record derivative and hedge transactions in accordance with GAAP. Our interest rate swaps have not been designated as hedging instruments for accounting purposes. Consequently, changes in the fair value of swaps are reported as a component of net income in the Consolidated Statements of Operations and Comprehensive Income (Loss).
We have experienced declines in the market value of our assets resulting in us recording impairments, which
have had an adverse effect on our results of operations and financial condition.
A decline in the market value of our RMBS or other assets may require us to recognize an other-than-temporary impairment (or “OTTI”) against such assets under GAAP. When the fair value of our RMBS is less than its amortized cost, the security is considered impaired. We assess our impaired securities on at least a quarterly basis and designate such impairments as either temporary or other-than-temporary. The determination as to whether an OTTI exists and, if so, the amount we consider other-than-temporarily impaired is subjective, as such determinations are based on both factual and subjective information available at the time of assessment. As a result, the timing and amount of OTTI constitute material estimates that are susceptible to significant change. In the future, we may experience declines in the fair value of our RMBS and other assets that could result in additional OTTI that will be recognized in earnings.
Declines in the fair values of our investments may adversely affect periodic reported results and credit availability, which may reduce earnings and, in turn, cash available for distribution to our stockholders.
A substantial portion of our assets are classified for accounting purposes as “available-for-sale” and carried at fair value. Changes in the fair values of those assets will be directly charged or credited to OCI. In addition, a decline in values will reduce the book value of our assets. A decline in the fair value of our assets may adversely affect us, particularly in instances where we have borrowed money based on the fair value of those assets. If the fair value of those assets declines, the lender may require us to post additional collateral to support the loan. If we were unable to post the additional collateral, we would have to sell the assets at a time when we might not otherwise choose to do so. A reduction in credit available may reduce our ability to invest and to earn interest income which would reduce cash available for distribution to stockholders.
The lack of liquidity in our investments may adversely affect our business.
We may invest in securities or other instruments that are not liquid. It may be difficult or impossible to obtain third party pricing on the investments we purchase. Illiquid investments typically experience greater price volatility as a ready market does not exist. In addition, validating third party pricing for illiquid investments may be more subjective than more liquid investments. The illiquidity of our investments may make it difficult for us to sell such investments if the need or desire arises. In addition, if we are required to liquidate all or a portion of our portfolio quickly, we may realize significantly less than the value at which we have previously recorded our investments. As a result, our ability to vary our portfolio in response to changes in economic and other conditions may be relatively limited, which could adversely affect our results of operations and financial condition.
We are highly dependent on information systems and third parties, and systems failures could significantly disrupt our business, which may, in turn, negatively affect the market price of our common stock and our ability to pay dividends to our stockholders.
Our business is highly dependent on communications and information systems. Any failure or interruption of our systems or cyber-attacks or security breaches of our networks or systems could cause delays or other problems in our securities trading activities, including mortgage-backed securities trading activities, which could have a material adverse effect on our operating results and negatively affect the market price of our common stock and our ability to pay dividends to our stockholders. In addition, we also face the risk of operational failure, termination or capacity constraints of any of the third parties with which we do business or that facilitate our business activities, including clearing agents or other financial intermediaries we use to facilitate our securities transactions.
27
Computer malware, viruses, and computer hacking and phishing attacks have become more prevalent in our industry and may occur on our systems in the future. We rely heavily on our financial, accounting and other data processing systems. It is difficult to determine what, if any, negative impact may directly result from any specific interruption or cyber-attacks or security breaches of our networks or systems or any failure to maintain performance, reliability and security of our technical infrastructure. However, any such computer malware, viruses, and computer hacking and phishing attacks may negatively affect our operations.
We depend on third-party service providers, including mortgage servicers, for a variety of services related to our Non-Agency RMBS and whole mortgage loans we may acquire. We are, therefore, subject to the risks associated with third-party service providers.
We depend on a variety of services provided by third-party service providers related to our Non-Agency RMBS and whole mortgage loans we may acquire. We rely on the mortgage servicers who service the mortgage loans backing our Non-Agency RMBS to, among other things, collect principal and interest payments on the underlying mortgages and perform loss mitigation services. Our mortgage servicers and other service providers to our Non-Agency RMBS, such as trustees, bond insurance providers and custodians, may not perform in a manner that promotes our interests. In addition, recent legislation intended to reduce or prevent foreclosures through, among other things, loan modifications may reduce the value of mortgage loans backing our Non-Agency RMBS or whole mortgage loans that we acquire. Mortgage servicers may be incentivized by the Federal government to pursue such loan modifications, as well as forbearance plans and other actions intended to prevent foreclosure, even if such loan modifications and other actions are not in the best interests of the beneficial owners of the mortgage loans. In addition to the recent legislation that creates financial incentives for mortgage loan servicers to modify loans and take other actions that are intended to prevent foreclosures, legislation has recently been adopted that creates a safe harbor from liability to creditors for servicers that undertake loan modifications and other actions that are intended to prevent foreclosures. Finally, any regulatory effort to delay the initiation or completion of foreclosure proceedings on specified types of residential mortgage loans (some for a limited period of time), may limit the ability of mortgage servicers to take actions that may be essential to preserve the value of the mortgage loans underlying the mortgage servicing rights. Any such limitations are likely to cause delayed or reduced collections from mortgagors and generally increase servicing costs. As a result, the mortgage loan servicers on which we rely may not perform in our best interests or up to our expectations. If our third-party service providers do not perform as expected, our business, financial condition and results of operations and ability to make distributions to our shareholders may be materially adversely affected.
The Dodd-Frank Act contains many regulatory changes and calls for future rulemaking that may affect
our business.
The Dodd-Frank Wall Street Reform and Consumer Protection Act, or the Dodd-Frank Act, contains many regulatory changes and calls for future rulemaking that may affect our business, including, but not limited to resolutions involving derivatives, risk-retention in securitizations, the origination of residential mortgage loans and short-term financings. The Dodd-Frank Act’s requirements may impact the housing and mortgage markets, which could have an adverse effect on our business. We are evaluating the potential impact of regulatory change under the Dodd-Frank Act.
The increasing number of proposed federal, state and local laws may increase our risk of liability with respect to certain mortgage loans, may include judicial modification provisions and could increase our cost of doing business.
The United States Congress and various state and local legislatures are considering legislation, which, among other provisions, would permit limited assignee liability for certain violations in the mortgage loan and servicing origination process, and would allow judicial modification of loan principal in the event of personal bankruptcy. We cannot predict whether or in what form Congress or the various state and local legislatures may enact legislation affecting our business. For example, the California Homeowner Bill of Rights, which became effective on January 1, 2013, imposes new obligations and potential liabilities on investors, master servicers, servicers and subservicers, including anti-blight and tenant protection provisions. We are evaluating the potential impact of these initiatives, if enacted, on our practices and results of operations. As a result of these and other initiatives, we are unable to predict whether federal, state or local authorities will require changes in our practices in the future or in our portfolio. These changes, if required, could adversely affect our profitability, particularly if we make such changes in response to new or amended laws, regulations or ordinances in any state where we acquire a significant portion of our mortgage loans, or if such changes result in us being held responsible for any violations in the mortgage loan origination process, or if the principal amount of loans we own or are in RMBS pools we own are modified in the personal bankruptcy process.
28
Risks Related to Our Investments
We might not be able to purchase residential mortgage loans, mortgage-backed securities and other investments that meet our investment criteria or at favorable spreads over our borrowing costs.
To the extent we purchase assets using leverage, our net income depends on our ability to acquire residential mortgage loans, mortgage-backed securities and other investments at favorable spreads over our borrowing costs. Our investments are selected by our Manager, and our stockholders will not have input into such investment decisions. Our Manager has conducted due diligence with respect to each investment purchased. However, there can be no assurance that our Manager's due diligence processes will uncover all relevant facts or that any investment will be successful.
We may not realize income or gains from our investments.
We invest to generate both current income and capital appreciation. The investments we invest in may, however, not appreciate in value and, in fact, may decline in value, and the debt securities we invest in may default on interest or principal payments. Accordingly, we may not be able to realize income or gains from our investments. Any gains that we do realize may not be sufficient to offset any other losses we experience. Any income that we realize may not be sufficient to offset our expenses.
Our investments may be concentrated and will be subject to risk of default.
We are not required to observe specific diversification criteria. To the extent that our portfolio is concentrated in any one region or type of security, downturns relating generally to such region or type of security may result in defaults on a number of our investments within a short time period, which may reduce our net income and the value of our shares and accordingly may reduce our ability to pay dividends to our stockholders.
Our investments in subordinated RMBS are generally in the “first loss” position and our investments in the mezzanine RMBS are generally in the “second loss” position and therefore subject to losses.
In general, losses on a mortgage loan included in a securitization will be borne first by the equity holder of the issuing trust, and then by the “first loss” subordinated security holder and then by the “second loss” mezzanine holder. In the event of default and the exhaustion of any classes of securities junior to those in which we invest and there is any further loss, we will not be able to recover all of our investment in the securities we purchase. In addition, if the underlying mortgage portfolio has been overvalued by the originator, or if the values subsequently decline and, as a result, less collateral is available to satisfy interest and principal payments due on the related RMBS, the securities in which we invest may effectively become the “first loss” position behind the more senior securities, which may result in significant losses to us. The prices of lower credit quality securities are generally less sensitive to interest rate changes than more highly rated investments, but more sensitive to adverse economic downturns or individual issuer developments. A projection of an economic downturn, for example, could cause a decline in the price of lower credit quality securities because the ability of obligors of mortgages underlying RMBS to make principal and interest payments may be impaired. In such event, existing credit support in the securitization structure may be insufficient to protect us against loss of our principal on these securities.
29
Increases in interest rates could negatively affect the value of our investments, which could result in reduced earnings or losses and negatively affect the cash available for distribution to our stockholders.
We have invested in and will continue to invest in real estate-related assets by acquiring RMBS, residential mortgage loans, CMBS and CDOs backed by real estate-related assets. Under a normal yield curve, an investment in these assets will decline in value if long-term interest rates increase. Declines in market value may ultimately reduce earnings or result in losses to us, which may negatively affect cash available for distribution to our stockholders. A significant risk associated with these investments is the risk that both long-term and short-term interest rates will increase significantly. If long-term rates were to increase significantly, the market value of these investments would decline, and the duration and weighted average life of the investments would increase. We could realize a loss if these assets were sold. At the same time, an increase in short-term interest rates would increase the amount of interest owed on the repurchase agreements or other adjustable rate financings we may enter into to finance the purchase of these assets. Market values of our investments may decline without any general increase in interest rates for a number of reasons, such as increases in defaults, increases in voluntary prepayments for those investments that are subject to prepayment risk and widening of credit spreads.
In a period of rising interest rates, our interest expense could increase while the interest we earn on our fixed-rate assets would not change, which would adversely affect our profitability.
Our operating results will depend in large part on the differences between the income from our assets, net of credit losses and financing costs. We anticipate that, in most cases, the income from such assets will respond more slowly to interest rate fluctuations than the cost of our borrowings. Consequently, changes in interest rates, particularly short-term interest rates, may significantly influence our net income. Increases in these rates will tend to decrease our net income and market value of our assets. Interest rate fluctuations resulting in our interest expense exceeding our interest income would result in operating losses for us and may limit or eliminate our ability to make distributions to our stockholders. Although we use hedging strategies to protect against increases in interest expense, there is no guarantee the hedge strategy will be effective or will prevent decreases in net income in a period of rising interest rates.
Interest rate mismatches between our investments and any borrowings used to fund purchases of these assets may reduce our income during periods of changing interest rates.
We intend to fund some of our acquisitions of residential mortgage loans, real estate-related securities and real estate loans with borrowings that have interest rates based on indices and repricing terms with shorter maturities than the interest rate indices and repricing terms of our adjustable-rate assets. Accordingly, if short-term interest rates increase, this may have a negative impact on our profitability.
Some of the residential mortgage loans, real estate-related securities and real estate loans we acquire are and will be fixed-rate securities. This means that their interest rates will not vary over time based upon changes in a short-term interest rate index. Therefore, the interest rate indices and repricing terms of the assets that we acquire and their funding sources will create an interest rate mismatch between our assets and liabilities. During periods of changing interest rates, these mismatches could reduce our net income, dividend yield and the market price of our stock.
Accordingly, in a period of rising interest rates, we could experience a decrease in net income or a net loss because the interest rates on our borrowings adjust whereas the interest rates on our fixed-rate assets remain unchanged.
Interest rate caps on our adjustable-rate RMBS may adversely affect our profitability.
Adjustable-rate RMBS are typically subject to periodic and lifetime interest rate caps. Periodic interest rate caps limit the amount an interest rate can increase during any given period. Lifetime interest rate caps limit the amount an interest rate can increase over the life of the security. Our borrowings typically will not be subject to similar restrictions. Accordingly, in a period of rapidly increasing interest rates, the interest rates paid on our borrowings could increase without limitation while caps could limit the interest rates on our adjustable-rate RMBS. This problem is magnified for hybrid adjustable-rate and adjustable-rate RMBS that are not fully indexed. Further, some hybrid adjustable-rate and adjustable-rate RMBS may be subject to periodic payment caps that result in a portion of the interest being deferred and added to the principal outstanding. As a result, we may receive less cash income on hybrid adjustable-rate and adjustable-rate RMBS than we need to pay interest on our related borrowings. These factors could reduce our net interest income or cause us to suffer a loss.
30
A flat or inverted yield curve may adversely affect adjustable-rate RMBS prepayment rates and supply.
Our net interest income varies primarily as a result of changes in interest rates as well as changes in interest rates across the yield curve. When the differential between short-term and long-term benchmark interest rates narrows, the yield curve is said to be “flattening.” We believe that when the yield curve is relatively flat, borrowers have an incentive to refinance into hybrids with longer initial fixed-rate periods and fixed rate mortgages, causing our RMBS to experience faster prepayments. In addition, a flatter yield curve generally leads to fixed-rate mortgage rates that are closer to the interest rates available on ARMs, potentially decreasing the supply of adjustable-rate RMBS. At times, short-term interest rates may increase and exceed long-term interest rates, causing an inverted yield curve. When the yield curve is inverted, fixed-rate mortgage rates may approach or be lower than mortgage rates on ARMs, further increasing adjustable-rate RMBS prepayments and further negatively impacting adjustable-rate RMBS supply. Increases in prepayments on our MBS portfolio cause our premium amortization to accelerate, lowering the yield on such assets. If this happens, we could experience a decrease in net income or incur a net loss during these periods, which may negatively impact our distributions to stockholders.
A significant portion of our portfolio investments will be recorded at fair value as determined in accordance with our pricing policy and, as a result, there will be uncertainty as to the value of these investments.
A significant portion of our portfolio of investments is in the form of securities that are not publicly traded. The fair value of securities and other investments that are not publicly traded may not be readily determinable. It may be difficult or impossible to obtain third party pricing on the investments we purchase. We value these investments quarterly at fair value, as determined in accordance with our valuation policy as approved by our board of directors. Because such valuations are inherently uncertain, may fluctuate over short periods of time and may be based on estimates, our determinations of fair value may differ materially from the values that would have been used if a ready market for these securities existed. The value of our common stock could be adversely affected if our determinations regarding the fair value of these investments were materially higher than the values that we ultimately realize upon their disposal.
A prolonged economic slowdown, a recession or declining real estate values could impair our investments and negatively affect our operating results.
Many of our investments are susceptible to economic slowdowns or recessions, which could lead to financial losses in our investments and a decrease in revenues, net income and assets. Unfavorable economic conditions also could increase our funding costs, limit our access to the capital markets or result in a decision by lenders not to extend credit to us. These events could prevent us from increasing investments and have an adverse effect on our operating results.
Changes in prepayment rates could negatively affect the value of our investment portfolio, which could result in reduced earnings or losses and negatively affect the cash available for distribution to our stockholders.
There are seldom any restrictions on borrowers’ abilities to prepay their residential mortgage loans. Homeowners tend to prepay mortgage loans faster when interest rates decline. Consequently, owners of the loans have to reinvest the money received from the prepayments at the lower prevailing interest rates. Conversely, homeowners tend not to prepay mortgage loans when interest rates increase. Consequently, owners of the loans are unable to reinvest money that would have otherwise been received from prepayments at the higher prevailing interest rates. This volatility in prepayment rates may affect our ability to maintain targeted amounts of leverage on our portfolio of residential mortgage loans, RMBS, and CDOs backed by real estate-related assets and may result in reduced earnings or losses for us and negatively affect the cash available for distribution to our stockholders.
To the extent our investments are purchased at a premium, faster than expected prepayments result in a faster than expected amortization of the premium paid, which would adversely affect our earnings. Conversely, if these investments were purchased at a discount, faster than expected prepayments accelerate our recognition of income.
31
The mortgage loans we invest in and the mortgage loans underlying the mortgage-backed and asset-backed securities we invest in are subject to delinquency, foreclosure and loss, which could result in losses to us.
Residential mortgage loans are typically secured by single-family residential property and are subject to risks of delinquency and foreclosure and risks of loss. The ability of a borrower to repay a loan secured by a residential property is dependent upon the income or assets of the borrower. A number of factors, including a general economic downturn, acts of God, terrorism, social unrest and civil disturbances, may impair borrowers’ abilities to repay their loans. In addition, we invest in Non-Agency RMBS, which are backed by residential real property but, in contrast to Agency RMBS, their principal and interest is not guaranteed by federally chartered entities such as Fannie Mae and Freddie Mac and, in the case of Ginnie Mae, the U.S. government. The U.S. Department of Treasury and FHFA have also entered into preferred stock purchase agreements between the U.S. Department of Treasury and Fannie Mae and Freddie Mac pursuant to which the U.S. Department of Treasury will ensure that each of Fannie Mae and Freddie Mac maintains a positive net worth. Asset-backed securities are bonds or notes backed by loans or other financial assets. The ability of a borrower to repay these loans or other financial assets is dependent upon the income or assets of these borrowers. Commercial mortgage loans are secured by multifamily or commercial property and are subject to risks of delinquency and foreclosure, and risks of loss that are greater than similar risks associated with loans made on the security of single-family residential property. The ability of a borrower to repay a loan secured by an income-producing property typically is dependent primarily upon the successful operation of such property rather than upon the existence of independent income or assets of the borrower. If the net operating income of the property is reduced, the borrower’s ability to repay the loan may be impaired. Net operating income of an income producing property can be affected by, among other things, tenant mix, success of tenant businesses, property management decisions, property location and condition, competition from comparable types of properties, changes in laws that increase operating expense or limit rents that may be charged, any need to address environmental contamination at the property, the occurrence of any uninsured casualty at the property, changes in national, regional or local economic conditions or specific industry segments, declines in regional or local real estate values, declines in regional or local rental or occupancy rates, increases in interest rates, real estate tax rates and other operating expenses, changes in governmental rules, regulations and fiscal policies, including environmental legislation, acts of God, terrorism, social unrest and civil disturbances. In the event of any default under a mortgage loan held directly by us, we will bear a risk of loss of principal to the extent of any deficiency between the value of the collateral and the principal and accrued interest of the mortgage loan, which could have a material adverse effect on our cash flow from operations. In the event of the bankruptcy of a mortgage loan borrower, the mortgage loan to such borrower will be deemed to be secured only to the extent of the value of the underlying collateral at the time of bankruptcy (as determined by the bankruptcy court), and the lien securing the mortgage loan will be subject to the avoidance powers of the bankruptcy trustee or debtor-in-possession to the extent the lien is unenforceable under state law. Foreclosure of a mortgage loan can be an expensive and lengthy process which could have a substantial negative effect on our anticipated return on the foreclosed mortgage loan. RMBS evidence interests in or are secured by pools of residential mortgage loans and CMBS evidence interests in or are secured by a single commercial mortgage loan or a pool of commercial mortgage loans. Accordingly, the RMBS and CMBS we invest in are subject to all of the risks of the respective underlying mortgage loans.
We may be required to repurchase mortgage loans or indemnify investors if we breach representations and warranties, which could negatively affect our earnings.
If we sell loans, we would be required to make customary representations and warranties about such loans to the loan purchaser. Our residential mortgage loan sale agreements will require us to repurchase or substitute loans in the event we breach a representation or warranty given to the loan purchaser. In addition, we may be required to repurchase loans as a result of borrower fraud or in the event of early payment default on a mortgage loan. Likewise, we are required to repurchase or substitute loans if we breach a representation or warranty in connection with our securitizations. The remedies available to a purchaser of mortgage loans are generally broader than those available to us against the originating broker or correspondent. Further, if a purchaser enforces its remedies against us, we may not be able to enforce the remedies we have against the sellers. The repurchased loans typically can only be financed at a steep discount to their repurchase price, if at all. They are also typically sold at a significant discount to the unpaid principal balance. Significant repurchase activity could negatively affect our cash flow, results of operations, financial condition and business prospects.
We may enter into derivative contracts that could expose us to contingent liabilities in the future.
Subject to maintaining our qualification as a REIT, part of our investment strategy involves entering into derivative contracts that could require us to fund cash payments in certain circumstances. These potential payments will be contingent liabilities, the value of which are unknown, and therefore may not appear on our Consolidated Statements of Financial Condition. Our ability to fund these contingent liabilities will depend on the liquidity of our assets and access to capital at the time, and the need to fund these contingent liabilities could adversely impact our financial condition.
32
Our Manager’s due diligence of potential investments may not reveal all of the liabilities associated with such investments and may not reveal other weaknesses in such investments, which could lead to investment losses.
Before making an investment, our Manager assesses the strengths and weaknesses of the originator or issuer of the asset as well as other factors and characteristics that are material to the performance of the investment. In making the assessment and otherwise conducting customary due diligence, our Manager relies on resources available to it and, in some cases, an investigation by third parties. This process is particularly important with respect to newly formed originators or issuers with unrated and other subordinated tranches of RMBS and ABS because there may be little or no information publicly available about these entities and investments. There can be no assurance that our Manager’s due diligence process will uncover all relevant facts or that any investment will be successful.
Our real estate investments are subject to risks particular to real property.
We own assets secured by real estate and may own real estate directly in the future, either through direct investments or upon a default of mortgage loans. Real estate investments are subject to various risks, including:
|
●
|
acts of God, including earthquakes, hurricanes, floods and other natural disasters, that may result in uninsured losses;
|
|
●
|
acts of war or terrorism, including the consequences of terrorist attacks, such as those that occurred on September 11, 2001;
|
|
●
|
adverse changes in national and local economic and market conditions;
|
|
●
|
changes in governmental laws and regulations, fiscal policies and zoning ordinances and the related costs of compliance with laws and regulations, fiscal policies and ordinances;
|
|
●
|
costs of remediation and liabilities associated with environmental conditions such as indoor mold; and
|
|
●
|
the potential for uninsured or under-insured property losses.
|
If any of these or similar events occurs, it may reduce our return from an affected property or investment and reduce or eliminate our ability to make distributions to stockholders.
We may be exposed to environmental liabilities with respect to properties to which we take title.
In the course of our business, we may take title to real estate, and, if we do take title, we could be subject to environmental liabilities with respect to these properties. In such a circumstance, we may be held liable to a governmental entity or to third parties for property damage, personal injury, investigation, and clean-up costs incurred by these parties in connection with environmental contamination, or may be required to investigate or clean up hazardous or toxic substances, or chemical releases at a property. The costs associated with investigation or remediation activities could be substantial. If we ever become subject to significant environmental liabilities, our business, financial condition, liquidity, and results of operations could be materially and adversely affected.
We may in the future invest in RMBS collateralized by subprime mortgage loans, which are subject to increased risks.
We may in the future invest in RMBS backed by collateral pools of subprime residential mortgage loans. ‘‘Subprime’’ mortgage loans refer to mortgage loans that have been originated using underwriting standards that are less restrictive than the underwriting requirements used as standards for other first and junior lien mortgage loan purchase programs, such as the programs of Fannie Mae and Freddie Mac. These lower standards include mortgage loans made to borrowers having imperfect or impaired credit histories (including outstanding judgments or prior bankruptcies), mortgage loans where the amount of the loan at origination is 80% or more of the value of the mortgage property, mortgage loans made to borrowers with low credit scores, mortgage loans made to borrowers who have other debt that represents a large portion of their income and mortgage loans made to borrowers whose income is not required to be disclosed or verified. Due to economic conditions, including increased interest rates and lower home prices, as well as aggressive lending practices, subprime mortgage loans have in recent periods experienced increased rates of delinquency, foreclosure, bankruptcy and loss, and they are likely to continue to experience delinquency, foreclosure, bankruptcy and loss rates that are higher, and that may be substantially higher, than those experienced by mortgage loans underwritten in a more traditional manner. Thus, because of the higher delinquency rates and losses associated with subprime mortgage loans, the performance of RMBS collateralized by subprime mortgage loans in which we may invest could be correspondingly adversely affected, which could adversely impact our results of operations, financial condition and business.
33
Our Manager utilizes analytical models and data in connection with the valuation of our investments, and any incorrect, misleading or incomplete information used in connection therewith would subject us to potential risks.
Given the complexity of our investments and strategies, our Manager must rely heavily on analytical models and information and data supplied by third-parties (“Models and Data”). Models and Data will be used to value investments or potential investments and also in connection with hedging our investments. When Models and Data prove to be incorrect, misleading or incomplete, any decisions made in reliance thereon expose us to potential risks. For example, by relying on Models and Data, especially valuation models, our Manager may be induced to buy certain investments at prices that are too high, to sell certain other investments at prices that are too low or to miss favorable opportunities altogether. Similarly, any hedging based on faulty Models and Data may prove to be unsuccessful. Furthermore, any valuations of our investments that are based on valuation models may prove to be incorrect.
Some of the risks of relying on analytical models and third-party data are particular to analyzing tranches from securitizations, such as RMBS. These risks include, but are not limited to, the following: (i) collateral cash flows and/or liability structures may be incorrectly modeled in all or only certain scenarios, or may be modeled based on simplifying assumptions that lead to errors; (ii) information about collateral may be incorrect, incomplete, or misleading; (iii) collateral or bond historical performance (such as historical prepayments, defaults, cash flows, etc.) may be incorrectly reported, or subject to interpretation (e.g., different issuers may report delinquency statistics based on different definitions of what constitutes a delinquent loan); or (iv) collateral or bond information may be outdated, in which case the models may contain incorrect assumptions as to what has occurred since the date information was last updated.
Some of the analytical models used by our Manager, such as mortgage prepayment models or mortgage default models, are predictive in nature. The use of predictive models has inherent risks. For example, such models may incorrectly forecast future behavior, leading to potential losses on a cash flow and/or a mark-to-market basis. In addition, the predictive models used by our Manager may differ substantially from those models used by other market participants, with the result that valuations based on these predictive models may be substantially higher or lower for certain investments than actual market prices. Furthermore, since predictive models are usually constructed based on historical data supplied by third-parties, the success of relying on such models may depend heavily on the accuracy and reliability of the supplied historical data and the ability of these historical models to accurately reflect future periods.
All valuation models rely on correct market data inputs. If incorrect market data is entered into even a well-founded valuation model, the resulting valuations will be incorrect. However, even if market data is appropriately captured in the model, the resulting “model prices” will often differ substantially from market prices, especially for securities with complex characteristics, such as derivative securities.
Regulatory and Legal Risks
Violations of federal, state and local laws by the originator, the servicer, or us may result in rescission of the loans or penalties that may adversely impact our income.
Violations of certain provisions of federal, state and local laws by the originator, the servicer or us, as well as actions by governmental agencies, authorities and attorneys general, may limit our or the servicer’s ability to collect all or part of the principal of, or interest on, the residential mortgage loans we purchase and hold, and loans that serve as security for the RMBS we purchase and hold. Violations could also subject the entity that made or modified the loans to damages and administrative enforcement (including disgorgement of prior interest and fees paid). In particular, a loan seller’s failure to comply with certain requirements of federal and state laws could subject the seller (and other assignees of the mortgage loans) to monetary penalties and result in the obligors’ rescinding the mortgage loans against the seller and any subsequent holders of the mortgage loans, even if the assignee was not responsible for and was unaware of those violations. These adverse consequences vary depending on the applicable law and may vary depending on the type or severity of the violation, but they typically include:
34
|
●
|
the ability of the homeowner to rescind, or cancel, the loan;
|
|
●
|
the inability of the holder of the loan to collect all of the principal and interest otherwise due on the loan;
|
|
●
|
the right of the homeowner to collect a refund of amounts previously paid (which may include amounts financed by the loan), or to set off those amounts against his or her future loan obligations; and
|
|
●
|
the liability of the servicer and the owner of the loan for actual damages, statutory damages and punitive damages, civil or criminal penalties, costs and attorneys’ fees.
|
The terms of the documents under which we intend to purchase loans, and the terms of the documents used to create the RMBS we intend to purchase, may entitle the holders of the loans and the special purpose vehicles that hold loans in RMBS to contractual indemnification against these liabilities. For example, the sellers of loans placed in a securitization typically represent that each mortgage loan was made in compliance with applicable federal and state laws and regulations at the time it was made. If there is a material breach of that representation, the seller may be contractually obligated to cure the breach or repurchase or replace the affected mortgage loan. If the seller is unable or otherwise fails to satisfy these obligations, the yield on the loans and RMBS might be materially and adversely affected. Due to the deterioration in the housing and commercial property markets, many of the sellers that issued these indemnifications are no longer in business or are unable to financially respond to their indemnification obligations. Consequently, holders of interests in the loans and RMBS may ultimately have to absorb the losses arising from the sellers’ violations. While we attempt to take these factors into account in the prices we pay for loans and RMBS, we can offer no assurances concerning the validity of the assumptions we use in our pricing decisions.
Furthermore, the volume of new and modified laws and regulations at both the federal and state levels has increased in recent years. For example, the Dodd-Frank Act established the Consumer Financial Protection Bureau which, among other things, restricts and supervises unfair, deceptive or abusive acts or practices in mortgage lending. There is also an increased risk that the both we and the servicer of loans we purchase or that are held in RMBS we purchase may be involved in litigation over violations or alleged violations of recently enacted and proposed laws. It is possible that these laws might result in additional significant costs and liabilities, which could further adversely affect the results of our operations. Any litigation would increase our expenses and reduce funds available for distribution to our stockholders.
Some local municipalities also have enacted laws that impose potentially significant penalties on loan servicing activities related to abandoned properties or real estate owned properties.
Any of these preceding examples could result in delays and/or reductions in receipts of amounts due on the loans we intend to purchase or on the loans held in RMBS we intend to purchase, negatively affecting our income and operating results.
We may be subject to liability for potential violations of predatory lending and other laws, which could adversely impact our results of operations, financial condition and business.
Various federal, state and local laws have been enacted that are designed to discourage predatory lending practices and more are currently proposed. The federal Home Ownership and Equity Protection Act of 1994, commonly known as HOEPA, prohibits inclusion of certain provisions in residential mortgage loans that have mortgage rates or origination costs in excess of prescribed levels and requires that borrowers be given certain disclosures before origination. Some states have enacted, or may enact, similar laws or regulations, which in some cases impose restrictions and requirements greater than those in HOEPA. In addition, under the anti-predatory lending laws of some states, the origination of certain residential mortgage loans, including loans that are not classified as “high cost” loans under applicable law, must satisfy a net tangible benefits test with respect to the related borrower. This test may be highly subjective and open to interpretation. As a result, a court may determine that a residential mortgage loan we hold, for example, does not meet the test even if the related originator reasonably believed that the test was satisfied.
35
Failure of residential mortgage loan originators or servicers to comply with these laws, to the extent any of their residential mortgage loans become part of our mortgage-related assets, could subject us, as an assignee or purchaser of the related residential mortgage loans or RMBS, to monetary penalties and could result in the borrowers rescinding the affected residential mortgage loans. Lawsuits have been brought in various states making claims against assignees or purchasers of high cost loans for violations of state law. Named defendants in these cases have included numerous participants in the secondary mortgage market. If the loans are found to have been originated in violation of predatory or abusive lending laws, we could incur losses, which could adversely impact our results of operations, financial condition and business.
There is the potential for limitations on our ability to finance purchases of loans and RMBS, and for losses on the loans and RMBS we purchase, as a result of violations of law by the originating lenders.
In June 2003, a California jury found a warehouse lender and securitization underwriter liable in part for fraud on consumers committed by a lender to whom it provided financing and underwriting services. The jury found that the investment bank was aware of the fraud and substantially assisted the lender in perpetrating the fraud by providing financing and underwriting services that allowed the lender to continue to operate, and held it liable for 10% of the plaintiff’s damages. This instance of liability is the first case we know of in which an investment bank was held partly responsible for violations committed by a mortgage lender customer. Shortly after the announcement of the jury verdict in the California case, the Florida Attorney General filed suit against the same financial institution, seeking an injunction to prevent it from financing mortgage loans within Florida, as well as damages and civil penalties, based on theories of unfair and deceptive trade practices and fraud. The suit claimed that this financial institution aided and abetted the same lender involved in the California case in its commission of fraudulent representations in Florida.
In December of 2008, the Massachusetts Supreme Judicial Court upheld a lower court’s order entered against a lender that enjoined the lender from foreclosing, without court approval, on certain mortgage loans secured by the borrower’s principal dwelling that the court considered “presumptively unfair.”
In May of 2009, another securitizer of residential mortgage loans entered into a settlement agreement with the Commonwealth of Massachusetts stemming from its investigation of subprime lending and securitization markets. The securitizer agreed to provide loan restructuring (including significant principal write-downs) valued at approximately $50 million to Massachusetts subprime borrowers and to make a $10 million payment to the Commonwealth.
If other courts or regulators take similar actions, investment banks and investors in residential and commercial mortgage loans and RMBS like us might face increased litigation as they are named as defendants in lawsuits and regulatory actions against the mortgage companies or securitizers with which they do business or they might be prohibited from foreclosing on loans they purchased. Some investment banks may charge more for warehouse lending and reduce the prices they pay for loans to build in the costs of this potential litigation or exit the business entirely, thereby increasing our cost of borrowing. Any such actions by courts and regulators, and any such increases in our costs of borrowing, could, in turn, have a material adverse effect on our results of operations, financial condition, and business prospects.
We are required to obtain various state licenses in order to purchase mortgage loans in the secondary market and there is no assurance we will be able to obtain or maintain those licenses.
While we are not required to obtain licenses to purchase mortgage-backed securities, we are required to obtain various state licenses to purchase mortgage loans in the secondary market. There is no assurance that we will obtain all of the licenses that we desire or that we will not experience significant delays in seeking these licenses. Furthermore, we will be subject to various information reporting requirements to maintain these licenses, and there is no assurance that we will satisfy those requirements. Our failure to obtain or maintain licenses will restrict our investment options and could harm our business.
36
The federal government’s efforts to encourage refinancing of certain loans may affect prepayment rates for mortgage loans in RMBS.
In addition to the increased pressure upon residential mortgage loan investors and servicers to engage in loss mitigation activities, the federal government is pressing for refinancing of certain loans, and this encouragement may affect prepayment rates for mortgage loans in RMBS. To the extent these and other economic stabilization or stimulus efforts are successful in increasing prepayment speeds for residential mortgage loans, such as those in RMBS, that could potentially have a negative impact our income and operating results, particularly in connection with loans or RMBS purchased at a premium or our interest-only securities.
Federal and state agencies have taken enforcement actions and enacted regulations and government programs that require government sponsored enterprises (such as Fannie Mae and Freddie Mac), insured depository institutions, and state regulated loan servicers to engage in loss mitigation activities relating to residential mortgage loans.
Federal and state agencies have taken enforcement actions and enacted regulations that require GSEs (such as Fannie Mae and Freddie Mac), insured depository institutions, and state regulated loan servicers to engage in loss mitigation activities relating to residential mortgage loans. Other agencies have published policies that strongly recommend these entities to engage in loss mitigation activities. These loss mitigation activities may include, for example, loan modifications that significantly reduce interest and payments, deferrals of payments, and reductions of principal balances. Such modifications may adversely affect our business and financial condition.
We will likely be subject to civil liability if we fail to make required disclosures to consumers.
Purchasers of consumer purpose, residential mortgage loans have affirmative disclosure obligations to consumers under the Helping Families Save Their Homes in Bankruptcy Act of 2009, or the HFSTH Act, which Congress enacted in May 2009 with an immediate effective date. This new statutory obligation will subject purchasers of mortgage loans to civil liability if they fail to make the required disclosures. Specifically, section 404 of the HFSTH Act amends the Truth in Lending Act to provide that a creditor that purchases or is assigned a mortgage loan must notify the borrower in writing of a sale or transfer of his or her mortgage loan, not later than 30 days after the transaction’s completion. The notice must include how to reach an agent or party having authority to act on behalf of the new creditor, the location of the place where the transfer of ownership is recorded and any other relevant information about the new creditor. This disclosure would be in addition to any transfer of servicing notice required under the Real Estate Settlement Procedures Act, or RESPA. Federal consumer credit law does not typically impose responsibility on assignees to communicate directly with mortgagors, and the statutory language is ambiguous.
Litigation alleging inability to foreclose may limit our ability to recover on some of the loans we purchase or that are held in RMBS.
In October 2007, a judge in the U.S. District Court for the Northern District of Ohio dismissed 14 cases in which plaintiffs sought to foreclose mortgages held in securitization trusts by ruling that those plaintiffs lacked standing to sue. In each case, the judge found that the plaintiff was not the owner of the note and mortgage on the date the foreclosure complaint was filed in court. Similar actions have been initiated in other states. These actions arise as a result of the common practice in the mortgage industry of mortgage loan sellers providing the loan purchasers unrecorded assignments of the mortgage in blank (i.e., the assignments do not name the assignee). Some courts have held that before a note holder may initiate a foreclosure, the note holder must show proof to the court that the mortgage itself has been properly assigned to the purchaser each time the mortgage loan has been sold. It is sometimes difficult to obtain and then record originals of each successive assignment. It is still unclear whether higher courts will uphold the requirements imposed by these lower courts.
Until the issue is settled, investors in mortgage loans are at risk of being unable to foreclose on defaulted loans, or at a minimum will be subject to delays until all assignments in the chain of the loan’s title are properly recorded. Thus, we may not be able to recover on some of the loans we purchase or that are held in the RMBS we purchase, or we may suffer delays in foreclosure, all of which could result in a lower return on our loans and RMBS.
In addition, some legislatures are also instituting stringent proof of ownership requirements that a servicer must satisfy before commencing a foreclosure action. By way of example, in January 2011 the New York State Assembly amended state law to require that any foreclosure complaint contain an affirmative allegation that the plaintiff is the owner and holder of the note and mortgage at issue or has been delegated the authority to institute the foreclosure action by the owner and holder of the subject mortgage and note. Again, laws of this type may limit our ability to recover on some of the loans we purchase or that are held in the RMBS we purchase, and may result in delays in the foreclosure process, all of which could result in a lower return on our loans and RMBS.
37
Legislative action to provide mortgage relief and foreclosure moratoriums may negatively impact our business.
As delinquencies and defaults in residential mortgages have recently increased, there has been an increasing amount of legislative action that might restrict our ability to foreclose and resell the property of a customer in default. For example, some recently enacted state laws may require the lender to deliver a notice of intent to foreclose, provide borrowers additional time to cure or reinstate their loans, impose mandatory settlement conference and mediation requirements, require lenders to offer loan modifications, and prohibit initiation of foreclosure until the borrower has been provided time to consult with foreclosure counselors.
Alternatively, new federal legislation and some legislatures provide a subsidy to a customer to permit the customer to continue to make payments during a period of hardship. In the case of a subsidy, it is possible that we might be required to forego a portion of the amount otherwise due on the loan for a temporary period.
Finally, some state legislatures are requiring foreclosing lenders to give special notices to tenants in properties that the lenders are foreclosing on, or to permit the tenants to remain in the property for a period of time following the foreclosure.
These laws delay the initiation or completion of foreclosure proceedings on specified types of residential mortgage loans, or otherwise limit the ability of residential loan servicers to take actions that may be essential to preserve the value of the mortgage loans on behalf of the holders of RMBS. Any such limitations are likely to cause delayed or reduced collections from mortgagors and generally increased servicing costs. Any restriction on our ability to foreclose on a loan, any requirement that we forego a portion of the amount otherwise due on a loan or any requirement that we modify any original loan terms is likely to negatively impact our business, financial condition, liquidity and results of operations.
United States military operations may increase risk of Servicemembers Civil Relief Act shortfalls.
Under the federal Servicemembers Civil Relief Act, a borrower who enters active military service after the origination of his or her mortgage loan generally may not be required to pay interest above an annual rate of 6%, and the note holder is restricted from exercising certain enforcement remedies, during the period of the borrower’s active duty status. Several states also have enacted or are considering similar laws with varying applicability and effect. As a result of military operations in Afghanistan and Iraq, the United States has placed a substantial number of armed forces reservists and members of the National Guard on active duty status. It is possible that the number of reservists and members of the National Guard placed on active duty status may remain at high levels for an extended time. To the extent that a member of the military, or a member of the armed forces reserves or National Guard who is called to active duty, is a mortgagor on a loan we purchase or an underlying loan in a RMBS we may purchase, the interest rate limitation of the Servicemembers Civil Relief Act, and any comparable state law, will apply. An increase in the number of borrowers taking advantage of those laws may increase servicing expenses for a loan we purchase or an underlying loan in a RMBS we may purchase, and may also reduce cash flow and the interest payments collected from those borrowers. In the event of default, the laws may result in delaying or preventing the loan servicer from exercising otherwise available remedies for default. If these events occur, they may result in interest shortfalls on the loans we purchase or on the underlying loans in a RMBS we may purchase that could result in a lower return on our loans or additional losses.
Risks Related To Our Common Stock
The market price and trading volume of our shares of common stock may be volatile.
The market price of shares of our common stock may be highly volatile and could be subject to wide fluctuations. In addition, the trading volume in our shares of common stock may fluctuate and cause significant price variations to occur. We cannot assure you that the market price of our shares of common stock will not fluctuate or decline significantly in the future. Some of the factors that could negatively affect our share price or result in fluctuations in the price or trading volume of our shares of common stock include those set forth under “Risk Factors” and “Special Note Regarding Forward-Looking Statements” and in the information incorporated and deemed to be incorporated by reference herein, as well as:
38
|
●
|
actual or anticipated variations in our quarterly operating results or business prospects;
|
|
●
|
changes in our earnings estimates or publication of research reports about us or the real estate industry;
|
|
●
|
an inability to meet or exceed securities analysts' estimates or expectations;
|
|
●
|
increases in market interest rates;
|
|
●
|
hedging or arbitrage trading activity in our shares of common stock;
|
|
●
|
capital commitments;
|
|
●
|
changes in market valuations of similar companies;
|
|
●
|
changes in valuations of our assets;
|
|
●
|
adverse market reaction to any increased indebtedness we incur in the future;
|
|
●
|
additions or departures of management personnel;
|
|
●
|
actions by institutional shareholders;
|
|
●
|
speculation in the press or investment community;
|
|
●
|
changes in our distribution policy;
|
|
●
|
regulatory changes affecting our industry generally or our business;
|
|
●
|
general market and economic conditions; and
|
|
●
|
future sales of our shares of common stock or securities convertible into, or exchangeable or exercisable for, our shares of common stock.
|
Common stock eligible for future sale may have adverse effects on our share price.
We cannot predict the effect, if any, of future sales of common stock, or the availability of shares for future sales, on the market price of the common stock. Sales of substantial amounts of common stock, or the perception that such sales could occur, may adversely affect prevailing market prices for the common stock. Annaly owned approximately 4.38% of our outstanding shares of common stock as of December 31, 2013. Our equity incentive plan provides for grants of restricted common stock and other equity-based awards up to an aggregate of 8% of the issued and outstanding shares of our common stock (on a fully diluted basis) at the time of the award, subject to a ceiling of 40,000,000 shares available for issuance under the plan.
The lock-up period in connection with the shares purchased by Annaly has expired. The market price of our common stock may decline significantly if there are sales of substantial amounts of common stock or the perception that such sales could occur.
There is a risk that our stockholders may not receive distributions or that distributions may not grow over time.
We intend to make distributions on a quarterly basis out of assets legally available to our stockholders in amounts such that all or substantially all of our REIT taxable income in each year is distributed. Our ability to pay distributions may be adversely affected by a number of factors, including the risk factors described herein. All distributions will be made at the discretion of our board of directors and will depend on our earnings, our financial condition, maintenance of our REIT status and other factors as our board of directors may deem relevant from time to time.
The Board of Directors declared and paid common stock cash dividends of $0.09 per common share for each of the quarters of 2013. The Board of Directors also declared and paid a special dividend of $0.20 per share that was paid on January 31, 2014 to shareholders of record on January 8, 2014 and a regular quarterly dividend of $0.09 per common share for the first quarter of 2014. The Board of Directors has also determined that there will be a quarterly dividend of $0.09 per share for the second, third and fourth quarters of 2014.
39
Among the factors that could adversely affect our results of operations and impair our ability to pay distributions to our stockholders are:
|
●
|
the profitability of the investments of net proceeds from our equity raises;
|
|
●
|
our ability to make profitable investments;
|
|
●
|
margin calls or other expenses that reduce our cash flow;
|
|
●
|
defaults in our asset portfolio or decreases in the value of our portfolio; and
|
|
●
|
the fact that anticipated operating expense levels may not prove accurate, as actual results may vary from estimates.
|
A change in any one of these factors could affect our ability to make distributions. We cannot assure you that we will achieve investment results that will allow us to make a specified level of cash distributions or year-to-year increases in cash distributions.
Market interest rates may have an effect on the trading value of our shares.
One of the factors that investors may consider in deciding whether to buy or sell our shares is our distribution rate as a percentage of our share price relative to market interest rates. If market interest rates increase, prospective investors may demand a higher distribution rate or seek alternative investments paying higher dividends or interest. As a result, interest rate fluctuations and capital market conditions can affect the market value of our shares. For instance, if interest rates rise, it is likely that the market price of our shares will decrease as market rates on interest-bearing securities, such as bonds, increase.
Investing in our shares may involve a high degree of risk.
The investments we make in accordance with our investment objectives may result in a high amount of risk when compared to alternative investment options and volatility or loss of principal. Our investments may be highly speculative and aggressive, are subject to credit risk, interest rate, and market value risks, among others, and therefore an investment in our shares may not be suitable for someone with lower risk tolerance.
Broad market fluctuations could negatively impact the market price of our common stock.
The stock market has experienced extreme price and volume fluctuations that have affected the market price of many companies in industries similar or related to ours and that have been unrelated to these companies’ operating performances. These broad market fluctuations could reduce the market price of our common stock. Furthermore, our operating results and prospects may be below the expectations of public market analysts and investors or may be lower than those of companies with comparable market capitalizations, which could lead to a material decline in the market price of our common stock.
Future sales of shares may have adverse consequences for investors, or cause our share price to decline.
We may issue additional shares in subsequent public offerings or private placements to make new investments or for other purposes. We are not required to offer any such shares to existing shareholders on a pre-emptive basis. Therefore, it may not be possible for existing shareholders to participate in such future share issues, which may dilute the existing shareholders’ interests in us.
In addition, sales of substantial numbers of shares of our common stock in the public market, or the perception that such sales might occur, could adversely affect the market price of our common stock. The sale of these shares could also impair our ability to raise capital through a sale of additional equity securities.
Our charter and bylaws contain provisions that may inhibit potential acquisition bids that stockholders may consider favorable, and the market price of our common stock may be lower as a result.
Our charter and bylaws contain provisions that have an anti-takeover effect and inhibit a change in our board of directors. These provisions include the following:
40
|
●
|
There are ownership limits and restrictions on transferability and ownership in our charter. To qualify as a REIT for each taxable year after 2007, not more than 50% of the value of our outstanding stock may be owned, directly or constructively, by five or fewer individuals during the second half of any calendar year. In addition, our shares must be beneficially owned by 100 or more persons during at least 335 days of a taxable year of 12 months or during a proportionate part of a shorter taxable year for each taxable year after 2007. To assist us in satisfying these tests, our charter generally prohibits any person from beneficially or constructively owning more than 9.8% in value or number of shares, whichever is more restrictive, of any class or series of our outstanding capital stock. These restrictions may discourage a tender offer or other transactions or a change in the composition of our board of directors or control that might involve a premium price for our shares or otherwise be in the best interests of our stockholders and any shares issued or transferred in violation of such restrictions being automatically transferred to a trust for a charitable beneficiary, thereby resulting in a forfeiture of the additional shares.
|
|
●
|
Our charter permits our board of directors to issue stock with terms that may discourage a third party from acquiring us. Our charter permits our board of directors to amend the charter without stockholder approval to increase the total number of authorized shares of stock or the number of shares of any class or series and to issue common or preferred stock, having preferences, conversion or other rights, voting powers, restrictions, limitations as to dividends or other distributions, qualifications, or terms or conditions of redemption as determined by our board. Thus, our board could authorize the issuance of stock with terms and conditions that could have the effect of discouraging a takeover or other transaction in which holders of some or a majority of our shares might receive a premium for their shares over the then-prevailing market price of our shares.
|
|
●
|
Maryland Control Share Acquisition Act. Maryland law provides that ‘‘control shares’’ of a corporation acquired in a ‘‘control share acquisition’’ will have no voting rights except to the extent approved by a vote of two-thirds of the votes eligible to be cast on the matter under the Maryland Control Share Acquisition Act. ‘‘Control shares’’ means voting shares of stock that, if aggregated with all other shares of stock owned by the acquirer or in respect of which the acquirer is able to exercise or direct the exercise of voting power (except solely by a revocable proxy), would entitle the acquirer to exercise voting power in electing directors within one of the following ranges of voting power: one-tenth or more but less than one-third, one-third or more but less than a majority, or a majority or more of all voting power. A ‘‘control share acquisition’’ means the acquisition of control shares, subject to certain exceptions.
|
If voting rights or control shares acquired in a control share acquisition are not approved at a stockholders’ meeting, or if the acquiring person does not deliver an acquiring person statement as required by the Maryland Control Share Acquisition Act, then, subject to certain conditions and limitations, the issuer may redeem any or all of the control shares for fair value. If voting rights of such control shares are approved at a stockholders’ meeting and the acquirer becomes entitled to vote a majority of the shares of stock entitled to vote, all other stockholders may exercise appraisal rights. Our bylaws contain a provision exempting acquisitions of our shares from the Maryland Control Share Acquisition Act. However, our board of directors may amend our bylaws in the future to repeal or modify this exemption, in which case any control shares of our company acquired in a control share acquisition will be subject to the Maryland Control Share Acquisition Act.
|
●
|
Business Combinations. Under Maryland law, ‘‘business combinations’’ between a Maryland corporation and an interested stockholder or an affiliate of an interested stockholder are prohibited for five years after the most recent date on which the interested stockholder becomes an interested stockholder. These business combinations include a merger, consolidation, share exchange or, in circumstances specified in the statute, an asset transfer or issuance or reclassification of equity securities. An interested stockholder is defined as:
|
|
o
|
any person who beneficially owns 10% or more of the voting power of the corporation’s shares; or
|
|
o
|
an affiliate or associate of the corporation who, at any time within the two-year period before the date in question, was the beneficial owner of 10% or more of the voting power of the then outstanding voting stock of the corporation.
|
41
A person is not an interested stockholder under the statute if the board of directors approved in advance the transaction by which such person otherwise would have become an interested stockholder. However, in approving a transaction, the board of directors may provide that its approval is subject to compliance, at or after the time of approval, with any terms and conditions determined by the board. After the five-year prohibition, any business combination between the Maryland corporation and an interested stockholder generally must be recommended by the board of directors of the corporation and approved by the affirmative vote of at least:
|
o
|
80% of the votes entitled to be cast by holders of outstanding shares of voting stock of the corporation; and
|
|
o
|
two-thirds of the votes entitled to be cast by holders of voting stock of the corporation, other than shares held by the interested stockholder with whom or with whose affiliate the business combination is to be effected or held by an affiliate or associate of the interested stockholder.
|
These super-majority vote requirements do not apply if the corporation’s common stockholders receive a minimum price, as defined under Maryland law, for their shares in the form of cash or other consideration in the same form as previously paid by the interested stockholder for its shares. The statute permits various exemptions from its provisions, including business combinations that are exempted by the board of directors before the time that the interested stockholder becomes an interested stockholder. Our board of directors has adopted a resolution which provides that any business combination between us and any other person is exempted from the provisions of the Maryland Control Share Acquisition Act, provided that the business combination is first approved by the board of directors. This resolution, however, may be altered or repealed in whole or in part at any time. If this resolution is repealed, or the board of directors does not otherwise approve a business combination, this statute may discourage others from trying to acquire control of us and increase the difficulty of consummating any offer.
|
●
|
Staggered board. Our board of directors is divided into three classes of directors. Directors of each class are chosen for three-year terms upon the expiration of their current terms, and each year one class of directors is elected by the stockholders. The staggered terms of our directors may reduce the possibility of a tender offer or an attempt at a change in control, even though a tender offer or change in control might be in the best interests of our stockholders.
|
|
●
|
Our charter and bylaws contain other possible anti-takeover provisions. Our charter and bylaws contains other provisions that may have the effect of delaying, deferring or preventing a change in control of us or the removal of existing directors and, as a result, could prevent our stockholders from being paid a premium for their common stock over the then-prevailing market price.
|
Our rights and the rights of our stockholders to take action against our directors and officers are limited, which could limit stockholders’ recourse in the event of actions not in their best interests.
Our charter limits the liability of our directors and officers to us and our stockholders for money damages, except for liability resulting from:
|
●
|
actual receipt of an improper benefit or profit in money, property or services; or
|
|
●
|
a final judgment based upon a finding of active and deliberate dishonesty by the director or officer that was material to the cause of action adjudicated for which Maryland law prohibits such exemption from liability.
|
In addition, our charter authorizes us to obligate our company to indemnify our present and former directors and officers for actions taken by them in those capacities to the maximum extent permitted by Maryland law. Our bylaws require us to indemnify each present or former director or officer, to the maximum extent permitted by Maryland law, in the defense of any proceeding to which he or she is made, or threatened to be made, a party because of his or her service to us. In addition, we may be obligated to fund the defense costs incurred by our directors and officers.
42
The fair value of certain of the assets on our Consolidated Statements of Financial Condition as calculated according to GAAP may not reflect amounts we would receive if we disposed of those assets.
GAAP requires that we consolidate certain of our RMBS re-securitization transactions on our Consolidated Statements of Financial Condition and report these assets at fair value. Under GAAP, fair value for these assets is measured by determining the fair value of the underlying RMBS assets we contributed to the re-securitization trust as opposed to evaluating the fair value of the re-securitized securities we received as a result of the RMBS re-securitization transaction.
The fair value of the underlying RMBS assets subject to the RMBS re-securitization transactions may differ from the value of the re-securitized securities we received as a result of the RMBS re-securitization transaction. Discrepancies arise as a result of market dynamics, the limitations of the measurement techniques required by GAAP, the consolidation accounting principles under GAAP and the subordinate nature, complexity, illiquidity and restrictive features of the re-securitized securities we own. These differences between the fair values of the underlying RMBS consolidated on our Consolidated Statements of Financial Condition under GAAP presentation and the economic value of our investments in the re-securitized securities can be significant.
A discrepancy where the fair value of the underlying RMBS assets contained in a re-securitization trust is different from the amount we would receive if we sold the re-securitized securities we own may result in an overstatement or understatement of our book value due to the accounting standards we are required to apply. Reporting a higher book value than the value of our net investments in assets could have adverse effects on us. The adverse effects could include the inability to agree upon covenants with counterparties, the inability to satisfy collateral demands of counterparties based on their review of our financial statements, or an overestimation in the market price of our common stock.
Changes in the fair values of our assets, liabilities, and hedging instruments can have adverse effects on us, including earnings volatility, and volatility in our book value.
The fair values for our assets, liabilities, and hedging instruments can be volatile. The fair values can change rapidly and significantly from a variety of factors, including changes in interest rates, credit performance, perceived risk, supply, demand, and actual and projected cash flows and prepayments. Decreases in fair value may not necessarily be the result of deterioration in future cash flows. Moreover, fair values for illiquid assets can be difficult to estimate, which may lead to volatility and uncertainty of earnings as a result of OTTI, or book value as a result of increases in unrealized losses.
For GAAP purposes, we estimate the fair value of most, but not all, of the assets and liabilities on our Consolidated Statements of Financial Condition. In addition, valuation adjustments on certain consolidated assets and our hedging instruments are reflected in our Consolidated Statements of Operations and Comprehensive Income (Loss). If we sell an asset below its cost basis, our reported earnings will be reduced by realized losses.
A decrease in the fair value of the securities we own may result in a reduction in our book value due to the accounting standards we are required to apply. Reporting a low book value could have adverse effects even if that book value is not indicative of the actual value of our net investments in assets. The adverse effects could include the inability to meet or agree upon covenants with counterparties, to enter into hedge instruments, or a reduction in the market price of our common stock.
Tax Risks
Your investment has various federal income tax risks.
This summary of certain tax risks is limited to the federal tax risks addressed below. Additional risks or issues may exist that are not addressed in this Form 10-K and that could affect the federal tax treatment of us or our stockholders. This is not intended to be used and cannot be used by any stockholder to avoid penalties that may be imposed on stockholders under the Internal Revenue Code, or the Code. We strongly urge you to seek advice based on your particular circumstances from an independent tax advisor concerning the effects of federal, state and local income tax law on an investment in common stock and on your individual tax situation.
43
Complying with REIT requirements may cause us to forego otherwise attractive opportunities.
To qualify as a REIT for federal income tax purposes, we must continually satisfy various tests regarding the sources of our income, the nature and diversification of our assets, the amounts we distribute to our stockholders and the ownership of our stock. To meet these tests, we may be required to forego investments we might otherwise make. We may be required to make distributions to stockholders at disadvantageous times or when we do not have funds readily available for distribution. Thus, compliance with the REIT requirements may hinder our investment performance.
We may enter into re-securitization transactions, the tax treatment of which could have a material adverse
effect on our results of operations.
We have engaged in and intend to engage in future re-securitization transactions in which we transfer Non-Agency RMBS to a special purpose entity that has formed or will form a securitization vehicle that will issue multiple classes of securities secured by and payable from cash flows on the underlying Non-Agency RMBS. In the past, we have structured one such transaction as a real estate mortgage investment conduit, or REMIC, securitization, which, to the extent we have transferred securities in a re-securitization, is viewed as the sale of securities for tax purposes. Although such transactions are treated as sales for tax purposes, they have historically not given rise to any taxable gain so that the prohibited transactions tax rules have not been implicated (i.e., the tax only applies to net taxable gain from sales that are prohibited transactions). If a re-securitization transaction were to be considered to be a sale of property to customers in the ordinary course of a trade or business, and we recognized a gain on such transaction for tax purposes, then we could risk exposure to the 100% tax on net taxable income from prohibited transactions. Moreover, even if we retained RMBS resulting from a re-securitization transaction and then subsequently sold such securities at a tax gain, the gain could, absent an available safe-harbor provision, be characterized as net income from a prohibited transaction. Under these circumstances, our results of operations could be materially adversely affected.
Complying with REIT requirements may force us to liquidate otherwise attractive investments.
To qualify as a REIT, we generally must ensure that at the end of each calendar quarter at least 75% of the value of our total assets consists of cash, cash items, government securities and qualified REIT real estate assets, including certain mortgage loans and mortgage-backed securities. The remainder of our investment in securities (other than government securities and qualifying real estate assets) generally cannot include more than 10% of the outstanding voting securities of any one issuer or more than 10% of the total value of the outstanding securities of any one issuer. In addition, in general, no more than 5% of the value of our assets (other than government securities, qualifying real estate assets, and stock in one or more TRSs) can consist of the securities of any one issuer, and no more than 25% of the value of our total securities can be represented by securities of one or more TRSs. If we fail to comply with these requirements at the end of any quarter, we must correct the failure within 30 days after the end of such calendar quarter or qualify for certain statutory relief provisions to avoid losing our REIT status and suffering adverse tax consequences. As a result, we may be required to liquidate from our portfolio otherwise attractive investments. These actions could have the effect of reducing our income and amounts available for distribution to our stockholders.
Potential characterization of distributions or gain on sale may be treated as unrelated business taxable income to tax-exempt investors.
If (1) all or a portion of our assets are subject to the rules relating to taxable mortgage pools, (2) we are a ‘‘pension-held REIT,’’ or (3) a tax-exempt stockholder has incurred debt to purchase or hold our common stock, then a portion of the distributions to and, in the case of a stockholder described in clause (3), gains realized on the sale of common stock by such tax-exempt stockholder may be subject to federal income tax as unrelated business taxable income under the Internal Revenue Code.
Classification of a securitization or financing arrangement we enter into as a taxable mortgage pool could subject us or certain of our stockholders to increased taxation.
We intend to structure our securitization and financing arrangements so as to not create a taxable mortgage pool. However, if we have borrowings with two or more maturities and, (1) those borrowings are secured by mortgages or mortgage-backed securities and (2) the payments made on the borrowings are related to the payments received on the underlying assets, then the borrowings and the pool of mortgages or mortgage-backed securities to which such borrowings relate may be classified as a taxable mortgage pool under the Internal Revenue Code. If any part of our investments were to be treated as a taxable mortgage pool, then our REIT status would not be impaired, but a portion of the taxable income we recognize may, under regulations to be issued by the Treasury Department, be characterized as ‘‘excess inclusion’’ income and allocated among our stockholders to the extent of and generally in proportion to the distributions we make to each stockholder. Any excess inclusion income would:
44
|
●
|
not be allowed to be offset by a stockholder’s net operating losses;
|
|
●
|
be subject to a tax as unrelated business income if a stockholder were a tax-exempt stockholder;
|
|
●
|
be subject to the application of federal income tax withholding at the maximum rate (without reduction for any otherwise applicable income tax treaty) with respect to amounts allocable to foreign stockholders; and
|
|
●
|
be taxable (at the highest corporate tax rate) to us, rather than to our stockholders, to the extent the excess inclusion income relates to stock held by disqualified organizations (generally, tax-exempt organizations not subject to tax on unrelated business income, including governmental organizations).
|
Failure to qualify as a REIT would subject us to federal income tax, which would reduce the cash available for distribution to our stockholders.
We qualify as a REIT for federal income tax purposes commencing with our taxable year ended December 31, 2007. However, the federal income tax laws governing REITs are extremely complex, and interpretations of the federal income tax laws governing qualification as a REIT are limited. Qualifying as a REIT requires us to meet various tests regarding the nature of our assets and our income, the ownership of our outstanding stock, and the amount of our distributions on an ongoing basis. While we intend to operate so that we will qualify as a REIT, given the highly complex nature of the rules governing REITs, the ongoing importance of factual determinations, including the tax treatment of certain investments we may make, and the possibility of future changes in our circumstances, no assurance can be given that we will so qualify for any particular year. If we fail to qualify as a REIT in any calendar year and we do not qualify for certain statutory relief provisions, we would be required to pay federal income tax on our taxable income. We might need to borrow money or sell assets to pay that tax. Our payment of income tax would decrease the amount of our income available for distribution to our stockholders. Furthermore, if we fail to maintain our qualification as a REIT and we do not qualify for certain statutory relief provisions, we no longer would be required to distribute substantially all of our REIT taxable income to our stockholders. Unless our failure to qualify as a REIT were excused under federal tax laws, we would be disqualified from taxation as a REIT for the four taxable years following the year during which qualification was lost.
Failure to make required distributions would subject us to tax, which would reduce the cash available for distribution to our stockholders.
To qualify as a REIT, we must distribute to our stockholders each calendar year at least 90% of our REIT taxable income (excluding certain items of non-cash income in excess of a specified threshold), determined without regard to the deduction for dividends paid and excluding net capital gain. To the extent that we satisfy the 90% distribution requirement, but distribute less than 100% of our taxable income, we will be subject to federal corporate income tax on our undistributed income. In addition, we will incur a 4% nondeductible excise tax on the amount, if any, by which our distributions in any calendar year are less than the sum of:
|
●
|
85% of our REIT ordinary income for that year;
|
|
●
|
95% of our REIT capital gain net income for that year; and
|
|
●
|
any undistributed taxable income from prior years.
|
We intend to distribute our REIT taxable income to our stockholders in a manner intended to satisfy the 90% distribution requirement and to avoid both corporate income tax and the 4% nondeductible excise tax. REIT taxable income only includes after-tax TRS net income to the extent such TRS distributes a dividend to the REIT. Therefore, our REIT dividend distributions may or may not include after-tax net income from our TRS.
Our taxable income may substantially exceed our net income as determined by GAAP, because, for example, realized capital losses will be deducted in determining our GAAP net income, but may not be deductible in computing our taxable income. In addition, we may invest in assets that generate taxable income in excess of economic income or in advance of the corresponding cash flow from the assets. To the extent that we generate such non-cash taxable income in a taxable year, we may incur corporate income tax and the 4% nondeductible excise tax on that income if we do not distribute such income to stockholders in that year. In that event, we may be required to use cash reserves, incur debt, or liquidate non-cash assets at rates or at times that we regard as unfavorable to satisfy the distribution requirement and to avoid corporate income tax and the 4% nondeductible excise tax in that year. Moreover, our ability to distribute cash may be limited by financing facilities we may enter into.
45
Ownership limitations may restrict change of control or business combination opportunities in which our stockholders might receive a premium for their shares.
In order for us to qualify as a REIT for each taxable year after 2007, no more than 50% in value of our outstanding capital stock may be owned, directly or indirectly, by five or fewer individuals during the last half of any calendar year. ‘‘Individuals’’ for this purpose include natural persons, private foundations, some employee benefit plans and trusts, and some charitable trusts. To preserve our REIT qualification, our charter generally prohibits any person from directly or indirectly owning more than 9.8% in value or in number of shares, whichever is more restrictive, of any class or series of the outstanding shares of our capital stock. This ownership limitation could have the effect of discouraging a takeover or other transaction in which holders of our common stock might receive a premium for their shares over the then prevailing market price or which holders might believe to be otherwise in their best interests.
Our ownership of and relationship with any TRS which we may form or acquire will be limited, and a failure to comply with the limits would jeopardize our REIT status and may result in the application of a 100% excise tax.
A REIT may own up to 100% of the stock of one or more TRSs. A TRS may earn income that would not be qualifying income if earned directly by the parent REIT. Both the subsidiary and the REIT must jointly elect to treat the subsidiary as a TRS. Overall, no more than 25% of the value of a REIT’s assets may consist of stock or securities of one or more TRSs. A TRS will pay federal, state and local income tax at regular corporate rates on any taxable income that it earns. In addition, the TRS rules impose a 100% excise tax on certain transactions between a TRS and its parent REIT that are not conducted on an arm’s-length basis. Our TRS after-tax net income would be available for distribution to us but would not be required to be distributed to us. We anticipate that the aggregate value of the TRS stock and securities owned by us will be less than 25% of the value of our total assets (including the TRS stock and securities). Furthermore, we will monitor the value of our investments in our TRSs to ensure compliance with the rule that no more than 25% of the value of our assets may consist of TRS stock and securities (which is applied at the end of each calendar quarter). In addition, we will scrutinize all of our transactions with taxable REIT subsidiaries to ensure that they are entered into on arm’s-length terms to avoid incurring the 100% excise tax described above. There can be no assurance, however, that we will be able to comply with the 25% limitation discussed above or to avoid application of the 100% excise tax discussed above.
We could fail to qualify as a REIT or we could become subject to a penalty tax if income we recognize from certain investments that are treated or could be treated as equity interests in a foreign corporation exceeds 5% of our gross income in a taxable year.
We may invest in securities, such as subordinated interests in certain CDO offerings, that are treated or could be treated for federal (and applicable state and local) corporate income tax purposes as equity interests in foreign corporations. Categories of income that qualify for the 95% gross income test include dividends, interest and certain other enumerated classes of passive income. Under certain circumstances, the federal income tax rules concerning controlled foreign corporations and passive foreign investment companies require that the owner of an equity interest in a foreign corporation include amounts in income without regard to the owner’s receipt of any distributions from the foreign corporation. Amounts required to be included in income under those rules are technically neither actual dividends nor any of the other enumerated categories of passive income specified in the 95% gross income test. Furthermore, there is no clear precedent with respect to the qualification of such income under the 95% gross income test. Due to this uncertainty, we intend to limit our direct investment in securities that are or could be treated as equity interests in a foreign corporation such that the sum of the amounts we are required to include in income with respect to such securities and other amounts of non-qualifying income do not exceed 5% of our gross income. We cannot assure you that we will be successful in this regard. To avoid any risk of failing the 95% gross income test, we may be required to invest only indirectly, through a domestic TRS, in any securities that are or could be considered to be equity interests in a foreign corporation. This, of course, will result in any income recognized from any such investment to be subject to federal income tax in the hands of the TRS, which may, in turn, reduce our yield on the investment.
46
Liquidation of our assets may jeopardize our REIT qualification.
To qualify as a REIT, we must comply with requirements regarding our assets and our sources of income. If we are compelled to liquidate our investments to repay obligations to our lenders, we may be unable to comply with these requirements, ultimately jeopardizing our qualification as a REIT, or we may be subject to a 100% tax on any resultant gain if we sell assets in transactions that are considered to be prohibited transactions.
The tax on prohibited transactions will limit our ability to engage in transactions, including certain methods of securitizing mortgage loans that would be treated as sales for federal income tax purposes.
A REIT’s net income from prohibited transactions is subject to a 100% tax. In general, prohibited transactions are sales or other dispositions of property, other than foreclosure property, but including mortgage loans, held primarily for sale to customers in the ordinary course of business. We might be subject to this tax if we sold or securitized our assets in a manner that was treated as a sale for federal income tax purposes. Therefore, to avoid the prohibited transactions tax, we may choose not to engage in certain sales of assets at the REIT level and may securitize assets only in transactions that are treated as financing transactions and not as sales for tax purposes even though such transactions may not be the optimal execution on a pre-tax basis. We could avoid any prohibited transactions tax concerns by engaging in securitization transactions through a TRS, subject to certain limitations described above. To the extent that we engage in such activities through domestic TRSs, the income associated with such activities will be subject to federal (and applicable state and local) corporate income tax.
Characterization of the repurchase agreements we enter into to finance our investments as sales for tax purposes rather than as secured lending transactions would adversely affect our ability to qualify as a REIT.
We have entered into and will enter into repurchase agreements with a variety of counterparties to achieve our desired amount of leverage for the assets in which we invest. When we enter into a repurchase agreement, we generally sell assets to our counterparty to the agreement and receive cash from the counterparty. The counterparty is obligated to resell the assets back to us at the end of the term of the transaction, which is typically 30 to 90 days. We believe that for federal income tax purposes we will be treated as the owner of the assets that are the subject of repurchase agreements and that the repurchase agreements will be treated as secured lending transactions notwithstanding that such agreement may transfer record ownership of the assets to the counterparty during the term of the agreement. It is possible, however, that the IRS could successfully assert that we did not own these assets during the term of the repurchase agreements, in which case we could fail to qualify as a REIT.
Complying with REIT requirements may limit our ability to hedge effectively.
The REIT provisions of the Internal Revenue Code substantially limit our ability to hedge mortgage-backed securities and related borrowings. Under these provisions, our annual gross income from non-qualifying hedges, together with any other income not generated from qualifying real estate assets, cannot exceed 25% of our annual gross income. In addition, our aggregate gross income from non-qualifying hedges, fees, and certain other non-qualifying sources cannot exceed 5% of our annual gross income. As a result, we might have to limit our use of advantageous hedging techniques or implement those hedges through a TRS, which we may form in the future. This could increase the cost of our hedging activities or expose us to greater risks associated with changes in interest rates than we would otherwise want to bear.
We may be subject to adverse legislative or regulatory tax changes that could reduce the market price of our common stock.
At any time, the federal income tax laws or regulations governing REITs or the administrative interpretations of those laws or regulations may be amended. We cannot predict when or if any new federal income tax law, regulation or administrative interpretation, or any amendment to any existing federal income tax law, regulation or administrative interpretation, will be adopted, promulgated or become effective and any such law, regulation or interpretation may take effect retroactively. We and our stockholders could be adversely affected by any such change in, or any new, federal income tax law, regulation or administrative interpretation.
47
Dividends payable by REITs do not qualify for the reduced tax rates.
Legislation enacted in 2003 generally reduces the maximum tax rate for dividends payable to domestic stockholders that are individuals, trusts and estates from 39.6% to 20% (through 2013). Dividends payable by REITs, however, are generally not eligible for the reduced rates. Although this legislation does not adversely affect the taxation of REITs or dividends paid by REITs, the more favorable rates applicable to regular corporate dividends could cause investors who are individuals, trusts and estates to perceive investments in REITs to be relatively less attractive than investments in stock of non-REIT corporations that pay dividends, which could adversely affect the value of the stock of REITs, including our common stock.
Risks Associated With the Late Filings and Related Matters
Our failure to prepare and file timely our periodic reports with the SEC limits us from accessing the public markets to raise debt or equity capital.
We did not file this 2013 Form 10-K within the time frame required by the SEC, and we have not yet filed our Form 10-Q for the first quarter of 2014. Because we are not current in our reporting requirements with the SEC, we are limited in our ability to access the public markets to raise debt or equity capital. Our limited ability to access the public markets could prevent us from pursuing transactions or implementing business strategies that we believe would be beneficial to our business. As a result of our failure to file our SEC filings by the filing date required by the SEC (including the grace period permitted by Rule 12b-25 under the Securities Exchange Act of 1934, as amended), we are not eligible to use our current shelf registration statement on Form S-3 (or file a new Form S-3 registration statement) to conduct public offerings until filings with the SEC have been timely made for a full year. Our ineligibility to use Form S-3 during this time period will have a negative impact on our ability to quickly access the public capital markets because we would be required to file a long-form registration statement and wait for the SEC to declare such registration statement effective.
Our failure to be current in our reporting requirements with the SEC may diminish our ability to enter into borrowing arrangements with counterparties who do not have transparency into our financial performance.
To date, we have not had any counterparties to our repurchase agreement borrowing arrangements terminate any relationships as a result of our failure to be current in our reporting requirements with the SEC. However, since the fourth quarter of 2011 we have proactively reduced the amount of borrowings under our master repurchase agreements with respect to Agency RMBS to ensure that we are able to meet any margin calls.
Our failure to timely file the financial statements included in our delinquent SEC reports has caused us to modify some of our business strategies and withdraw from certain state licenses.
In order to engage in some business strategies, we are required to maintain licenses in certain jurisdictions. As a result of our failure to have timely financial statements we withdrew our licenses in various jurisdictions to avoid not being in good standing under such licenses. The failure to maintain licenses or our good standing in various jurisdictions may require us to cease certain business strategies or modify the way in which we execute such strategies. For example, without the state licenses necessary to purchase residential mortgage loans, it was necessary for us to structure securitization transactions in a different manner than we may otherwise have chosen to do. This may, among other things, cause us to be unable to execute aspects of our business which may have otherwise been profitable, or we may incur additional costs related to such business operations that we otherwise would not have. These conditions may have a material adverse effect on our business, financial condition and results of operations.
We cannot be certain that any remedial measures we have taken or intend to take will in the future ensure that we design, implement and maintain adequate controls over our financial processes and reporting with respect to future filings with the SEC, accordingly, additional material weaknesses may occur in the future.
As a result of our review of issues identified in connection with the Restatement Filing, we have determined that a material weakness in internal controls over financial reporting existed at the Company as of December 31, 2013. Specifically, we did not design and maintain adequate procedures or effective review and approval. A detailed description of this material weakness is provided in “Item 9A, Controls and Procedures.” Due to this material weakness, management has concluded that we did not maintain effective internal control over financial reporting as of December 31, 2013.
48
It is possible that additional control deficiencies may be identified in the future that may represent one or more material weaknesses that could, among other things, cause us to fail to file timely our periodic reports with the SEC; prevent us from providing reliable and accurate financial information and forecasts or from avoiding or detecting fraud; or require us to incur additional costs or divert management resources to, among other things, comply with Section 404 of the Sarbanes-Oxley Act of 2002.
We may become subject to litigation arising from the Restatement Filing or related matters, and any such litigation may have a material adverse effect on our business.
We have received shareholder demand letters regarding the Restatement Filing and related matters. These letters, among other things, generally request that our Board of Directors take various actions to recover purported damages for our benefit. These letters further reserve the shareholders’ rights to commence a shareholder derivative action.
We may incur costs and expenses as a result of the Restatement Filing, which may have a material adverse effect on results of operations.
While we currently expect to be reimbursed by our Manager for certain costs associated with the Restatement Filing (including legal, audit and consulting related costs), we may incur additional costs as a result of the Restatement Filing, or such reimbursement may not fully offset our expenses. Under these circumstances, our results of operations may be materially adversely affected. See “Item 3, Legal Proceedings.”
Item 1B. Unresolved Staff Comments
None.
Item 2. Properties
As of December 31, 2013, we do not own any property. Our executive and administrative office is located at 1211 Avenue of the Americas, Suite 2902, New York, New York 10036, telephone (646) 454-3759. We share this office space with Annaly and its subsidiaries.
Item 3. Legal Proceedings
After the issuance of the interim financial statements for the third quarter of 2011, the Audit Committee of our Board of Directors initiated an internal investigation, with the assistance of outside counsel and financial advisors engaged by outside counsel, regarding the facts and circumstances relating to our accounting for Non-Agency RMBS and the restatement of our financial statements.
Our Board of Directors has received three derivative demand letters alleging, among other things, that the directors and our officers, as well as our Manager, FIDAC, breached their fiduciary duties to us by failing to institute adequate internal controls and failing to ensure that we made accurate financial disclosures. These letters request, among other things, that the Board of Directors take action to investigate and remedy the alleged breaches of fiduciary duty. The Audit Committee expects to conclude its investigation and make final recommendations to the Board of Directors about an appropriate response to the letters within the next month. The Audit Committee has reached an understanding with FIDAC that resolves the issues raised in the derivative demand letters. The Audit Committee also expects to pursue additional remedies against other parties regarding the facts and circumstances relating to our accounting for Non-Agency RMBS and the restatement of our financial statements. These and other potential actions that may be filed against us, whether with or without merit, may divert the attention of management from our business, harm our reputation and otherwise may have a material adverse effect on our business, financial condition, results of operations and cash flows.
49
Item 4. Mine Safety Disclosures
Not applicable.
50
PART II
Item 5. Market for Registrant's Common Equity, Related Stockholder Matters and Issuer Purchases of Equity Securities
Our common stock began trading publicly on the NYSE under the trading symbol “CIM” on November 16, 2007. As of December 31, 2013, we had 1,027,626,237 shares of common stock issued and outstanding which were held by 351 holders of record of our common stock as of December 31, 2013. The following tables set forth, for the periods indicated, the high, low, and closing sales prices per share of our common stock as reported on the NYSE composite tape and the cash dividends declared per share of our common stock.
|
Stock Price
|
||||||||||||
|
High
|
Low
|
Close
|
||||||||||
|
Quarter Ended December 31, 2013
|
$ | 3.19 | $ | 2.93 | $ | 3.10 | ||||||
|
Quarter Ended September 30, 2013
|
$ | 3.07 | $ | 2.82 | $ | 3.04 | ||||||
|
Quarter Ended June 30, 2013
|
$ | 3.32 | $ | 2.90 | $ | 3.00 | ||||||
|
Quarter Ended March 31, 2013
|
$ | 3.28 | $ | 2.67 | $ | 3.19 | ||||||
|
Quarter Ended December 31, 2012
|
$ | 2.78 | $ | 2.53 | $ | 2.61 | ||||||
|
Quarter Ended September 30, 2012
|
$ | 2.81 | $ | 2.13 | $ | 2.71 | ||||||
|
Quarter Ended June 30, 2012
|
$ | 2.93 | $ | 2.36 | $ | 2.36 | ||||||
|
Quarter Ended March 31, 2012
|
$ | 3.12 | $ | 2.51 | $ | 2.83 | ||||||
|
Common Dividends Declared Per Share
|
||||
|
Quarter Ended December 31, 2013
|
$ | 0.29 | ||
|
Quarter Ended September 30, 2013
|
$ | 0.09 | ||
|
Quarter Ended June 30, 2013
|
$ | 0.09 | ||
|
Quarter Ended March 31, 2013
|
$ | 0.09 | ||
|
Quarter Ended December 31, 2012
|
$ | 0.09 | ||
|
Quarter Ended September 30, 2012
|
$ | 0.09 | ||
|
Quarter Ended June 30, 2012
|
$ | 0.09 | ||
|
Quarter Ended March 31, 2012
|
$ | 0.11 | ||
We pay quarterly dividends and distribute to our stockholders all or substantially all of our taxable income in each year (subject to certain adjustments). This enables us to qualify for the tax benefits accorded to a REIT under the Code. We have not established a minimum dividend payment level and our ability to pay dividends may be adversely affected for the reasons described under the caption “Risk Factors.” All distributions will be made at the discretion of our board of directors and will depend on our taxable income, our financial condition, maintenance of our REIT status and such other factors as our board of directors may deem relevant from time to time.
The Board of Directors declared dividends of $0.56 per share, including a special dividend of $0.20 per share, during 2013. The special dividend was paid on January 31, 2014 to shareholders of record on January 8, 2014. The Board of Directors declared dividends of $0.38 per share during 2012. The Board of Directors declared and paid a regular quarterly dividend of $0.09 per common share for the first quarter of 2014. The Board of Directors determined that there will be a quarterly dividend of $0.09 per share for the second, third and fourth quarters of 2014. The Board of Directors will review this program after the conclusion of 2014.
Share Performance Graph
The following graph and table set forth certain information comparing the yearly percentage change in cumulative total return on our common stock to the cumulative total return of the Standard & Poor’s Composite-500 Stock Index or S&P 500 Index, and the Bloomberg REIT Mortgage Index, or BBG REIT Index, an industry index of mortgage REITs. The comparison is for the period from December 31, 2008 to December 31, 2013 and assumes the reinvestment of dividends. The graph and table assume that $100 was invested in our common stock and the two other indices on December 31, 2008. Upon written request we will provide stockholders with a list of the REITs included in the BBG REIT Index.
51
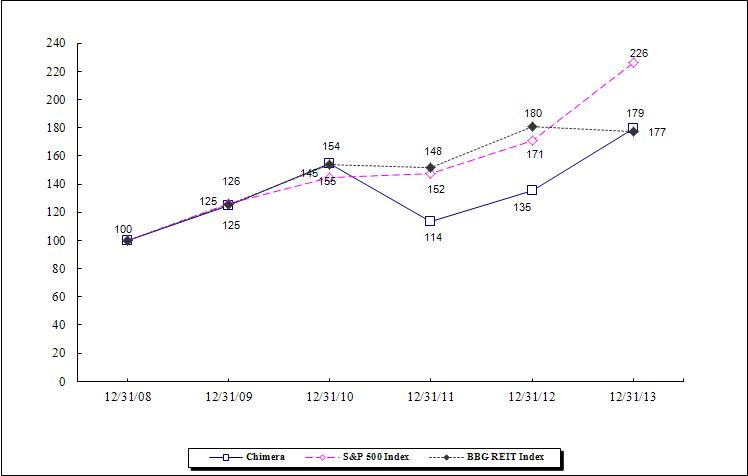
|
12/31/2008
|
12/31/2009
|
12/31/2010
|
12/31/2011
|
12/31/2012
|
12/31/2013
|
|||||||
|
Chimera
|
100
|
125
|
155
|
114
|
135
|
179
|
||||||
|
S&P 500 Index
|
100
|
126
|
145
|
148
|
171
|
226
|
||||||
|
BBG REIT Index
|
100
|
125
|
154
|
152
|
180
|
177
|
The information in the share performance graph and table has been obtained from sources believed to be reliable, but neither its accuracy nor its completeness can be guaranteed. The historical information set forth above is not necessarily indicative of future performance. Accordingly, we do not make or endorse any predictions as to future share performance.
The share performance graph and table shall not be deemed, under the Securities Act of 1933, as amended, or the Securities Exchange Act of 1934, as amended, to be (i) “soliciting material” or “filed” or (ii) incorporated by reference by any general statement into any filing made by us with the SEC, except to the extent that we specifically incorporate such share performance graph and table by reference.
52
Equity Compensation Plan Information
We have adopted a long term stock incentive plan, or Incentive Plan, to provide incentives to our independent directors and employees of our Manager and its affiliates to stimulate their efforts towards our continued success, long-term growth and profitability and to attract, reward and retain personnel and other service providers. The Incentive Plan authorizes the Compensation Committee of the board of directors to grant awards, including incentive stock options as defined under Section 422 of the Code, or ISOs, non-qualified stock options, or NQSOs, restricted shares and other types of incentive awards. The Incentive Plan authorizes the granting of options or other awards for an aggregate of 40,000,000 shares of common stock. For a description of our Incentive Plan, see Note 12 to the Consolidated Financial Statements.
The following table provides information as of December 31, 2013 concerning shares of our common stock authorized for issuance under our existing Incentive Plan.
|
Plan Category
|
Number of Securities
to be Issued Upon
Exercise of
Outstanding Options,
Warrants, and Rights
|
Weighted Average
Exercise Price of
Outstanding
Options, Warrants,
and Rights
|
Number of Securities
Remaining Available
for Future Issuance
Under Equity
Compensation Plans
|
|||||||||
|
Equity Compensation Plans Approved by Stockholders
|
- | - | 38,387,568 | |||||||||
|
Equity Compensation Plans Not Approved by Stockholders (1)
|
- | - | - | |||||||||
|
Total
|
- | - | 38,387,568 | |||||||||
|
(1) We do not have any equity plans that have not been approved by our stockholders.
|
||||||||||||
Item 6. Selected Financial Data
The following selected financial data are as of and for the years ended December 31, 2013, 2012, 2011, 2010, and 2009. The selected financial data should be read in conjunction with the more detailed information contained in the Consolidated Financial Statements and Notes thereto contained in Part IV, Financial Statements, and “Management's Discussion and Analysis of Financial Condition and Results of Operations” in Part II, Item 7, included elsewhere in this 2013 Form 10-K.
53
|
Consolidated Statements of Financial Condition Highlights
|
||||||||||||||||||||
|
(dollars in thousands, except share and per share data)
|
||||||||||||||||||||
|
December 31,
|
December 31,
|
December 31,
|
December 31,
|
December 31,
|
||||||||||||||||
|
2013
|
2012
|
2011
|
2010
|
2009
|
||||||||||||||||
|
Non-Agency Mortgage-Backed Securities
|
||||||||||||||||||||
|
Senior
|
$ | 89,687 | $ | 88 | $ | 1,020 | $ | 342,578 | $ | 2,022,412 | ||||||||||
|
Senior, interest only
|
$ | 229,065 | $ | 122,869 | $ | 188,679 | $ | 160,964 | $ | - | ||||||||||
|
Subordinated
|
$ | 457,569 | $ | 547,794 | $ | 606,895 | $ | 635,452 | $ | 361,077 | ||||||||||
|
Subordinated, interest only
|
$ | 16,571 | $ | 16,253 | $ | 22,019 | $ | 32,449 | $ | 15,376 | ||||||||||
|
RMBS transferred to consolidated variable interest entities (VIEs)
|
$ | 2,981,571 | $ | 3,274,204 | $ | 3,270,332 | $ | 4,357,666 | $ | - | ||||||||||
|
Agency Mortgage-Backed securities
|
$ | 1,997,578 | $ | 1,806,697 | $ | 3,144,531 | $ | 2,133,584 | $ | 1,690,029 | ||||||||||
|
Securitized loans held for investment
|
$ | 783,484 | $ | 1,300,131 | $ | 256,632 | $ | 349,112 | $ | 470,533 | ||||||||||
|
Total assets
|
$ | 6,936,081 | $ | 7,742,489 | $ | 7,747,135 | $ | 8,069,280 | $ | 4,618,328 | ||||||||||
|
Repurchase agreements
|
$ | 1,658,561 | $ | 1,528,025 | $ | 2,672,989 | $ | 1,808,797 | $ | 1,716,398 | ||||||||||
|
Repurchase agreements with affiliates
|
$ | - | $ | - | $ | - | $ | - | $ | 259,004 | ||||||||||
|
Securitized debt, loans held for investment
|
$ | 669,981 | $ | 1,169,710 | $ | 212,778 | $ | 289,236 | $ | 390,350 | ||||||||||
|
Securitized debt, Non-Agency RMBS transferred to consolidated VIEs
|
$ | 933,732 | $ | 1,336,261 | $ | 1,630,276 | $ | 1,956,079 | $ | - | ||||||||||
|
Total liabilities
|
$ | 3,604,571 | $ | 4,200,010 | $ | 4,699,516 | $ | 4,390,694 | $ | 2,491,766 | ||||||||||
|
Shareholders' equity
|
$ | 3,331,510 | $ | 3,542,479 | $ | 3,047,619 | $ | 3,678,586 | $ | 2,126,562 | ||||||||||
|
Book value per share (1)
|
$ | 3.24 | $ | 3.45 | $ | 2.97 | $ | 3.58 | $ | 3.17 | ||||||||||
|
Number of shares outstanding
|
1,027,626,237 | 1,027,597,458 | 1,027,467,089 | 1,027,034,357 | 670,371,587 | |||||||||||||||
|
(1) See discussion of Estimated Economic Book Value in Management's Discussion and Analysis of Financial Condition and Results of Operations.
|
||||||||||||||||||||
|
Consolidated Statements of Operations and Comprehensive Income (Loss) Highlights
|
||||||||||||||||||||
|
(dollars in thousands, except share and per share data)
|
||||||||||||||||||||
|
For the Year Ended
|
||||||||||||||||||||
|
December 31, 2013
|
December 31, 2012
|
December 31, 2011
|
December 31, 2010
|
December 31, 2009
|
||||||||||||||||
|
Interest income
|
$ | 511,783 | $ | 589,440 | $ | 705,024 | $ | 576,100 | $ | 287,683 | ||||||||||
|
Income expense
|
$ | 101,999 | $ | 126,558 | $ | 134,858 | $ | 146,448 | $ | 35,083 | ||||||||||
|
Net interest income
|
$ | 409,784 | $ | 462,882 | $ | 570,166 | $ | 429,652 | $ | 252,600 | ||||||||||
|
Net income (loss)
|
$ | 362,686 | $ | 327,767 | $ | 137,329 | $ | 248,405 | $ | 230,696 | ||||||||||
|
Income (loss) per share-basic
|
$ | 0.35 | $ | 0.32 | $ | 0.13 | $ | 0.30 | $ | 0.46 | ||||||||||
|
Average shares-basic
|
1,027,094,379 | 1,026,831,033 | 1,026,365,197 | 821,675,803 | 505,962,840 | |||||||||||||||
|
Dividends declared per share (1)
|
$ | 0.56 | $ | 0.38 | $ | 0.51 | $ | 0.69 | $ | 0.43 | ||||||||||
|
(1) For applicable period as reported in our earnings announcements.
|
||||||||||||||||||||
Item 7. Management's Discussion and Analysis of Financial Condition and Results of Operations
The following discussion of our financial condition and results of operations should be read in conjunction with the consolidated financial statements and notes to those statements included in Item 15 of this 2013 Form 10-K. The discussion may contain certain forward-looking statements that involve risks and uncertainties. Forward-looking statements are those that are not historical in nature. As a result of many factors, such as those set forth under “Risk Factors” in this 2013 Form 10-K, our actual results may differ materially from those anticipated in such forward-looking statements.
Executive Summary
We are a Maryland corporation that commenced operations on November 21, 2007. We acquire, either directly or indirectly through our subsidiaries, residential mortgage-backed securities, or RMBS, residential mortgage loans, commercial mortgage loans, real estate related securities and various other asset classes. We are externally managed by Fixed Income Discount Advisory Company, which we refer to as FIDAC or our Manager. FIDAC is a fixed-income investment management company that is registered as an investment adviser with the SEC. FIDAC is a wholly owned subsidiary of Annaly Capital Management, Inc., or Annaly. FIDAC has a broad range of experience in managing investments in Agency RMBS, which are mortgage pass-through certificates, collateralized mortgage obligations, or CMOs, and other RMBS representing interests in or obligations backed by pools of mortgage loans issued or guaranteed by Fannie Mae, Freddie Mac, and Ginnie Mae, Non-Agency RMBS, collateralized debt obligations, or CDOs, and other real estate related investments.
54
Our objective is to provide attractive risk-adjusted returns to our investors over the long-term, primarily through dividends and secondarily through capital appreciation. We intend to achieve this objective by investing in a diversified investment portfolio of RMBS, residential mortgage loans, real estate-related securities and various other asset classes, subject to maintaining our REIT status and exemption from registration under the 1940 Act. The RMBS, ABS, CMBS, and CDOs we purchase may include investment-grade and non-investment grade classes, including the BB-rated, B-rated and non-rated classes.
We rely on our Manager’s expertise in identifying assets within our target asset classes. Our Manager makes investment decisions based on various factors, including expected cash yield, relative value, risk-adjusted returns, current and projected credit fundamentals, current and projected macroeconomic considerations, current and projected supply and demand, credit and market risk concentration limits, liquidity, cost of financing and financing availability, as well as maintaining our REIT qualification and our exemption from registration under the 1940 Act.
Over time, we will modify our investment allocation strategy as market conditions change to seek to maximize the returns from our investment portfolio. We believe this strategy, combined with our Manager’s experience, will enable us to pay dividends and achieve capital appreciation through various changing interest rate and credit cycles and provide attractive long-term returns to investors.
Our targeted asset classes and the principal investments we have made and in which we may in the future invest are:
|
Asset Class
|
Principal Investments | |
|
RMBS
|
● |
Non-Agency RMBS, including investment-grade and non-investment grade classes, including the BB-rated, B-rated and non-rated classes
|
| ● | Agency RMBS | |
| ● | Interest-only (“IO”) RMBS | |
|
Residential Mortgage Loans
|
● |
Prime mortgage loans, which are mortgage loans that conform to the underwriting guidelines of Fannie Mae and Freddie Mac, which we refer to as Agency Guidelines; and jumbo prime mortgage loans, which are mortgage loans that conform to the Agency Guidelines except as to loan size
|
| ● |
Alt-A mortgage loans, which are mortgage loans that may have been originated using documentation standards that are less stringent than the documentation standards applied by certain other first lien mortgage loan purchase programs, such as the Agency Guidelines, but have one or more compensating factors such as a borrower with a strong credit or mortgage history or significant assets
|
|
| ● |
FHA/VA insured loans, which are mortgage loans that comply with the underwriting guidelines of the Federal Housing Administration (FHA) or Department of Veteran Affairs (VA) and which are guaranteed by the FHA or VA, respectively
|
|
| ● |
Mortgage servicing rights associated with residential mortgage loans, which reflect the value of the future stream of expected cash flows from the contractual rights to service a given pool of residential mortgage loans.
|
|
55
|
Commercial Mortgage Loans
|
● |
First or second lien loans secured by multifamily properties, which are residential rental properties consisting of five or more dwelling units; and mixed residential or other commercial properties; retail properties; office properties; or industrial properties, which may or may not conform to the Agency Guidelines
|
|
Other Asset-Backed Securities
|
● |
CMBS
|
| ● |
Debt and equity tranches of CDOs
|
|
| ● |
Consumer and non-consumer ABS, including investment-grade and non-investment grade classes, including the BB-rated, B-rated and non-rated classes
|
|
|
Hedging Instruments
|
● |
Swaps
|
| ● |
Swaptions
|
|
| ● |
Futures
|
|
| ● |
Index options
|
|
|
|
● |
Mortgage options
|
Since we commenced operations in November 2007, we have focused our investment activities on acquiring Non-Agency and Agency RMBS and on purchasing residential mortgage loans that have been originated by select originators, including the retail lending operations of leading commercial banks. Our investment portfolio at December 31, 2013 was weighted toward Non-Agency RMBS. At December 31, 2013, based on the amortized cost balance of our interest earning assets, approximately 49.8% of our investment portfolio was Non-Agency RMBS, 36.1% of our investment portfolio was Agency RMBS, and 14.1% of our investment portfolio was securitized residential mortgage loans. At December 31, 2012, based on the amortized cost balance of our interest earning assets, approximately 50.3% of our investment portfolio was Non-Agency RMBS, 28.2% of our investment portfolio was Agency RMBS, and 21.5% of our investment portfolio was securitized residential mortgage loans. We expect that over the near term, our investment portfolio will continue to be weighted toward Non-Agency RMBS, subject to maintaining our REIT qualification and our 1940 Act exemption.
We have engaged in transactions with residential mortgage lending operations of leading commercial banks and other originators in which we identified and re-underwrote residential mortgage loans owned by such entities, and purchased and securitized such residential mortgage loans. In the past we have also acquired formerly AAA-rated Non-Agency RMBS and immediately re-securitized those securities. We sold the resulting AAA-rated super senior RMBS and retained the rated or unrated mezzanine RMBS.
56
Our investment strategy is intended to take advantage of opportunities in the current interest rate and credit environment. We expect to adjust our strategy to changing market conditions by shifting our asset allocations across these various asset classes as interest rate and credit cycles change over time. We believe that our strategy, combined with FIDAC’s experience, will enable us to pay dividends and achieve capital appreciation throughout changing market cycles. We expect to take a long-term view of assets and liabilities, and our reported earnings and estimates of the fair value of our investments at the end of a financial reporting period will not significantly impact our objective of providing attractive risk-adjusted returns to our stockholders over the long-term.
We use leverage to seek to increase our potential returns and to finance the acquisition of our assets. Our income is generated primarily by the difference, or net spread, between the income we earn on our assets and the cost of our borrowings. We expect to finance our investments using a variety of financing sources including, when available, repurchase agreements, warehouse facilities and securitizations. We may manage our debt and interest rate risk by utilizing interest rate hedges, such as interest rate swaps, caps, options and futures to reduce the effect of interest rate fluctuations related to our financing sources.
We have elected and believe we are organized and have operated in a manner that qualifies us to be taxed as a REIT under the Code. A REIT generally will not be subject to federal income tax on taxable income that is distributed to stockholders. Furthermore, substantially all of our assets consist of qualified REIT real estate assets (of the type described in Code Section 856(c)(5)). We calculate that at least 75% of our assets were qualified REIT assets, as defined in the Code, for the years ended December 31, 2013 and 2012. We also calculate that our revenues qualified for the 75% REIT income test and for the 95% REIT income test for the years ended December 31, 2013, 2012 and 2011. We also met all REIT requirements regarding the ownership of our common stock and the distribution of our REIT taxable income. Therefore, for the years ended December 31, 2013 and 2012, we believe that we qualified as a REIT under the Code.
We operate our business to be exempt from registration under the 1940 Act, and therefore we are required to invest a substantial majority of our assets in loans secured by mortgages on real estate and real estate-related assets. Subject to maintaining our REIT qualification and our 1940 Act exemption, we do not have any limitations on the amounts we may invest in any of our targeted asset classes.
Looking forward, we cannot predict the percentage of our assets that will be invested in each asset class or whether we will invest in other classes of investments. We may change our investment strategy and policies without a vote of our stockholders.
Net Income Summary
The table below presents our net income on a GAAP basis for the years ended December 31, 2013, 2012 and 2011.
57
|
Net Income (Loss)
|
||||||||||||
|
(dollars in thousands)
|
||||||||||||
|
For the Year Ended
|
||||||||||||
|
December 31, 2013
|
December 31, 2012
|
December 31, 2011
|
||||||||||
|
Net Interest Income:
|
||||||||||||
|
Interest income
|
$ | 140,224 | $ | 172,089 | $ | 254,028 | ||||||
|
Interest expense
|
(6,770 | ) | (10,678 | ) | (11,941 | ) | ||||||
|
Interest income, Assets of consolidated VIEs
|
371,559 | 417,351 | 450,996 | |||||||||
|
Interest expense, Non-recourse liabilities of consolidated VIEs
|
(95,229 | ) | (115,880 | ) | (122,917 | ) | ||||||
|
Net interest income (expense)
|
409,784 | 462,882 | 570,166 | |||||||||
|
Other-than-temporary impairments:
|
|
|||||||||||
|
Total other-than-temporary impairment losses
|
(4,356 | ) | (47,632 | ) | (241,962 | ) | ||||||
|
Portion of loss recognized in other comprehensive income (loss)
|
(40,811 | ) | (84,618 | ) | (115,143 | ) | ||||||
|
Net other-than-temporary credit impairment losses
|
(45,167 | ) | (132,250 | ) | (357,105 | ) | ||||||
|
Other gains (losses):
|
||||||||||||
|
Net unrealized gains (losses) on derivatives
|
34,369 | (9,473 | ) | (34,478 | ) | |||||||
|
Net realized gains (losses) on derivatives
|
(7,713 | ) | (20,223 | ) | (15,929 | ) | ||||||
|
Gains (losses) on derivatives
|
26,656 | (29,696 | ) | (50,407 | ) | |||||||
|
Net unrealized gains (losses) on interest-only RMBS
|
(44,277 | ) | 833 | (14,545 | ) | |||||||
|
Net realized gains (losses) on sales of investments
|
68,107 | 85,166 | 54,353 | |||||||||
|
Realized losses on principal write-downs of Non-Agency RMBS
|
(18,316 | ) | - | - | ||||||||
|
Total other gains (losses)
|
32,170 | 56,303 | (10,599 | ) | ||||||||
|
Net investment income (loss)
|
396,787 | 386,935 | 202,462 | |||||||||
|
Other expenses:
|
||||||||||||
|
Management fees
|
25,952 | 49,525 | 51,969 | |||||||||
|
Expense recoveries from Manager
|
(6,788 | ) | (4,712 | ) | - | |||||||
|
Net Management fees
|
19,164 | 44,813 | 51,969 | |||||||||
|
Provision for loan losses, net
|
(1,799 | ) | 368 | 5,291 | ||||||||
|
General and administrative expenses
|
16,734 | 13,986 | 7,267 | |||||||||
|
Total other expenses
|
34,099 | 59,167 | 64,527 | |||||||||
|
Income (loss) before income taxes
|
362,688 | 327,768 | 137,935 | |||||||||
|
Income taxes
|
2 | 1 | 606 | |||||||||
|
Net income (loss)
|
$ | 362,686 | $ | 327,767 | $ | 137,329 | ||||||
|
Net income (loss) per share available to common shareholders:
|
||||||||||||
|
Basic
|
$ | 0.35 | $ | 0.32 | $ | 0.13 | ||||||
|
Diluted
|
$ | 0.35 | $ | 0.32 | $ | 0.13 | ||||||
|
Weighted average number of common shares outstanding:
|
||||||||||||
|
Basic
|
1,027,094,379 | 1,026,831,033 | 1,026,365,197 | |||||||||
|
Diluted
|
1,027,570,343 | 1,027,499,255 | 1,027,171,387 | |||||||||
For the year ended December 31, 2013, our net income was $362.7 million, or $0.35 per average basic common share, as compared to $327.8 million, or $0.32 per average basic common share, for the year ended December 31, 2012. For the year ended December 31, 2011, our net income was $137.3 million, or $0.13 per average basic common share. The increase in earnings for the year ended December 31, 2013 over the same period of 2012 is primarily attributable to declines in OTTI of $87.1 million from the year ended December 31, 2013 as compared to the same period of 2012 offset in part by lower net interest income year over year of $51.0 million from the year ended December 31, 2013 as compared to the same period of 2012. The increase in earnings for the year ended December 31, 2012 as compared to the same period of 2011 is primarily due to declines in OTTI of $224.9 million from the year ended December 31, 2011 as compared to the same period of 2012.
We discuss the changes in our net income in greater detail in the discussion on our results of operations below.
Trends
We expect the results of our operations to be affected by various factors, many of which are beyond our control. Our results of operations will primarily depend on, among other things, the level of our net interest income, the market value of our assets, and the supply of and demand for such assets. Economic trends, both macro as well as those directly affecting the residential housing market, and the supply and demand of RMBS may affect our operations and financial results. We also evaluate market information regarding current residential mortgage loan underwriting criteria and loan defaults to manage our portfolio of assets, leverage, and debt. Our net interest income, which reflects the amortization of purchase premiums and accretion of discounts, varies primarily as a result of changes in interest rates, borrowing costs, credit impairment losses, and prepayment speeds, which is a measurement of how quickly borrowers pay down the unpaid principal balance on their mortgage loans. Further description of these factors is provided below.
58
Prepayment Speeds. Prepayment speeds, as reflected by the Constant Prepayment Rate, or CPR, vary according to interest rates, the type of investment, conditions in financial markets, and other factors, none of which can be predicted with any certainty. In general, when interest rates rise, it is relatively less attractive for borrowers to refinance their mortgage loans, and as a result, prepayment speeds tend to decrease. When interest rates fall, prepayment speeds tend to increase. For mortgage loan and RMBS investments purchased at a premium, as prepayment speeds increase, the amount of income we earn decreases as the purchase premium on the bonds amortizes faster than expected. Conversely, decreases in prepayment speeds result in increased income and can extend the period over which we amortize the purchase premium. For mortgage loan and RMBS investments purchased at a discount, as prepayment speeds increase, the amount of income we earn increases from the acceleration of the accretion of the discount into interest income. Conversely, decreases in prepayment speeds result in decreased income as the accretion of the purchase discount into interest income occurs over a longer period. Recently, the correlation between interest rates and prepayment has not followed normal trends for certain asset classes. Due to economic hardship, some borrowers have been unable to refinance their loans as underwriting standards are more stringent and credit conditions remain restrictive.
Rising Interest Rate Environment. As indicated above, as interest rates rise, prepayment speeds generally decrease. Rising interest rates, however, increase our financing costs which may result in a net negative impact on our net interest income. In addition, if we acquire Agency and Non-Agency RMBS collateralized by monthly reset adjustable-rate mortgages, or ARMs, and three- and five-year hybrid ARMs, such interest rate increases could result in decreases in our net investment income, as the increase in our adjustable rate assets may increase slower than our adjustable rate financing. We expect that our fixed-rate assets would decline in value in a rising interest rate environment and that our net interest spreads on fixed rate assets could decline in a rising interest rate environment to the extent such assets are financed with floating rate debt.
Credit Risk. One of our strategic focuses is on acquiring distressed Non-Agency RMBS that have been downgraded because of defaults in the mortgages collateralizing such RMBS. When we acquire such RMBS we attempt to purchase it at a price such that its loss-adjusted return profile is in line with our targeted yields. We retain the risk of potential credit losses on all of the residential mortgage loans we hold in our portfolio as well as all of the Non-Agency RMBS. We attempt to mitigate credit risk in the asset selection process. Prior to the purchase of investments, we conduct a credit-risk based analysis of the collateral securing our investment that includes examining borrower characteristics, geographic concentrations, current and projected delinquencies, current and projected severities, and actual and expected prepayment speeds among other characteristics to estimate expected losses. We also acquire assets which we believe to be of high credit quality.
Size of Investment Portfolio. The size of our investment portfolio, as measured by the aggregate unpaid principal balance of our mortgage loans and aggregate principal balance of our mortgage related securities and the other assets we own, is also a key revenue driver. Generally, as the size of our investment portfolio grows, the amount of interest income we receive increases. The larger investment portfolio, however, may result in increased expenses if we incur additional interest expense to finance the purchase of our assets.
Financial Condition
Estimated Economic Book Value
This Management Discussion and Analysis section contains analysis and discussion of financial information that utilizes or presents ratios based on GAAP book value. The table and discussion below present our estimated economic book value. We calculate and disclose this non-GAAP measurement because we believe it represents an estimate of the fair value of the assets we own or are able to dispose of, pledge, or otherwise monetize. The estimated economic book value should not be viewed in isolation and is not a substitute for book value computed in accordance with GAAP.
59
GAAP requires us to consolidate certain securitizations and re-securitization transactions where we have determined that we are the primary beneficiary. In these transactions, we transferred assets to the trusts, which issued tranches of senior and subordinate notes or certificates. We sold the senior tranches and therefore have no continuing involvement in these trusts other than being a holder of notes or certificates issued by the trusts, with the same rights as other holders of the notes or certificates, except as it relates to CSMC 2012-CIM1, CSMC 2012-CIM2 and CSMC 2012-CIM3. As it relates solely to CSMC 2012-CIM1, CSMC 2012-CIM2 and CSMC 2012-CIM3, we have the ability to approve loan modifications and determine the course of action to be taken as it relates to loans in technical default, including whether or not to proceed with foreclosure. The notes and certificates we own that were issued by the trusts are largely subordinated interests in those trusts. The trusts have no recourse to our assets other than pursuant to a breach by us of the transaction documents related to the transfer of the assets by us to the trusts, but are presented as if we own 100% of the trust.
For re-securitized RMBS transactions and loan securitizations, we present the pre-securitized assets transferred into the consolidated trusts in our Consolidated Statements of Financial Condition as Non-Agency RMBS transferred to consolidated variable interest entities or Securitized loans held for investment. Post securitization RMBS assets sold are presented as liabilities in our Consolidated Statements of Financial Condition as Securitized debt, collateralized by Non-Agency RMBS and Securitized debt, collateralized by loans held for investment. We have presented the underlying securities we transferred to the trusts for the calculation of GAAP book value at fair value and recorded the corresponding liability for the notes or certificates sold to third parties at amortized cost. Fair value adjustments that are not credit related are recorded in Other comprehensive income (loss). Credit related impairments are deemed other-than-temporary and are recorded in earnings.
Because we are unable to dispose of, monetize or pledge the RMBS or loans we transferred into the trusts, we also present our estimated economic book value. We believe this measure represents the estimated value of the securities issued by these trusts that we own. In contrast to GAAP book value, our estimated economic book value considers only the assets we own or are able to dispose of, pledge, or otherwise monetize. To determine our estimated economic book value, we consider only the fair value of the notes or certificates issued by the securitization and re-securitization trusts that we actually own. Accordingly, our estimated economic book value does not include assets or liabilities for which we have no direct ownership, specifically the notes or certificates of the securitization and re-securitization trusts that were sold to third parties.
At December 31, 2013 the difference between GAAP book value and estimated economic book value was determined to be $437.8 million, or $0.42 per share. At December 31, 2012 the difference between GAAP book value and estimated economic book value was determined to be $416.1 million, or $0.40 per share. This difference is primarily driven by the value of the RMBS assets we have retained in these re-securitization transactions as compared to the value of consolidated loans and securities net of RMBS assets sold and recorded at amortized cost in these transactions. In these re-securitization transactions, we retained the subordinated, typically non-rated, first loss notes or certificates issued by the securitization trusts. These securities are complex, typically locked out as to principal repayment, relatively illiquid, and do not necessarily appreciate or depreciate in tandem with the broader Non-Agency RMBS market or with the loans on securities owned by the trusts. The tables below present the adjustments to GAAP book value that we believe are necessary to adequately reflect our calculation of estimated economic book value as of December 31, 2013 and 2012.
60
|
December 31, 2013
|
||||||||||||
|
(dollars in thousands, except per share data)
|
||||||||||||
|
GAAP Book Value
|
Adjustments
|
Estimated Economic Book Value
|
||||||||||
|
Assets:
|
||||||||||||
|
Non-Agency RMBS, at fair value
|
||||||||||||
|
Senior
|
$ | 89,687 | $ | - | $ | 89,687 | ||||||
|
Senior interest-only
|
229,065 | - | 229,065 | |||||||||
|
Subordinated
|
457,569 | - | 457,569 | |||||||||
|
Subordinated interest-only
|
16,571 | - | 16,571 | |||||||||
|
RMBS transferred to consolidated VIEs
|
2,981,571 | (1,352,028 | ) | 1,629,543 | ||||||||
|
Agency RMBS, at fair value
|
1,997,578 | - | 1,997,578 | |||||||||
|
Securitized loans held for investment, net of allowance for loan losses
|
783,484 | (689,507 | ) | 93,977 | ||||||||
|
Other assets
|
380,556 | - | 380,556 | |||||||||
|
Total assets
|
$ | 6,936,081 | $ | (2,041,535 | ) | $ | 4,894,546 | |||||
|
Liabilities:
|
||||||||||||
|
Repurchase agreements, Agency RMBS
|
1,658,561 | - | 1,658,561 | |||||||||
|
Securitized debt, collateralized by Non-Agency RMBS
|
933,732 | (933,732 | ) | - | ||||||||
|
Securitized debt, collateralized by loans held for investment
|
669,981 | (669,981 | ) | - | ||||||||
|
Other liabilities
|
342,297 | - | 342,297 | |||||||||
|
Total liabilities
|
3,604,571 | (1,603,713 | ) | 2,000,858 | ||||||||
|
Total stockholders' equity
|
3,331,510 | (437,822 | ) | 2,893,688 | ||||||||
|
Total liabilities and stockholders' equity
|
$ | 6,936,081 | $ | (2,041,535 | ) | $ | 4,894,546 | |||||
|
Book Value Per Share
|
$ | 3.24 | $ | (0.42 | ) | $ | 2.82 | |||||
|
December 31, 2012
|
||||||||||||
|
(dollars in thousands, except per share data)
|
||||||||||||
|
GAAP Book Value
|
Adjustments
|
Estimated Economic Book Value
|
||||||||||
|
Assets:
|
||||||||||||
|
Non-Agency RMBS, at fair value
|
||||||||||||
|
Senior
|
$ | 88 | $ | - | $ | 88 | ||||||
|
Senior interest-only
|
122,869 | - | 122,869 | |||||||||
|
Subordinated
|
547,794 | - | 547,794 | |||||||||
|
Subordinated interest-only
|
16,253 | - | 16,253 | |||||||||
|
RMBS transferred to consolidated VIEs
|
3,274,204 | (1,730,422 | ) | 1,543,782 | ||||||||
|
Agency RMBS, at fair value
|
1,806,697 | - | 1,806,697 | |||||||||
|
Securitized loans held for investment, net of allowance for loan losses
|
1,300,131 | (1,191,607 | ) | 108,524 | ||||||||
|
Other assets
|
674,453 | - | 674,453 | |||||||||
|
Total assets
|
$ | 7,742,489 | $ | (2,922,029 | ) | $ | 4,820,460 | |||||
|
Liabilities:
|
||||||||||||
|
Repurchase agreements, Agency RMBS
|
1,528,025 | - | 1,528,025 | |||||||||
|
Securitized debt, collateralized by Non-Agency RMBS
|
1,336,261 | (1,336,261 | ) | - | ||||||||
|
Securitized debt, collateralized by loans held for investment
|
1,169,710 | (1,169,710 | ) | - | ||||||||
|
Other liabilities
|
166,014 | - | 166,014 | |||||||||
|
Total liabilities
|
4,200,010 | (2,505,971 | ) | 1,694,039 | ||||||||
|
Total stockholders' equity
|
3,542,479 | (416,058 | ) | 3,126,421 | ||||||||
|
Total liabilities and stockholders' equity
|
$ | 7,742,489 | $ | (2,922,029 | ) | $ | 4,820,460 | |||||
|
Book Value Per Share
|
$ | 3.45 | $ | (0.40 | ) | $ | 3.05 | |||||
Our estimate of economic book value has important limitations. Our estimate of fair value is as of a point in time and subject to significant judgment, primarily the estimate of the fair value of the securities issued by the trusts which we own and can freely sell or pledge. Should we sell the assets in our portfolio, we may realize materially different proceeds from the sale than we have estimated as of the reporting date.
The calculation of estimated economic book value described above is used by management to understand the fair value of the assets we own and the liabilities for which we are legally obligated, and is presented for informational use only. The estimated economic book value should not be viewed in isolation and is not a substitute for book value computed in accordance with GAAP.
61
Portfolio Review
During the year ended December 31, 2013, on an aggregate basis, we purchased $2.4 billion, sold $1.2 billion, and received $1.5 billion in principal payments related to our Agency and Non-Agency RMBS. In addition, we used $914.2 million of proceeds from our assets to repay principal on our securitized debt.
The following table summarizes certain characteristics of our portfolio at December 31, 2013 and 2012.
|
December 31, 2013
|
December 31, 2012
|
|||||||
|
Interest earning assets at period-end (1)
|
$ | 6,555,525 | $ | 7,068,036 | ||||
|
Interest bearing liabilities at period-end
|
$ | 3,262,274 | $ | 4,033,996 | ||||
|
Leverage at period-end
|
1.0:1
|
1.1:1
|
||||||
|
Leverage at period-end (recourse)
|
0.5:1
|
0.4:1
|
||||||
|
Portfolio Composition, at amortized cost
|
||||||||
|
Non-Agency RMBS
|
49.8 | % | 50.3 | % | ||||
|
Senior
|
1.5 | % | 0.0 | % | ||||
|
Senior, interest only
|
5.1 | % | 2.3 | % | ||||
|
Subordinated
|
6.0 | % | 7.8 | % | ||||
|
Subordinated, interest only
|
0.3 | % | 0.3 | % | ||||
|
RMBS transferred to consolidated VIEs
|
36.9 | % | 39.9 | % | ||||
|
Agency RMBS
|
36.1 | % | 28.2 | % | ||||
|
Securitized loans
|
14.1 | % | 21.5 | % | ||||
|
Fixed-rate percentage of portfolio
|
76.3 | % | 75.5 | % | ||||
|
Adjustable-rate percentage of portfolio
|
23.7 | % | 24.5 | % | ||||
|
Annualized yield on average interest earning assets for the year ended
|
8.81 | % | 8.59 | % | ||||
|
Annualized cost of funds on average borrowed funds for the year ended (2)
|
3.51 | % | 3.29 | % | ||||
|
(1) Excludes interest income on cash and cash equivalents.
|
||||||||
|
(2) Includes the effect of realized losses on interest rate swaps and US Treasury futures.
|
||||||||
The following table presents details of each asset class in our portfolio at December 31, 2013 and 2012. The principal or notional value represents the interest income earning balance of each class. The weighted average figures are weighted by each investment’s respective principal/notional value in the asset class.
|
December 31, 2013
|
||||||||||||||||||||||||||||||||||||||||||||
|
Principal or Notional Value at Period-End
(dollars in thousands)
|
Weighted Average Amortized Cost Basis
|
Weighted Average Fair Value
|
Weighted Average Coupon
|
Weighted Average Yield at Period-End
(1)
|
Weighted Average 3 Month CPR at Period-End
|
Weighted Average 12 Month CPR at Period-End
|
Weighted Average Delinquency Pipeline 60+
|
Weighted Average Loss Severity (2)
|
Weighted Average Credit Enhancement
|
Principal Writedowns During Period
(dollars in thousands)
|
||||||||||||||||||||||||||||||||||
|
Non-Agency Mortgage-Backed Securities
|
||||||||||||||||||||||||||||||||||||||||||||
|
Senior
|
$ | 128,217 | $ | 69.27 | $ | 69.95 | 1.42 | % | 5.87 | % | 12.11 | % | 15.05 | % | 38.00 | % | 63.26 | % | 8.28 | % | $ | 297 | ||||||||||||||||||||||
|
Senior, interest only
|
$ | 5,742,781 | $ | 4.93 | $ | 3.99 | 1.44 | % | 17.17 | % | 15.23 | % | 16.78 | % | 19.90 | % | 51.06 | % | 0.00 | % | $ | - | ||||||||||||||||||||||
|
Subordinated
|
$ | 830,632 | $ | 40.96 | $ | 55.09 | 2.94 | % | 13.49 | % | 17.00 | % | 19.59 | % | 16.18 | % | 49.58 | % | 12.55 | % | $ | 6,563 | ||||||||||||||||||||||
|
Subordinated, interest only
|
$ | 274,462 | $ | 5.34 | $ | 6.04 | 1.73 | % | 8.97 | % | 16.99 | % | 18.09 | % | 15.41 | % | 45.00 | % | 0.00 | % | $ | - | ||||||||||||||||||||||
|
RMBS transferred to consolidated variable interest entities
|
$ | 3,912,376 | $ | 54.17 | $ | 77.82 | 4.66 | % | 15.84 | % | 11.67 | % | 14.73 | % | 25.79 | % | 57.90 | % | 1.56 | % | $ | 34,386 | ||||||||||||||||||||||
|
Agency Mortgage-Backed Securities
|
$ | 2,145,475 | $ | 106.83 | $ | 105.24 | 3.99 | % | 3.43 | % | 8.81 | % | 19.81 | % |
NA
|
NA
|
0.00 | % | $ | - | ||||||||||||||||||||||||
|
Securitized loans
|
$ | 776,074 | $ | 102.12 | $ | 98.26 | 4.70 | % | 3.50 | % | 0.00 | % | 0.00 | % | 0.00 | % | 0.00 | % | 0.00 | % | $ | (6 | ) | |||||||||||||||||||||
|
(1) Bond Equivalent Yield at period end. Weighted Average Yield is calculated using each investment's respective amortized cost.
|
||||||||||||||||||||||||||||||||||||||||||||
|
(2) Calculated based on reported losses to date, utilizing widest data set available (i.e., life-time losses, 12-month loss, etc.)
|
||||||||||||||||||||||||||||||||||||||||||||
|
December 31, 2012
|
||||||||||||||||||||||||||||||||||||||||||||
|
Principal or Notional Value at Period-End
(dollars in thousands)
|
Weighted Average Amortized Cost Basis
|
Weighted Average Fair Value
|
Weighted Average Coupon
|
Weighted Average Yield at Period-End
(1)
|
Weighted Average 3 Month CPR at Period-End
|
Weighted Average 12 Month CPR at Period-End
|
Weighted Average Delinquency Pipeline 60+
|
Weighted Average Loss Severity (2)
|
Weighted Average Credit Enhancement
|
Principal Writedowns During Period
(dollars in thousands)
|
||||||||||||||||||||||||||||||||||
|
Non-Agency Mortgage-Backed Securities
|
||||||||||||||||||||||||||||||||||||||||||||
|
Senior
|
$ | 126 | $ | 57.02 | $ | 67.00 | 0.00 | % | 11.90 | % | 22.60 | % | 38.60 | % | 0.00 | % | 0.00 | % | 12.80 | % | $ | - | ||||||||||||||||||||||
|
Senior, interest only
|
$ | 3,012,868 | $ | 4.51 | $ | 4.08 | 1.76 | % | 10.36 | % | 17.35 | % | 17.44 | % | 20.13 | % | 50.43 | % | 0.00 | % | $ | - | ||||||||||||||||||||||
|
Subordinated
|
$ | 1,057,821 | $ | 44.72 | $ | 51.79 | 3.18 | % | 11.07 | % | 17.36 | % | 18.74 | % | 18.72 | % | 51.03 | % | 15.22 | % | $ | 15,807 | ||||||||||||||||||||||
|
Subordinated, interest only
|
$ | 256,072 | $ | 6.32 | $ | 6.35 | 2.25 | % | 8.90 | % | 20.93 | % | 16.79 | % | 19.97 | % | 44.82 | % | 0.00 | % | $ | - | ||||||||||||||||||||||
|
RMBS transferred to consolidated variable interest entities
|
$ | 4,610,109 | $ | 53.96 | $ | 72.50 | 4.88 | % | 15.44 | % | 14.85 | % | 14.86 | % | 29.42 | % | 59.02 | % | 2.29 | % | $ | 70,953 | ||||||||||||||||||||||
|
Agency Mortgage-Backed Securities
|
$ | 1,756,580 | $ | 103.09 | $ | 108.24 | 4.65 | % | 3.59 | % | 28.39 | % | 24.12 | % |
NA
|
NA
|
0.00 | % | $ | - | ||||||||||||||||||||||||
|
Securitized loans
|
$ | 1,284,845 | $ | 102.09 | $ | 102.79 | 4.68 | % | 3.88 | % | 35.21 | % | 4.45 | % | 0.84 | % | 4.35 | % | 11.18 | % | $ | 404 | ||||||||||||||||||||||
|
(1) Bond Equivalent Yield at period end. Weighted Average Yield is calculated using each investment's respective amortized cost.
|
||||||||||||||||||||||||||||||||||||||||||||
|
(2) Calculated based on reported losses to date, utilizing widest data set available (i.e., life-time losses, 12-month loss, etc.).
|
||||||||||||||||||||||||||||||||||||||||||||
Based on the projected cash flows for our Non-Agency RMBS that are not of high credit quality, a portion of the original purchase discount is designated as Accretable Discount, which reflects the purchase discount expected to be accreted into interest income, and a portion is designated as Non-Accretable Difference, which represents the contractual principal on the security that is not expected to be collected. The amount designated as Non-Accretable Difference may be adjusted over time, based on the actual performance of the security, its underlying collateral, actual and projected cash flow from such collateral, economic conditions and other factors. If the performance of a security is more favorable than previously estimated, a portion of the amount designated as Non-Accretable Difference may be accreted into interest income over time. Conversely, if the performance of a security is less favorable than previously estimated, the amounts designated as Non-Accretable Difference may increase, resulting in an OTTI loss.
62
The following table presents changes to Accretable Discount and Non-Accretable Difference as it pertains to our entire Non-Agency RMBS portfolio for assets with purchase discounts during the previous five quarters.
|
Accretable Discount
|
||||||||||||||||||||
|
For the Quarter Ended
|
||||||||||||||||||||
|
December 31, 2013
|
September 30, 2013
|
June 30, 2013
|
March 31, 2013
|
December 31, 2012
|
||||||||||||||||
|
(dollars in thousands)
|
||||||||||||||||||||
|
Balance, beginning of period
|
$ | 1,012,513 | $ | 1,026,921 | $ | 1,088,157 | $ | 1,115,268 | $ | 1,118,478 | ||||||||||
|
Accretion of discount
|
(40,812 | ) | (40,001 | ) | (40,042 | ) | (39,326 | ) | (40,282 | ) | ||||||||||
|
Purchases
|
- | - | - | 935 | - | |||||||||||||||
|
Sales
|
- | (6,655 | ) | (46,125 | ) | (17 | ) | 8 | ||||||||||||
|
Transfers from credit reserve
|
28,962 | 35,054 | 30,744 | 18,419 | 39,475 | |||||||||||||||
|
Transfers to credit reserve
|
(3,969 | ) | (2,806 | ) | (5,813 | ) | (7,122 | ) | (2,411 | ) | ||||||||||
|
Balance, end of period
|
$ | 996,694 | $ | 1,012,513 | $ | 1,026,921 | $ | 1,088,157 | $ | 1,115,268 | ||||||||||
|
Non-Accretable Difference
|
||||||||||||||||||||
|
For the Quarter Ended
|
||||||||||||||||||||
|
December 31, 2013
|
September 30, 2013
|
June 30, 2013
|
March 31, 2013
|
December 31, 2012
|
||||||||||||||||
|
(dollars in thousands)
|
||||||||||||||||||||
|
Balance, beginning of period
|
$ | 1,261,945 | $ | 1,370,792 | $ | 1,464,558 | $ | 1,540,780 | $ | 1,655,222 | ||||||||||
|
Principal Writedowns
|
(41,708 | ) | (93,054 | ) | (68,835 | ) | (72,055 | ) | (85,555 | ) | ||||||||||
|
Purchases
|
- | - | - | 935 | - | |||||||||||||||
|
Sales
|
- | - | - | 32 | (8 | ) | ||||||||||||||
|
Net other-than-temporary credit impairment losses
|
22,549 | 16,455 | - | 6,163 | 8,185 | |||||||||||||||
|
Transfers from credit reserve
|
(28,962 | ) | (35,054 | ) | (30,744 | ) | (18,419 | ) | (39,475 | ) | ||||||||||
|
Transfers to credit reserve
|
3,969 | 2,806 | 5,813 | 7,122 | 2,411 | |||||||||||||||
|
Balance, end of period
|
$ | 1,217,793 | $ | 1,261,945 | $ | 1,370,792 | $ | 1,464,558 | $ | 1,540,780 | ||||||||||
Critical Accounting Policies and Estimates
Accounting policies are integral to understanding our Management’s Discussion and Analysis of Financial Condition and Results of Operations. The preparation of financial statements in accordance with GAAP requires management to make certain judgments and assumptions, on the basis of information available at the time of the financial statements, in determining accounting estimates used in the preparation of these statements. Our significant accounting policies and accounting estimates are described in Note 2 to the Consolidated Financial Statements. Critical accounting policies are described in this section. An accounting policy is considered critical if it requires management to make assumptions or judgments about matters that are highly uncertain at the time the accounting estimate was made or require significant management judgment in interpreting the accounting literature. If actual results differ from our judgments and assumptions, or other accounting judgments were made, this could have a significant and potentially adverse impact on our financial condition, results of operations and cash flows. These critical accounting policies were developed by management, and reviewed by our auditors, prior to being presented to and discussed with the Audit Committee of the Board of Directors.
The consolidated financial statements include, on a consolidated basis, our accounts, the accounts of our wholly-owned subsidiaries, and variable interest entities, or VIEs, for which we are the primary beneficiary. All significant intercompany balances and transactions have been eliminated in consolidation.
Use of Estimates
The preparation of financial statements in conformity with GAAP requires management to make estimates and assumptions that affect the reported amounts of assets and liabilities and disclosure of contingent assets and liabilities at the date of the financial statements and the reported amounts of revenues and expenses during the reporting period. Although our estimates contemplate current conditions and how we expect them to change in the future, it is reasonably possible that actual conditions could be different than anticipated in those estimates, which could materially adversely impact our results of operations and our financial condition. Management has made significant estimates in several areas, including OTTI of Non-Agency RMBS, valuation of Agency and Non-Agency RMBS and interest rate swaps and income recognition on Non-Agency RMBS. Actual results could differ materially from those estimates.
63
Interest Income and Impairment on Non-Agency and Agency Residential Mortgage-Backed Securities
We invest in RMBS representing interests in obligations backed by pools of mortgage loans. We delineate between (1) Agency RMBS and (2) Non-Agency RMBS as follows: The Agency RMBS are mortgage pass-through certificates, collateralized mortgage obligations (“CMOs”), and other RMBS representing interests in or obligations backed by pools of mortgage loans issued or guaranteed as to principal and/or interest repayment by agencies of the U.S. Government or federally chartered corporations such as Ginnie Mae, Freddie Mac or Fannie Mae. The Non-Agency RMBS are not issued or guaranteed by Fannie Mae, Freddie Mac, or Ginnie Mae and are therefore subject to credit risk.
We hold our RMBS as available-for-sale, record these investments at estimated fair value as described in Note 5 of our consolidated financial statements, and include unrealized gains and losses considered to be temporary in Other comprehensive income (loss) in our Consolidated Statements of Operations and Comprehensive Income (Loss). From time to time, as part of the overall management of our portfolio, we may sell any of our RMBS investments and recognize a realized gain or loss as a component of earnings in our Consolidated Statements of Operations and Comprehensive Income (Loss) utilizing the specific identification method.
Our accounting policies for recognition of interest income and OTTI related to RMBS are described in Note 2 of the consolidated financial statements. As noted therein, there are three different accounting models that may be applicable for purposes of the recognition of interest income and OTTI on RMBS, and include the following:
ASC 310-20, Nonrefundable Fees and Other Costs (ASC 310-20) – applies to all Agency RMBS and certain Non-Agency RMBS of high credit quality that, at the time of purchase, we expect to collect all contractual cash flows and the security cannot be contractually prepaid in such a way that the we would not recover substantially all of our recorded investment.
ASC 310-30, Loans and Debt Securities Acquired with Deteriorated Credit Quality (ASC 310-30) – applies to Non-Agency RMBS where there is evidence of deterioration in credit quality and that we do not expect to collect all contractual cash flows of the security.
ASC 325-40, Beneficial Interests in Securitized Financial Assets (ASC 325-40) – applies to certain Non-Agency RMBS not within the scope of ASC 310-20 or ASC 310-30. These include Non-Agency RMBS which is not of high credit quality at the time of purchase or that can be contractually prepaid or otherwise settled in such a way that we would not recover substantially all of our recorded investment.
The determination of which accounting model to apply will have a significant impact on the amounts of interest income and OTTI losses reflected in the results of operations because each accounting model has different requirements regarding the cash flows used to calculate interest income and impairments (i.e., contractual cash flows vs. expected cash flows) and the manner of such calculations, and the impact of changes in prepayment assumptions on interest income or OTTI losses.
For Agency and Non-Agency RMBS accounted for under ASC 310-20, the amount of interest income recorded over the life of a security will be equal to the contractual cash flows of the security and the accretion/amortization of any purchase discount or premium. The amount of interest income reported in any particular financial reporting period will, however, vary depending on the actual and estimated prepayments on the security. For Agency RMBS purchased at a premium to the principal amount, increases in prepayment speeds will generally result in a reduction of the recorded amount of interest income in a particular financial reporting period whereas decreases in prepayment speeds will generally result in an increase in the amount of interest income in a particular financial reporting period. The opposite is generally the case for Agency RMBS purchased at a discount to the principal amount. That is, as prepayment speeds increase, interest income reported in a particular financial reporting period will generally increase, whereas interest income reported in a particular financial reporting period will generally decrease when prepayment speeds decline. However, volatility in the reported amount of interest income will result when there are significant changes in actual or future expected prepayment speeds regardless of the direction of those changes. This volatility is because the accounting model that we apply under ASC 310-20 requires us to record a cumulative adjustment, on a retrospective basis from the acquisition date of the security, when there are changes in prepayment speeds. That cumulative adjustment at each reporting date is intended to reflect the most current estimate of the timing of prepayments over the life of the security (both actual prepayments that have occurred in the past and the timing of prepayments that will occur in the future).
64
Agency RMBS and Non-Agency RMBS accounted for under ASC 310-20 may experience an OTTI loss. The OTTI loss recognized in earnings will be calculated based on the present value of the contractual cash flows expected to be collected. Subsequent to recognition of an OTTI loss, we recognize income on these securities under ASC 310-30 as further described below.
For Non-Agency RMBS accounted for under ASC 310-30 or ASC 325-40, the reported amounts of interest income and OTTI are significantly impacted by management judgments around both the amount and timing of credit losses (defaults) and prepayments. Interest income on these Non-Agency RMBS is recognized initially and in subsequent periods based on the timing and amount of cash flows expected to be collected, as opposed to being based on contractual cash flows. The accounting models in ASC 310-30 and ASC 325-40 do not provide for delineations between individual changes in cash flow estimates based on expected defaults or prepayments. Said differently, we are required to consider the overall impact on the amount and timing of future cash flows whether due to changes in default expectations or prepayments in order to determine the amount of interest income to recognize. Furthermore, the overall impact on the amount and timing of future cash flows whether due to changes in default expectations or prepayments also impacts the amount of OTTI losses recognized in earnings.
Non-Agency RMBS accounted for under ASC 310-30 or ASC 325-40 is generally purchased at a discount to the principal amount. At the original acquisition date, we estimate the timing and amount of cash flows expected to be collected and calibrate the present value of those amounts to our purchase price. In each subsequent financial reporting period, we are required to revise our estimates of the remaining timing and amount of cash flows expected to be collected. Depending on the nature of the changes in the timing or amount of cash flows expected to be collected, whether due to changes in default expectations or prepayment assumptions, the following will occur:
|
●
|
If there is a positive change in the amount and timing of future cash flows expected to be collected from the previous estimate used for accounting purposes, the effective interest rate in future accounting periods may increase resulting in an increase in the reported amount of interest income in future periods. A positive change in the amount and timing of future cash flows expected to be collected from the previous estimate used for accounting purposes must be considered significant for Non-Agency RMBS accounted for under ASC 310-30 for the effective interest rate in future accounting periods to increase. An OTTI loss will not be recorded in earnings in the period we determine there is a positive change in the amount and timing of future estimated cash flows. A positive change in the amount and timing of future cash flows expected to be collected is considered to have occurred when the net present value of future cash flows expected to be collected has increased from the previous estimate. This can occur from a change in either the timing of when cash flows are expected to be collected (i.e., from changes in prepayment speeds or the timing of estimated defaults) or in the amount of cash flows expected to be collected (i.e., from reductions in estimates of future defaults). Furthermore, a positive change could occur on an overall basis in situations where the positive impact of a change in the timing of cash flows exceeds the negative impact of increased defaults, or when the positive impact of a decline in estimated defaults exceeds the negative impact of an extension of the timing of receipt of cash flows.
|
|
●
|
If there is a negative (or adverse) change in the amount and timing of future cash flows expected to be collected from the previous estimate used for accounting purposes, and the securities’ fair value is below its amortized cost, an OTTI loss equal to the adverse change in cash flows expected to be collected, discounted using the securities’ effective rate before impairment, is required to be recorded in current period earnings. For Non-Agency RMBS accounted for under ASC 310-30, while the effective interest rate used to accrete interest income after an OTTI has been recognized will be the same, the amount of interest income recorded in future periods will decline because of the reduced amount of the amortized cost basis of the investment to which such effective interest rate is applied. Additionally, for Non-Agency RMBS accounted for under ASC 325-40, while the effective interest rate used to accrete interest income during the period directly after an OTTI has been recognized will be the same, the amount of interest income recorded in such future period will decline, absent an increase in cash flows expected to be collected, because of the reduced amount of the amortized cost basis of the investment to which such effective interest rate is applied. An adverse change in the amount and timing of future cash flows expected to be collected is considered to have occurred when the net present value of future cash flows expected to be collected has decreased from the most previous estimate. This change can occur from a change in either the timing of when cash flows are expected to be collected (i.e., from changes in prepayment speeds or the timing of estimated defaults) or in the amount of cash flows expected to be collected (i.e., from increases in estimates of future defaults). Furthermore, an adverse change could occur on an overall basis in situations where the negative impact of a change in the timing of cash flows exceeds the positive impact of a decline in estimated defaults, or when the negative impact of an increase in estimated defaults exceeds the positive impact of shortening of the timing of receipt of cash flows.
|
65
Because the accounting models in ASC 310-30 and ASC 325-40 are impacted by both assumptions of prepayments and assumptions of credit losses (defaults), changes in the amounts of recorded interest income or OTTI losses over financial reporting periods cannot be considered to result solely from the impact of changes in the credit profile of the investment or solely from the impact of changes in prepayment speeds. Furthermore, while there may be some level of correlation between assumptions for defaults and prepayments as general market interest rates change, in the recent market conditions that correlation has not been direct and predictable.
Determination of appropriate accounting model for Non-Agency RMBS
As discussed in Note 2 to the consolidated financial statements, the determination of the appropriate accounting model for Non-Agency RMBS is dependent on management’s assessment and judgment related to the following factors made as of the acquisition date:
|
●
|
Our assessment of the credit quality of the asset, including its credit rating at the acquisition date and whether the security has experienced deterioration in credit quality since its inception.
|
|
●
|
Our assessment of the probability of collection of all contractual cash flows.
|
|
●
|
Our assessment of whether the security can be contractually prepaid such that we would not recover our initial investment.
|
The most critical judgment inherent in the determination of the appropriate accounting model is our assessment of the cash flows expected to be collected at the acquisition date. In making this accounting judgment, we consider expected defaults and prepayments as further described below.
Impact of prepayment assumptions on RMBS accounted for under ASC 310-20
Changes in actual prepayments will impact the amount of interest income recognized in each financial reporting period for RMBS accounted for under ASC 310-20. We estimate expected prepayment as further described below.
Impact of default and prepayment assumptions on Non-Agency RMBS accounted for under ASC 310-30 and ASC 325-40
Management judgments around the estimated amount and timing of defaults, and the timing of collection of cash flows (i.e., prepayments and the timing of defaults) will have a significant impact on the reported amount of interest income and OTTI losses. Furthermore, it is the combined impact of the assumptions for the amount and timing of cash flows from defaults and prepayments that will impact the reported amounts of interest income and OTTI losses.
Our estimate of cash flows expected to be collected related to Non-Agency RMBS is based on our review of the underlying securities or mortgage loans securing the RMBS. We consider historical information available and expected future performance of the underlying securities or mortgage loans, including timing of expected future cash flows, prepayment rates, default rates, loss severities, delinquency rates, percentage of non-performing loans, extent of credit support available, Fair Isaac Corporation (“FICO”) scores at loan origination, year of origination, loan-to-value ratios, geographic concentrations, as well as reports by credit rating agencies, such as Moody’s Investors Services, Inc. (“Moody’s”), Standard & Poor’s Corporation (“S&P”), Fitch, Inc. or DBRS Limited (collectively, “Rating Agencies”), general market assessments, and dialogue with market participants. However, the assumptions underlying these estimates are generally not based on observable market data, but rather reflect unobservable inputs based on management judgment. As a result, substantial judgment is used in our analysis to determine the cash flows expected to be collected related to Non-Agency RMBS.
In determining the OTTI related to credit losses for Non-Agency RMBS securities accounted for under ASC 310-30 and ASC 325-40, we compare the present value of the remaining cash flows expected to be collected at the purchase date (or last date previously revised) against the present value of the cash flows expected to be collected at the current financial reporting date. The discount rate used to calculate the present value of expected future cash flows is the effective interest rate or effective yield used for income recognition purposes.
66
Variable Interest Entities
VIEs are defined as entities in which equity investors (i) do not have the characteristics of a controlling financial interest, and/or (ii) do not have sufficient equity at risk for the entity to finance its activities without additional subordinated financial support from other parties. The entity that consolidates a VIE is known as its primary beneficiary, and is generally the entity with (i) the power to direct the activities that most significantly impact the VIE’s economic performance, and (ii) the right to receive benefits from the VIE or the obligation to absorb losses of the VIE that could be significant to the VIE. For VIEs’ that do not have substantial on-going activities, the power to direct the activities that most significantly impact the VIEs’ economic performance may be determined by an entity’s involvement with the design of the VIE.
We use securitization trusts considered to be VIEs in securitization and re-securitization transactions. Prior to January 1, 2010, these VIEs met the definition of Qualified Special Purpose Entities (“QSPE”) and, as such, were not subject to consolidation by us. Effective January 1, 2010, all such VIEs were considered for consolidation based on the criteria in ASC 810, Consolidation.
Our Consolidated Statements of Financial Condition contain the assets and liabilities related to ten consolidated variable interest entities, or VIEs. Due to the non-recourse nature of these VIEs our net exposure to loss from investments in these entities is limited to our retained beneficial interests.
We currently consolidate four residential mortgage loan securitizations and six RMBS re-securitization transactions which are VIEs. The residential mortgage loan securitizations contain jumbo prime residential mortgage loans we purchased during 2007 and 2008 and securitized shortly thereafter. The RMBS re-securitization transactions contain Non-Agency RMBS comprised of primarily what we classify as collateral backed by Alt-A first lien mortgages of 2005-2007 vintages. We categorize collateral as Alt-A regardless of whether the loans were originally described as “prime” if the behavior of the collateral when we purchased the security more resembles typical Alt-A collateral. We define Alt-A collateral characteristics to be evidenced by the 60+ day delinquency bucket of the pool being greater than 5% and the weighted average FICO scores at the time of origination as greater than 650.
Our determination to consolidate these ten VIEs was significantly influenced by management’s judgment related to the activities that most significantly impact the economic performance of these entities and the identification of the party with the power over such activities. For the residential mortgage loan securitizations, we determined that our ability to replace defaulting loans with performing loans resulted in us having the power that most significantly impacts the economic performance of the VIE. For the six consolidated RMBS re-securitization transactions, we determined that no party has power over any ongoing activities of the entities and therefore the determination of the primary beneficiary should be based on involvement with the initial design of the entity. Since we transferred the RMBS to the securitization entities, we determined we had the power over the design of the entity, which resulted in us being considered the primary beneficiary. This determination was influenced by the amount of economic exposure to the financial performance of the entity and required a significant management judgment in determining that we should consolidate these six entities.
Due to the consolidation of these VIEs, our actual ownership interests in the securitization and re-securitizations have been eliminated in consolidation and the Consolidated Statements of Financial Condition reflect both the assets held and non-recourse debt issued to third parties by these VIEs. In addition, our operating results and cash flows include the gross amounts related to the assets and liabilities of the VIEs as opposed to the actual economic interests we own in these VIEs. Our interest in these VIEs is restricted to the beneficial interests we retained in these transactions. We are not obligated to provide any financial support to these VIEs.
67
Our Consolidated Statements of Financial Condition separately present: (i) our direct assets and liabilities, and (ii) the assets and liabilities of our consolidated securitization vehicles. Assets of all consolidated VIEs can only be used to satisfy the obligations of those VIEs, and the liabilities of consolidated VIEs are non-recourse to us.
We have aggregated all the assets and liabilities of the consolidated securitization vehicles due to our determination that these entities are substantively similar and therefore a further disaggregated presentation would not be more meaningful. The notes to our consolidated financial statements describe our direct assets and liabilities and the assets and liabilities of our consolidated securitization vehicles. See Note 8 to our consolidated financial statements for additional information related to our investments in VIEs.
Fair Value Measurements
The Financial Accounting Standards Board, or FASB, defines fair value, establishes a framework for measuring fair value, and requires certain disclosures about fair value measurements under GAAP. Specifically, this guidance defines fair value based on exit price, or the price that would be received upon the sale of an asset or the transfer of a liability in an orderly transaction between market participants at the measurement date. Valuation techniques for RMBS are based on models that consider the estimated cash flows expected to be collected from the underlying collateral and an estimated market-based yield reflective of the unique attributes of the tranche including, but not limited to, assumptions related to prepayment speeds, the frequency and severity of defaults and attributes of the collateral underlying such securities. Estimates of the fair value of RMBS are particularly sensitive to assumptions related to the expected timing of prepayments, the extent of defaults, and the severity of expected losses. Management reviews the fair values generated by the model to determine whether prices are reflective of the current market. Management indirectly corroborates its estimates of the fair value using pricing models by comparing its results to independent prices provided by third party pricing services.
To the extent the inputs used to estimate fair value are observable, the values would be categorized in Level 2 of the fair value hierarchy; otherwise they would be categorized as Level 3. The Company’s fair value estimation process utilizes inputs other than quoted prices that are observed in the market. The Company’s estimate of prepayment, default and severity curves all involve adjustments that are deemed to be significant to the fair value measurement process, which renders the resulting Non-Agency fair value estimates Level 3 inputs in the fair value hierarchy. Level 3 assets represent approximately 65% and 69% of total assets measured at fair value on a recurring basis as of December 31, 2013 and 2012, respectively. None of the liabilities measured at fair value on a recurring basis as of December 31, 2013 and 2012 are Level 3.
Our assets and liabilities which are measured at fair value are discussed in Note 5 to our consolidated financial statements.
Recent Accounting Pronouncements
Refer to Note 2(q) in the Notes to Consolidated Financial Statements for a discussion of accounting guidance recently adopted by the Company.
Results of operations for the years ended December 31, 2013, 2012 and 2011
Our primary source of income is interest income earned on our assets. Our economic net interest income equals interest income excluding interest earned on cash and cash equivalents less interest expense and realized losses on our interest rate hedges. For the purpose of computing economic net interest income and ratios relating to cost of funds measures throughout this section, interest expense includes net payments on interest rate hedges, including interest rate swaps and Treasury futures, which is presented as a part of Realized gains (losses) on derivatives in our Consolidated Statements of Operations and Comprehensive Income. Interest rate hedges are used to manage the increase in interest paid on repurchase agreements in a rising rate environment. Presenting the net contractual interest payments on interest rate hedges with the interest paid on interest-bearing liabilities reflects our total contractual interest payments. We believe this presentation is useful to investors because this presentation depicts the economic value of our investment strategy, by showing actual interest expense and net interest income. Where indicated, interest expense, including interest payments on interest rate hedges, is referred to as economic interest expense. Where indicated, net interest income reflecting interest payments on interest rate hedges, is referred to as economic net interest income.
68
The following table reconciles the GAAP and non-GAAP measurements reflected in the Management’s Discussion and Analysis of Financial Condition and Results of Operations.
|
GAAP
Interest
Income
|
GAAP
Interest
Expense
|
Add: Net
Realized Losses
on Interest
Rate Hedges
|
Economic
Interest
Expense
|
GAAP Net
Interest Income
|
Less: Net
Realized
Losses on
Interest
Rate Hedges
|
Economic Net
Interest
Income (1)
|
||||||||||||||||||||||
|
For the Year Ended December 31, 2013
|
$ | 511,783 | $ | 101,999 | $ | 21,789 | $ | 123,788 | $ | 409,784 | $ | 21,789 | $ | 387,957 | ||||||||||||||
|
For the Year Ended December 31, 2012
|
$ | 589,440 | $ | 126,558 | $ | 20,223 | $ | 146,781 | $ | 462,882 | $ | 20,223 | $ | 442,639 | ||||||||||||||
|
For the Year Ended December 31, 2011
|
$ | 705,024 | $ | 134,858 | $ | 15,929 | $ | 150,787 | $ | 570,166 | $ | 15,929 | $ | 554,223 | ||||||||||||||
|
For the Quarter Ended December 31, 2013
|
$ | 128,062 | $ | 21,485 | $ | 3,887 | $ | 25,372 | $ | 106,577 | $ | 3,887 | $ | 102,682 | ||||||||||||||
|
For the Quarter Ended September 30, 2013
|
$ | 130,361 | $ | 25,074 | $ | 6,981 | $ | 32,055 | $ | 105,287 | $ | 6,981 | $ | 98,302 | ||||||||||||||
|
For the Quarter Ended June 30, 2013
|
$ | 127,565 | $ | 26,611 | $ | 5,391 | $ | 32,002 | $ | 100,954 | $ | 5,391 | $ | 95,551 | ||||||||||||||
|
For the Quarter Ended March 31, 2013
|
$ | 125,795 | $ | 28,829 | $ | 5,530 | $ | 34,359 | $ | 96,966 | $ | 5,530 | $ | 91,422 | ||||||||||||||
|
(1) Excludes interest income on cash and cash equivalents.
|
||||||||||||||||||||||||||||
Economic Net Interest Income
The table below shows our average earning assets held, interest earned on assets, yield on average interest earning assets, average debt balance, economic interest expense, economic average cost of funds, economic net interest income, and net interest rate spread for the periods presented.
|
Average
Earning
Assets Held (1)
|
Interest
Earned on
Assets (1)
|
Yield on
Average
Interest
Earning Assets
|
Average Debt Balance
|
Economic
Interest
Expense (2)
|
Economic
Average Cost
of Funds
|
Economic Net
Interest
Income (1) (2)
|
Net Interest
Rate Spread
|
|||||||||||||||||||||||||
|
(Ratios have been annualized, dollars in thousands)
|
||||||||||||||||||||||||||||||||
|
For The Year Ended December 31, 2013
|
$ | 5,805,591 | $ | 511,745 | 8.81 | % | $ | 3,527,712 | $ | 123,788 | 3.51 | % | $ | 387,957 | 5.30 | % | ||||||||||||||||
|
For The Year Ended December 31, 2012
|
$ | 6,862,452 | $ | 589,420 | 8.59 | % | $ | 4,466,695 | $ | 146,781 | 3.29 | % | $ | 442,639 | 5.30 | % | ||||||||||||||||
|
For the Year Ended December 31, 2011
|
$ | 8,483,420 | $ | 705,010 | 8.31 | % | $ | 5,443,234 | $ | 150,787 | 2.77 | % | $ | 554,223 | 5.54 | % | ||||||||||||||||
|
For The Quarter Ended December 31, 2013
|
$ | 5,667,515 | $ | 128,054 | 9.04 | % | $ | 3,285,584 | $ | 25,372 | 3.09 | % | $ | 102,682 | 5.95 | % | ||||||||||||||||
|
For The Quarter Ended September 30, 2013
|
$ | 5,836,025 | $ | 130,357 | 8.93 | % | $ | 3,360,508 | $ | 32,055 | 3.82 | % | $ | 98,302 | 5.11 | % | ||||||||||||||||
|
For The Quarter Ended June 30, 2013
|
$ | 5,799,179 | $ | 127,553 | 8.80 | % | $ | 3,516,698 | $ | 32,002 | 3.64 | % | $ | 95,551 | 5.16 | % | ||||||||||||||||
|
For The Quarter Ended March 31, 2013
|
$ | 5,866,501 | $ | 125,781 | 8.58 | % | $ | 3,827,635 | $ | 34,359 | 3.59 | % | $ | 91,422 | 4.99 | % | ||||||||||||||||
|
(1) Excludes interest income on cash and cash equivalents.
|
||||||||||||||||||||||||||||||||
|
(2) Includes effect of realized losses on interest rate swaps and US Treasury futures.
|
||||||||||||||||||||||||||||||||
Our economic net interest income declined by $54.7 million for the year ended December 31, 2013 as compared to the same period of 2012. Our net interest spread, which equals the yield on our average assets for this period less the economic average cost of funds for the period did not change for the year ended December 31, 2013 as compared to the same period of 2012.
Our economic net interest income declined by $111.6 million for the year ended December 31, 2012 as compared to the same period of 2011. Our net interest spread decreased by 24 basis points for the year ended December 31, 2012 from the same period of 2011.
Our net interest rate spread on our portfolio is consistent year over year for the year ended December 31, 2013 as compared to the same period of 2012 as the increase in yield on our assets during 2013 was offset by a comparable increase in our cost of funds over the same period. There was no significant change in net interest rate spread as the relative mix of investments between Agency RMBS, Non-Agency RMBS, and residential mortgage loans remained relatively consistent throughout 2013 and 2012. In 2012, we had a decline in net interest rate spread of 24 basis points due to an increase in our cost of funds as we increased the rate of financing using secured debt as compared to repurchase agreements in 2012 as compared to 2011 as we lowered the leverage on our portfolio by reducing our agency holdings and used the proceeds to repay outstanding repurchase agreements or retaining the proceeds as cash, affecting the overall mix of earning assets and debt balances. Generally, our cost of funds on our secured debt is higher than our cost of funds on the repurchase agreements.
69
We expect going forward, that we will increase the leverage on our portfolio and increase our repurchase agreements and investments in both Agency and Non-Agency RMBS to take advantage of market conditions as they become available.
Interest Income and Average Earning Asset Yield
Our average earning assets decreased by $1.1 billion for the year ended December 31, 2013 as compared to the same period of 2012. Our interest earned on assets decreased by $77.7 million for the year ended December 31, 2013 as compared to the same period of 2012. The yield on our average interest earning assets increased by 22 basis points for the years ended December 31, 2013 as compared to the same periods of 2012.
Our average earning assets decreased by $1.6 billion for the year ended December 31, 2012 as compared to the same period of 2011. Our interest earned on assets decreased by $115.6 million for the year ended December 31, 2012 as compared to the same period of 2011. The yield on our average interest earning assets increased by 28 basis points for the year ended December 31 2012 as compared to the same period of 2011.
During 2011 and through most of 2012, we began to deleverage our portfolio by selling Agency RMBS securities. We elected not to reinvest all of the proceeds received on the sales of these securities. In addition, we did not reinvest all principal paydowns received on the retained portfolio. We elected to repay debt and retain cash with the proceeds received from sales and paydowns of our portfolio during this period to be redeployed at a later time. We reduced our earning assets from a high of $9.6 billion during early 2011 to $6.1 billion of earning assets as of December 31, 2012 and further reduced to $5.6 billion as of December 31, 2013. During the second half of 2013, we began to redeploy the cash retained from the sales and paydowns; however, we have not materially increased our leverage during 2013. We expect that we will begin to increase earning assets during 2014 by strategically investing in both Agency and Non-Agency RMBS securities where we determine that favorable opportunities exist. We expect that this will increase our interest earned on assets, however, it may not significantly impact our yield on average interest earning assets.
Economic Interest Expense and the Cost of Funds
The borrowing rate at which we are able to finance our assets using repurchase agreements is typically correlated to LIBOR and the term of the financing. The table below shows our average borrowed funds, economic interest expense, average cost of funds (inclusive of realized losses on interest rate swaps), average one-month LIBOR, average six-month LIBOR, average one-month LIBOR relative to average six-month LIBOR, and average cost of funds relative to average one- and six- month LIBOR.
|
Average Debt Balance
|
Economic
Interest
Expense (1)
|
Average
Cost of
Funds
|
Average
One-Month
LIBOR
|
Average
Six-Month
LIBOR
|
Average
One-Month
LIBOR
Relative to
Average
Six-Month
LIBOR
|
Average Cost
of Funds
Relative to
Average
One-Month
LIBOR
|
Average Cost
of Funds
Relative to
Average
Six-Month
LIBOR
|
|||||||||||||||||||||||||
|
(Ratios have been annualized, dollars in thousands)
|
||||||||||||||||||||||||||||||||
|
For The Year Ended December 31, 2013
|
$ | 3,527,712 | $ | 123,788 | 3.51 | % | 0.19 | % | 0.41 | % | (0.22 | %) | 3.32 | % | 3.10 | % | ||||||||||||||||
|
For The Year Ended December 31, 2012
|
$ | 4,466,695 | $ | 146,781 | 3.29 | % | 0.24 | % | 0.74 | % | (0.49 | %) | 3.05 | % | 2.55 | % | ||||||||||||||||
|
For the Year Ended December 31, 2011
|
$ | 5,443,234 | $ | 150,787 | 2.77 | % | 0.23 | % | 0.51 | % | (0.28 | %) | 2.54 | % | 2.26 | % | ||||||||||||||||
|
For The Quarter Ended December 31, 2013
|
$ | 3,285,584 | $ | 25,372 | 3.09 | % | 0.17 | % | 0.35 | % | (0.18 | %) | 2.92 | % | 2.74 | % | ||||||||||||||||
|
For The Quarter Ended September 30, 2013
|
$ | 3,360,508 | $ | 32,055 | 3.82 | % | 0.19 | % | 0.39 | % | (0.21 | %) | 3.63 | % | 3.42 | % | ||||||||||||||||
|
For The Quarter Ended June 30, 2013
|
$ | 3,516,698 | $ | 32,002 | 3.64 | % | 0.20 | % | 0.42 | % | (0.23 | %) | 3.44 | % | 3.22 | % | ||||||||||||||||
|
For The Quarter Ended March 31, 2013
|
$ | 3,827,635 | $ | 34,359 | 3.59 | % | 0.26 | % | 0.76 | % | (0.51 | %) | 3.33 | % | 2.83 | % | ||||||||||||||||
|
(1) Includes effect of realized losses on interest rate swaps and US Treasury futures.
|
||||||||||||||||||||||||||||||||
Average borrowed funds decreased by $939.0 million for the year ended December 31, 2013 as compared to the same period of 2012. Economic interest expense decreased by $23.0 million for the year ended December 31, 2013 as compared to the same period of 2012. The economic cost of funds increased by 22 basis points for the year ended December 31, 2013 as compared to the same period of 2012.
Average borrowed funds decreased by $976.5 million for the year ended December 31, 2012 as compared to the same period of 2011. Economic interest expense decreased by $4.0 million for the year ended December 31, 2013 as compared to the same period of 2011. The economic cost of funds increased by 52 basis points for the year ended December 31, 2013 as compared to the same period of 2012.
70
The changes in our economic average costs of funds is primarily a result of an increase in the ratio of financing our portfolio using secured debt rather than repurchase agreements as the repurchase agreements generally have a lower interest rate than the secured debt.
The decline in the average debt balances year over year was due to deleveraging the portfolio by using proceeds from repayments on our assets to repay debt balances and strategically selling assets and using these proceeds to reduce our outstanding debt. We expect that in 2014, we will begin to increase our debt balances as we identify favorable opportunities to invest in both Agency and Non-Agency RMBS investments. We expect that this increased leverage will primarily be from increased financing using repurchase agreements; however, if opportunities present themselves, we may use secured debt to finance opportunities that we believe support such a transaction.
Net other-than-temporary credit impairment losses
OTTI losses are generated when fair values decline below our amortized cost basis, an unrealized loss, and the expected future cash flows decline from prior periods, an adverse change. When an unrealized loss and an adverse change in cash flows occur, we will recognize an OTTI loss in earnings. In addition, if we intend to sell a security, or believe we will be required to sell, a security in an unrealized loss position, we will recognize an OTTI loss in earnings equal to the unrealized loss.
OTTI losses have had a significant impact on our financial statements, especially during 2012 where we incurred $132.3 million in OTTI losses and in 2011 where we incurred $357.1 million in losses. In 2013, we noticed a significant decline in OTTI losses from the prior years to $45.2 million in OTTI losses. During 2012 and continuing into 2013, fair values of our Non-Agency RMBS securities showed improvement, reducing the likelihood of an OTTI loss. In additional, default rates have improved during this period, resulting in improved expected future cash flows.
OTTI trends are difficult to predict; however, we expect this improving trend to continue as home prices have rebounded and the general economy has improved. While we do not expect the 2012 or 2011 rates of OTTI to recur in the future, we do expect to regularly have some OTTI in future periods due to our large portfolio of subordinated and low rated Non-Agency RMBS investments. We monitor our portfolio closely to ensure compliance with accounting rules and if cash flows and fair values deteriorate, we will recognize OTTI losses in accordance with GAAP.
In 2013, 84%, or $37.9 million, of our OTTI recognized in earnings was related to the assets from our consolidated VIEs. While these impairments affect our GAAP book, they have no impact on our economic book value as we do not have custody of these assets but rather consolidate them in accordance with GAAP accounting guidance, along with their securitized debt. These balances are eliminated for our economic book value presentation. In 2013, 16%, or $7.3 million, of our OTTI recognized in earnings is related to our subordinated Non-Agency RMBS included in our general portfolio.
Net gains (losses) on derivatives
Our derivative portfolio includes interest rate swaps, Treasury futures, and mortgage options. During the year ended December 31, 2013, we recognized net gains on derivatives of $26.7 million, an increase of $56.4 million over the same period of 2012. During the year ended December 31, 2012, we recognized net losses of $29.7 million, an improvement of $20.7 million over the same period of 2011 were we recognized losses of $50.4 million. These net gains and losses on our derivatives include both unrealized and realized gains and losses. Realized gains and losses include the net cash paid and received on our interest rate swaps during the period as well as sales and settlements of our Treasury futures and mortgage options. Unrealized gains and losses include the change in market value, period over period, on our derivatives portfolio. We may or may not realize these unrealized derivative gains and losses depending on trade activity, changes in interest rates and the value of the underlying security.
Our interest rate swaps and Treasury futures are used to economically hedge the effects of changes in interest rates on our portfolio specifically our floating rate debt. Therefore, we included the realized losses of $21.8 million, $20.2 million and $15.9 million for the years ended December 31, 2013, 2012 and 2011 on these derivatives in our presentation of economic interest expense and economic net interest income in the tables and discussions above. As we do not elect to account for these as hedges for GAAP presentation, we present these gains and losses separately in the consolidated statements of operations and comprehensive income. The realized losses on our interest rate swaps and Treasury futures are primarily due to declines in interest rates year over year.
71
We do not include any gains or losses on our mortgage options in our economic interest expense and economic net interest income as the mortgage options were sold for income generation and not as an economic hedge for changes in interest rates in our portfolio. As we identified opportunities in mortgage backed securities market, we may from time to time purchase or sell mortgage options, including both call and put options to take advantage of these opportunities. The realized gains on our mortgage options for the year ended December 31, 2013 was $10.2 million. We had no mortgage options for the years ended December 31, 2012 or 2011.
Net unrealized gains (losses) on interest-only RMBS and Realized loss on principal write-downs of Non-Agency RMBS
Unrealized gains and losses on our Agency and Non-Agency IO RMBS portfolio represent the change in fair value the security from the prior period. All unrealized gains and losses on our Agency and Non-Agency IO RMBS portfolio are reflected in earnings. During the year ended December 31, 2013, we recorded $44.3 million in unrealized losses on our IO portfolio, an increase of $45.1 million from a small unrealized gain for the year ended December 31, 2012 of less than $1 million. We recognized a $14.5 million loss on IO RMBS investments for the year ended December 31, 2011.
IO securities represent the right to receive the interest on a pool of mortgage backed securities, including both Agency and Non-Agency mortgage pools. The fair value of IO RMBS securities are heavily impacted by changes in expected prepayment rates. When IO securities prepay, the holder of the IO security will receive less interest on the investment due to the reduced principal.
During the year ended December 31, 2013, we realized a loss due to a full principal paydown of a Non-Agency RMBS for which we owned the IO strip. This resulted in a realized loss of $18.3 million and is reflected as a separate line item in the statement of operations and comprehensive income.
Gains and Losses on Sales of Assets
Realized gains on sales of investments decreased by $17.1 million to $68.1 million for the year ended December 31, 2013 from $85.2 million in realized gains for the year ended December 31, 2012. Realized gains on sales of investments increase by $30.8 million for the year ended December 31, 2012 from $54.4 million in realized gains for the year ended December 31, 2011. As we noted above, we had a significant amount of sales in 2013, 2012 and 2011. This included sales of both Agency RMBS and Non-Agency RMBS securities as we deleveraged our portfolio and sold securities for gains when market terms were favorable for the sale of certain investments. We do not forecast sales of investments as we generally expect to invest for long term gains, however, from time to time, we will sell assets to achieve targeted leverage ratios as well as for gains when prices indicate a sale is most beneficial to us, or is the most prudent course of action to maintain a targeted risk adjusted yield for our investors.
Net Management Fees and General and Administrative Expenses
The table below shows our total management fee and general and administrative, or G&A, expenses as compared to average total assets and average equity for the periods presented.
72
|
Total
Management Fee
and G&A
Expenses
|
Total Management
Fee and G&A Expenses/Total
Assets
|
Total Management
Fee and G&A Expenses/Average Equity
|
||||||||||
|
(Ratios have been annualized, dollars in thousands)
|
||||||||||||
|
For The Year Ended December 31, 2013
|
$ | 35,898 | 0.49 | % | 1.04 | % | ||||||
|
For The Year Ended December 31, 2012
|
$ | 58,799 | 0.76 | % | 1.78 | % | ||||||
|
For The Year Ended December 31, 2011
|
$ | 59,236 | 0.75 | % | 1.76 | % | ||||||
|
For The Quarter Ended December 31, 2013
|
$ | 8,965 | 0.51 | % | 1.04 | % | ||||||
|
For The Quarter Ended September 30, 2013
|
$ | 9,112 | 0.51 | % | 1.01 | % | ||||||
|
For The Quarter Ended June 30, 2013
|
$ | 8,380 | 0.46 | % | 0.92 | % | ||||||
|
For The Quarter Ended March 31, 2013
|
$ | 9,441 | 0.50 | % | 1.05 | % | ||||||
We incurred management fees of $19.2 million, $44.8 million and $52.0 million for years ended December 31, 2013, 2012 and 2011, respectively. These incurred management fees are net of reimbursements from our manager of $6.8 million and $4.7 million for the years ended December 31, 2013 and 2012 related to the amended management agreement. The management fee is based on our stockholders’ equity as defined in the investment management agreement. The decrease in the management fee is due to the agreement to lower the management fee until all our SEC filings are current. See further discussion of the management fee, including amendments to the management agreement, as well as other agreements with our Manager in our discussion of related party transactions below. We expect that once we are current on all our SEC filings, the management fees will increase.
G&A expenses were $16.7 million, 14.0 million and $7.3 million for the three years ended December 31, 2013, 2012 and 2011, respectively. Our G&A expenses increased primarily due to increased legal, accounting fees and consulting fees incurred.
Provision for Loan Losses
The provision for loan losses related to our securitized loans held for investment represents managements estimate of expected future losses on the securitized loans held. During the year ended December 31, 2013, we recognized gains from a reduction in the provision of $1.8 million. The change in provision in 2013 is due primarily to a lower general reserve on loans held for investment as the portfolio continues to decline as a result of principal repayments. During the years ended December 31, 2012 and 2011, we recorded additional expense related to the provision for loan losses of $368 thousand and $5.3 million.
Net Income (Loss) and Return on Average Equity
The table below shows our economic net interest income, realized gains (losses) on sale of assets and the credit related OTTI, realized and unrealized gains (losses) on interest rate swaps and IOs, total management fee and G&A expenses, and income tax, each as a percentage of average equity, and the return on average equity for the periods presented.
73
|
Economic Net
Interest
Income/Average
Equity (1)
|
Realized Gains
(Losses) on
Sales and
OTTI/Average
Equity
|
Realized and
Unrealized Gains (Losses) on
Interest Rate
Swaps and
IOs/Average
Equity
|
Total
Management Fee
& G&A Expenses/Average
Equity
|
Income Tax Benefit/Average
Equity
|
Return on
Average
Equity
|
|||||||||||||||||||
|
(Ratios have been annualized)
|
||||||||||||||||||||||||
|
For The Year Ended December 31, 2013
|
11.70 | % | 0.72 | % | (0.29 | %) | (1.04 | %) | 0.00 | % | 10.55 | % | ||||||||||||
|
For The Year Ended December 31, 2012
|
13.44 | % | (1.44 | %) | (0.26 | %) | (1.78 | %) | 0.00 | % | 9.95 | % | ||||||||||||
|
For The Year Ended December 31, 2011
|
16.47 | % | (9.16 | %) | (1.46 | %) | (1.76 | %) | (0.02 | %) | 4.08 | % | ||||||||||||
|
For The Quarter Ended December 31, 2013
|
13.13 | % | (3.12 | %) | 1.55 | % | (1.04 | %) | 0.00 | % | 8.39 | % | ||||||||||||
|
For The Quarter Ended September 30, 2013
|
11.33 | % | 0.27 | % | (3.10 | %) | (1.01 | %) | 0.00 | % | 7.49 | % | ||||||||||||
|
For The Quarter Ended June 30, 2013
|
10.50 | % | 6.14 | % | 0.02 | % | (0.92 | %) | 0.00 | % | 15.73 | % | ||||||||||||
|
For The Quarter Ended March 31, 2013
|
10.17 | % | (0.73 | %) | 0.49 | % | (1.05 | %) | 0.00 | % | 8.87 | % | ||||||||||||
|
(1) Includes effect of realized losses on interest rate swaps and US Treasury futures.
|
||||||||||||||||||||||||
Our net income was $362.7 million, $327.8 million and $137.3 million for the years ended December 31, 2013, 2012 and 2011, respectively. Economic net interest income as a percentage of average equity decreased by 174 basis points for the year ended December 31, 2013 as compared to the same period of 2012 and decreased by 303 basis points for the year ended December 31, 2012 as compared to the same period of 2011. The decline in our economic net interest income as a percentage of average equity is due to the lower interest earned on assets on a lower average earning assets year over year, offset partially by lower economic interest expense on a smaller average debt balance year over year. The return on average equity increased by 60 basis points for the year ended December 31, 2013 as compared to the same period of 2012 and increased by 587 basis points for the year ended December 31, 2012 as compared to the same period of 2011. The increase in our return on average equity is primarily due higher income as a result of lower OTTI from the prior period offset in part by lower net economic interest income.
Liquidity and Capital Resources
General
Liquidity measures our ability to meet cash requirements, including ongoing commitments to repay our borrowings, purchase RMBS, mortgage loans and other assets for our portfolio, pay dividends and other general business needs. Our principal sources of capital and funds for additional investments primarily include earnings from our investments, borrowings under securitizations and re-securitizations, repurchase agreements and other financing facilities, and proceeds from equity offerings.
To meet our short term (one year or less) liquidity needs, we expect to continue to borrow funds in the form of repurchase agreements and, subject to market conditions, other types of financing. The terms of the repurchase transaction borrowings under our master repurchase agreements generally conform to the terms in the standard master repurchase agreement as published by the Securities Industry and Financial Markets Association, or SIFMA, as to repayment, margin requirements and the segregation of all securities we have initially sold under the repurchase transaction. In addition, each lender typically requires that we include supplemental terms and conditions to the standard master repurchase agreement. Typical supplemental terms and conditions include changes to the margin maintenance requirements, cross default provisions, required haircuts (or the percentage that is subtracted from the value of RMBS that collateralizes the financing), purchase price maintenance requirements, and requirements that all disputes related to the repurchase agreement be litigated or arbitrated in a particular jurisdiction. These provisions may differ for each of our lenders.
We also expect to meet our short term liquidity needs by relying on the cash flows generated by our investments. These cash flows are primarily comprised of monthly principal and interest payments received on our investments. We may also sell our investments and utilize those proceeds to meet our short term liquidity needs or enter into non-recourse financing of our assets through sales of securities to third parties of loan securitization or RMBS re-securitization transactions that we have completed in prior periods.
Based on our current portfolio, leverage ratio and available borrowing arrangements, we believe our assets will be sufficient to enable us to meet anticipated short-term liquidity requirements. However, a decline in the value of our collateral could cause a temporary liquidity shortfall due to the timing of margin calls on the financing arrangements and the actual receipt of the cash related to principal paydowns. If our cash resources are at any time insufficient to satisfy our liquidity requirements, we may have to sell investments, potentially at a loss, or issue debt or additional equity securities in a common stock offering.
74
To meet our longer term liquidity needs (greater than one year), we expect our principal sources of capital and funds to continue to be provided by earnings from our investments, borrowings under securitizations and re-securitizations, repurchase agreements and other financing facilities, as well as proceeds from equity offerings. As a result of our failure to file our SEC filings by the filing date required by the SEC (including the grace period permitted by Rule 12b-25 under the Securities Exchange Act of 1934, as amended), we are not eligible to file a new Form S-3 registration statement or use our existing Form S-3 registration statements to raise additional equity capital until filings with the SEC have been timely made for a full year. Our ineligibility to use Form S-3 during this time period will have a negative impact on our ability to quickly access the public capital markets because we would be required to file a long-form registration statement and wait for the SEC to declare such registration statement effective.
In addition to the principal sources of capital described above, we may enter into warehouse facilities and use longer dated structured repurchase agreements. The use of any particular source of capital and funds will depend on market conditions, availability of these facilities, and the investment opportunities available to us.
Current Period
We held cash and cash equivalents of approximately $77.6 million and $621.2 million at December 31, 2013 and 2012, respectively.
Our operating activities provided net cash of approximately $304.8 million, $334.9 million and $447.7 for the years ended December 31, 2013, 2012 and 2011, respectively. The cash provided by operating activities decreased for the year ended December 31, 2013 as compared to the year ended December 31, 2012 due primarily to a decrease in interest collected on the portfolio, net of interest paid, of $60.8 million, offset in part by lower management fees paid during 2013 as compared to the same period of 2012 of $23.6 million. The cash provided by operating activities decreased for the year ended December 31, 2012 when compared to the year ended December 31, 2011 due primarily to a decrease in net interest income earned on the portfolio of $109.7 million year over year.
Our investing activities provided net cash of approximately $305.1 million and 988.8 million for the years ended December 31, 2013 and 2012, respectively, and used cash of $114.1 million for the year ended December 31, 2011. During the year ended December 31, 2013 we generated cash from sales of RMBS investments of $1.2 billion and principal payments of $1.5 billion related to all our investment assets offset by purchases of $2.4 billion in RMBS securities. During the year ended December 31, 2012 we generated cash from sales of RMBS investments of $943.4 million and principal payments of $1.7 billion related to all our investment assets offset by purchases of $124.2 million in RMBS securities and $1.5 billion in jumbo prime residential mortgage loans. During the year ended December 31, 2011 we utilized cash to purchase $4.2 billion in securities which were offset by proceeds from asset sales of $2.6 billion and principal payments of $1.4 billion.
Our financing activities used net cash of $1.2 billion, $908.9 million and $134.5 million for the years ended December 31, 2013, 2012 and 2011, respectively. The year ended December 31, 2013 reflected payments on securitized debt borrowings of $914.2 million, payment of dividends of $369.7 million and proceeds from repurchase agreements, net of payments on repurchase agreements, of $130.5 million. The year ended December 31, 2012 reflected payments on repurchase agreements, net of proceeds from repurchase agreements, of $1.1 billion, payments on securitized debt borrowings of $952.3 million and payments of dividends during the year of $410.7 million. These uses of cash were offset in part by proceeds received from the issuance of securitized debt of $1.6 billion. The year ended December 31, 2011 reflected net payments on securitized debt borrowings of $725.8 million and payments of dividends during the year of $585.0 million. These uses of cash were offset in party by proceeds received from repurchase agreements, net of payments on repurchase agreements, of $864.2 million and proceeds from securitized debt borrowings of $311.0 million.
As a result of our operating, investing and financing activities described above, our cash position has declined from $621.2 million at December 31, 2012 to $77.6 million at December 31, 2013. While we accumulated cash during 2011 and 2012 as a result of the delays in timely filing with the SEC, we have recently begun to redeploy this cash into investments in both Agency and Non-Agency RMBS investments. We note that our investments in Non-Agency RMBS and Agency RMBS, at fair value, increased by $296.8 million during the year ended December 31, 2013. While our cash balance has declined year over year, we believe that we maintain an appropriate level of liquidity, including $260.2 million of highly liquid Agency RMBS investments which are currently not pledged as collateral for our financing arrangements. Even though we have significant unrestricted Agency RMBS investments, we expect to meet our future cash needs primarily from principal and interest payments on our portfolio and do not anticipate we will need to sell unrestricted Agency RMBS investments to meet our liquidity needs.
75
There were no secondary stock offerings during the years ended December 31, 2013, 2012 and 2011, respectively. There were securitized debt borrowings from CSMC 2012 - CIM1, CSMC 2012 - CIM2 and CSMC 2012 - CIM3 during 2012. Recourse leverage increased to 0.5:1 at December 31, 2013 as compared to 0.4:1 at December 31, 2012.
As we begin to file our SEC financials in a timelier manner, we expect to increase our recourse leverage as we finance additional purchases of Agency and Non-Agency RMBS through the deployment of proceeds received from principal and interest on our portfolio as well as increasing our financing, primarily through repurchase agreements.
We expect to continue to finance our RMBS portfolio largely through repurchase agreements and loans through the securitization market. In addition, we may from time to time sell securities or issue debt as a source of cash to fund new purchases.
At December 31, 2013 and 2012, the remaining maturities on our RMBS repurchase agreements were as follows.
|
December 31, 2013
|
December 31, 2012
|
|||||||
|
(dollars in thousands)
|
||||||||
|
Overnight
|
$ | - | $ | - | ||||
|
1-29 days
|
644,332 | 732,809 | ||||||
|
30 to 59 days
|
606,945 | 325,915 | ||||||
|
60 to 89 days
|
- | - | ||||||
|
90 to 119 days
|
129,049 | 211,137 | ||||||
|
Greater than or equal to 120 days
|
278,235 | 258,164 | ||||||
|
Total
|
$ | 1,658,561 | $ | 1,528,025 | ||||
We collateralize the repurchase agreements we use to finance our operations with our RMBS investments. Our counterparties negotiate a ‘haircut’ when we enter into a financing transaction, which varies from lender to lender. The size of the haircut reflects the perceived risk associated with holding the RMBS by the lender. The haircut provides lenders with a cushion for daily market value movements that reduce the need for a margin call to be issued or margin to be returned as normal daily increases or decreases in RMBS market values occur. At December 31, 2013, the weighted average haircut on our repurchase agreements was 4.79%. Despite the haircut, repurchase agreements subject us to two types of margin calls. First, there are monthly margin calls that are triggered as principal payments and pre-payments are received by us as these payments lower the value of the collateral. As a result, we expect to receive margin calls from our repurchase counterparties monthly simply due to the principal paydowns on our Agency RMBS. The monthly principal payments and pre-payments are not known in advance and vary depending on the behavior of the borrowers related to the underlying mortgages. Second, counterparties make margin calls or return margin as a result of normal daily increases or decreases in asset fair values. In addition, when financing assets using standard form of SIFMA Master Repurchase Agreements, the counterparty to the agreement typically nets its exposure to us on all outstanding repurchase agreements and issues margin calls if movement of the fair values of the assets in the aggregate exceeds their allowable exposure to us. A decline in asset fair values could create a margin call, or may create no margin call depending on the counterparty’s specific policy. In addition, counterparties consider a number of factors, including their aggregate exposure to us as a whole and the number of days remaining before the repurchase transaction closes prior to issuing a margin call. See Note 5 to our Consolidated Financial Statements for a discussion on how we determine the fair values of the RMBS collateralizing our repurchase agreements.
The table below presents our average daily repurchase balance and the repurchase balance at each period end for the periods presented. Our balance at period-end tends to have little fluctuation from the average daily balances except in periods where we are adjusting the size of our portfolio by using leverage. Our average repurchase agreement balance at December 31, 2013 decreased compared to our average repurchase agreement balance for the quarter ended December 31, 2012 due to net repayments of our repurchase agreements financed from the sales of Agency RMBS during 2013. The Company continues to deploy capital for strategic purchases of investments.
76
|
Period
|
Average
Repurchase
Balance
|
Repurchase
Balance at
Period End
|
||||||
|
(dollars in thousands)
|
||||||||
|
Year Ended December 31, 2013
|
$ | 1,480,666 | $ | 1,658,561 | ||||
|
Year Ended December 31, 2012
|
$ | 2,122,421 | $ | 1,528,025 | ||||
|
Quarter Ended December 31, 2013
|
$ | 1,574,872 | $ | 1,658,561 | ||||
|
Quarter Ended September 30, 2013
|
$ | 1,464,677 | $ | 1,589,325 | ||||
|
Quarter Ended June 30, 2013
|
$ | 1,422,485 | $ | 1,478,141 | ||||
|
Quarter Ended March 31, 2013
|
$ | 1,460,629 | $ | 1,420,375 | ||||
We are not required to maintain any specific debt-to-equity ratio. We believe the appropriate leverage for the particular assets we are financing depends on the credit quality and risk of those assets. At December 31, 2013 and 2012 our total debt was approximately $3.3 billion and $4.0 billion, which represented a debt-to-equity ratio of approximately 1.0:1 and 1.1:1, respectively. We include repurchase agreements and securitized debt in the numerator of our debt-to-equity ratio and stockholders’ equity as the denominator.
We do not manage our portfolio to have a pre-designated amount of borrowings at quarter-end or year-end. Our borrowings at period end are a snapshot of borrowing as of a date, and this number should be expected to differ from average borrowings over the period. Our borrowings will change as we implement our portfolio and risk management strategies to address changing market conditions by increasing or decreasing leverage. Our borrowings may change during periods when we raise capital, and in certain instances we may purchase additional assets and increase borrowings prior to an expected capital raise. Since our average borrowings and period end borrowings can be expected to differ, we believe our average borrowings during a period provide a more accurate representation of our exposure to the risks associated with leverage.
Secured Debt Financing Transactions
We did not re-securitize any RMBS or jumbo prime residential mortgage loans during the year ended December 31, 2013. During the year ended December 31, 2012, we financed the purchase of $1.5 billion of jumbo prime residential mortgage loans by securitizing and selling senior bonds to third party investors for net proceeds of $1.4 billion. We retained the subordinate tranches of the securitization. We did not re-securitize RMBS or jumbo prime residential mortgage loans during the year ended December 31, 2011.
Exposure to European Financial Counterparties
A significant portion of our Agency RMBS is financed with repurchase agreements. We secure our borrowings under these agreements by pledging our Agency RMBS as collateral to the lender. The collateral we pledge exceeds the amount of the borrowings under each agreement, typically with the extent of over-collateralization being at least 3% of the amount borrowed. If the counterparty to the repurchase agreement defaults on its obligations and we are not able to recover our pledged assets, we are at risk of losing the over-collateralized amount. The amount of this exposure is the difference between the amount loaned to us plus interest due to the counterparty and the fair value of the collateral pledged by us to the lender including accrued interest receivable on such collateral.
We also use interest rate swaps to manage our interest rate risks. Under these swap agreements, we pledge Agency RMBS as collateral as part of a margin arrangement for interest rate swaps that are in an unrealized loss position. If a swap counterparty were to default on its obligation, we would be exposed to a loss to the extent that the amount of our Agency RMBS pledged exceeded the unrealized loss on the associated swaps and we were not able to recover the excess collateral.
77
Over the past several years, several large European financial institutions have experienced financial difficulty and have been either rescued by government assistance or by other large European banks or institutions. Some of these financial institutions or their U.S. subsidiaries have provided us financing under repurchase agreements or we have entered into interest rate swaps with such institutions. We have entered into repurchase agreements and/or interest rate swaps with six counterparties as of December 31, 2013 that are either domiciled in Europe or are a U.S.-based subsidiary of a European-domiciled financial institution. The following table summarizes our exposure to such counterparties at December 31, 2013:
|
Country
|
Number of
Counterparties
|
Repurchase
Agreement
Financing
|
Interest Rate Swaps
at Fair Value
|
Exposure (1)
|
Exposure as a
Percentage of
Total Assets
|
|||||||||||||||
|
(dollars in thousands)
|
||||||||||||||||||||
|
France
|
1 | $ | 202,189 | $ | - | $ | 9,449 | 0.14 | % | |||||||||||
|
Germany
|
1 | - | (8,383 | ) | 2,143 | 0.03 | % | |||||||||||||
|
Netherlands
|
1 | 221,037 | - | 10,515 | 0.15 | % | ||||||||||||||
|
Switzerland
|
2 | 317,002 | (21,816 | ) | 23,112 | 0.33 | % | |||||||||||||
|
United Kingdom
|
1 | 192,902 | - | 4,673 | 0.07 | % | ||||||||||||||
|
Total
|
6 | $ | 933,130 | $ | (30,199 | ) | $ | 49,892 | 0.72 | % | ||||||||||
|
(1) Represents the amount of securities pledged as collateral to each counterparty less the aggregate of repurchase agreement financing and unrealized loss on swaps for each counterparty.
|
||||||||||||||||||||
At December 31, 2013, we did not use credit default swaps or other forms of credit protection to hedge the exposures summarized in the table above.
If the European credit crisis continues to impact these major European financial institutions, it is possible that it will also impact the operations of their U.S. subsidiaries. Our financings and operations could be adversely affected by such events. We monitor our exposure to our repurchase agreement and swap counterparties on a regular basis, using various methods, including review of recent rating agency actions, financial relief plans, credit spreads or other developments and by monitoring the amount of cash and securities collateral pledged and the associated loan amount under repurchase agreements and/or the fair value of swaps with our counterparties. We make reverse margin calls on our counterparties to recover excess collateral as permitted by the agreements governing our financing arrangements or interest rate swaps, or may try to take other actions to reduce the amount of our exposure to a counterparty when necessary.
Stockholders’ Equity
On January 28, 2011, we entered into an equity distribution agreement with FIDAC and UBS Securities LLC, or UBS. Through this agreement, we may sell through UBS, as our sales agent, up to 125,000,000 shares of our common stock in ordinary brokers’ transactions at market prices or other transactions as agreed between us and UBS. We did not sell any shares of our common stock under the equity distribution agreement during the years ended December 31, 2013 or 2012.
On September 24, 2009, we implemented a Dividend Reinvestment and Share Purchase Plan, or DRSPP. The DRSPP provided holders of record of our common stock an opportunity to automatically reinvest all or a portion of their cash distributions received on common stock in additional shares of our common stock as well as to make optional cash payments to purchase shares of our common stock. The DRSPP was administered by the Administrator, Computershare. The DRSPP was suspended when we were no longer current on our filings beginning in the second quarter of 2012. During the quarter ended March 31, 2012 we raised $117 thousand by issuing 39,000 shares through the DRSPP.
As a result of our failure to file our SEC filings by the filing date required by the SEC (including the grace period permitted by Rule 12b-25 under the Securities Exchange Act of 1934, as amended), we will not be able to issue shares of our common stock under the equity distribution agreement or DRSPP until filings with the SEC have been timely made for a full year.
During the year ended December 31, 2013 we declared dividends to common shareholders totaling $575.2 million, or $0.56 per share. During the year ended December 31, 2012, we declared dividends to common shareholders totaling $390.2 million, or $0.38 per share.
78
The Board of Directors declared and paid a dividend of $0.09 per share for the first quarter of 2014. The Board of Directors has determined that there will be a quarterly dividend of $0.09 per share for the second, third and fourth quarters of 2014.
There was no preferred stock issued or outstanding as of December 31, 2013 and 2012.
Related Party Transactions
The Management Agreement
On November 15, 2007 we entered into a management agreement with FIDAC, which provided for an initial term through December 31, 2010 with an automatic one-year extension option and subject to certain termination rights. In 2011 and 2010, we paid to our Manager a quarterly management fee equal to 1.50% per annum of our gross Stockholders’ Equity (as defined in the management agreement). Effective November 28, 2012, the management fee was reduced to 0.75% per annum of gross Stockholders’ Equity, which reduction will remain in effect until we are current on all of our filings required under applicable securities laws.
We are obligated to reimburse our Manager for its costs incurred under the management agreement. In addition, the management agreement permits our Manager to require us to pay for its pro rata portion of rent, telephone, utilities, office furniture, equipment, machinery and other office, internal and overhead expenses that our Manager incurred in connection with our operations. These expenses are allocated between our Manager and us based on the ratio of the proportion of gross assets compared to the gross assets managed by our Manager as calculated at each quarter end. Together we will modify this allocation methodology, subject to the approval of our board of directors if the allocation becomes inequitable (i.e., if we become very highly leveraged compared to our Manager’s other funds and accounts).
March 2013 Amendment to Management Agreement
Because of the Restatement Filing, on March 8, 2013 we amended the management agreement. In the amendment, we memorialized the reduction in the management fee effective on November 28, 2012. Additionally, our Manager agreed to pay all past and future expenses that we and/or our Audit Committee incur to: (1) evaluate our accounting policy related to the application of GAAP to our Non-Agency RMBS portfolio (the Evaluation); (2) restate our financial statements for the period covering 2008 through 2011 as a result of the Evaluation (the Restatement Filing); and (3) investigate and evaluate any shareholder derivative demands arising from the Evaluation and/or the Restatement Filing (the Investigation); provided, however, that our Manager’s obligation to pay expenses applies only to expenses not paid by our insurers under our insurance policies. Expenses shall include, without limitation, fees and costs incurred with respect to auditors, outside counsel, and consultants engaged by us and/or our Audit Committee for the Evaluation, Restatement Filing and the Investigation.
The amended management agreement is automatically renewed for a one-year term on each anniversary date, although two-thirds of the independent directors or the holders of a majority of the outstanding shares of common stock (other than those held by Annaly or its affiliates) may elect to terminate the management agreement upon 30 days notice at any time in their sole discretion without the payment of a termination fee. Additionally, we may terminate the management agreement effective immediately if (i) our Manager engages in any act of fraud, misappropriation of funds, or embezzlement against the us, (ii) there is an event of any gross negligence on the part of our Manager in the performance of its duties under the management agreement, (iii) there is a commencement of any proceeding relating to our Manager’s bankruptcy or insolvency, (iv) there is a dissolution of our Manager, or (v) our Manager is convicted of (including a plea of nolo contendere) a felony.
Fees Paid Under the Management Agreement
The fees paid under the management agreement are detailed in the results of operations discussion above. In addition to these fees, our manager received expense reimbursement under the management agreement of $493 thousand, $447 thousand and $625 thousand for the years ended December 31, 2013, 2012 and 2011, respectively. Our Manager uses the proceeds from its management fee in part to pay compensation to its officers and employees who, notwithstanding that certain of them also are our officers, receive no cash compensation directly from us.
79
Clearing Fees
On March 1, 2011, we entered into an administrative services agreement with RCap Securities, Inc., or RCap. We use RCap, a SEC registered broker-dealer and a wholly-owned subsidiary of Annaly, to clear trades for us and RCap is paid customary fees in return for such services. RCap may also provide brokerage services to us from time to time. During the years ended December 31, 2013, 2012 and 2011, fees paid to RCap were $145 thousand, $138 thousand and $162 thousand, respectively.
Restricted Stock Grants
We granted 1,301,000 shares of restricted stock to employees of our Manager and its affiliates and members of our board of directors on January 2, 2008. During the years ended December 31, 2013 and 2012, 140,000 and 172,000 shares of restricted stock vested, respectively. During the years ended December 31, 2013 and 2012, 70,000 and 20,000 shares were forfeited, respectively. At December 31, 2013 and 2012, there were approximately 384,000 and 586,000 unvested shares of restricted stock issued to employees of FIDAC, respectively. For the years ended December 31, 2013, 2012 and 2011, compensation expense associated with the amortization of the fair value of the restricted stock was approximately $418 thousand, $449 thousand and $451 thousand, respectively.
Contractual Obligations and Commitments
The following tables summarize our contractual obligations at December 31, 2013 and 2012. The estimated principal repayment schedule of the securitized debt is based on expected cash flows of the residential mortgage loans or RMBS, as adjusted for expected principal writedowns on the underlying collateral of the debt.
|
December 31, 2013
|
||||||||||||||||||||
|
(dollars in thousands)
|
||||||||||||||||||||
|
Contractual Obligations
|
Within One
Year
|
One to Three
Years
|
Three to Five
Years
|
Greater Than
or Equal to
Five Years
|
Total
|
|||||||||||||||
|
Repurchase agreements for RMBS
|
$ | 1,658,561 | $ | - | $ | - | $ | - | $ | 1,658,561 | ||||||||||
|
Securitized debt
|
370,250 | 497,943 | 264,456 | 396,916 | 1,529,565 | |||||||||||||||
|
Interest expense on RMBS repurchase agreements (1)
|
2,380 | - | - | - | 2,380 | |||||||||||||||
|
Interest expense on securitized debt (1)
|
57,546 | 80,446 | 58,620 | 178,391 | 375,003 | |||||||||||||||
|
Total
|
$ | 2,088,737 | $ | 578,389 | $ | 323,076 | $ | 575,307 | $ | 3,565,509 | ||||||||||
|
(1) Interest is based on variable rates in effect as of December 31, 2013.
|
||||||||||||||||||||
|
December 31, 2012
|
||||||||||||||||||||
|
(dollars in thousands)
|
||||||||||||||||||||
|
Contractual Obligations
|
Within One
Year
|
One to Three
Years
|
Three to Five
Years
|
Greater Than
or Equal to
Five Years
|
Total
|
|||||||||||||||
|
Repurchase agreements for RMBS
|
$ | 1,528,025 | $ | - | $ | - | $ | - | $ | 1,528,025 | ||||||||||
|
Securitized debt
|
658,423 | 793,150 | 430,993 | 555,717 | 2,438,283 | |||||||||||||||
|
Interest expense on RMBS repurchase agreements (1)
|
3,481 | 5 | - | - | 3,486 | |||||||||||||||
|
Interest expense on securitized debt (1)
|
88,177 | 113,931 | 72,902 | 201,721 | 476,731 | |||||||||||||||
|
Total
|
$ | 2,278,106 | $ | 907,086 | $ | 503,895 | $ | 757,438 | $ | 4,446,525 | ||||||||||
|
(1) Interest is based on variable rates in effect as of December 31, 2012.
|
||||||||||||||||||||
Off-Balance Sheet Arrangements
We do not have any relationships with unconsolidated entities or financial partnerships, such as entities often referred to as structured finance or special purpose entities, which would have been established for the purpose of facilitating off-balance sheet arrangements or other contractually narrow or limited purposes. Further, we have not guaranteed any obligations of unconsolidated entities nor do we have any commitment or intent to provide funding to any such entities.
80
Capital Requirements
At December 31, 2013 and 2012, we had no material commitments for capital expenditures.
Dividends
To qualify as a REIT, we must pay annual dividends to our stockholders of at least 90% of our taxable income (subject to certain adjustments). We intend to pay regular quarterly dividends to our stockholders. Before we pay any dividend, we must first meet any operating requirements and scheduled debt service on our financing facilities and other debt payable.
Inflation
A significant portion of our assets and liabilities are interest rate sensitive in nature. As a result, interest rates and other factors influence our performance far more so than does inflation. Changes in interest rates do not necessarily correlate with inflation rates or changes in inflation rates. Our consolidated financial statements are prepared in accordance with GAAP and our distributions will be determined by our board of directors consistent with our obligation to distribute to our stockholders at least 90% of our REIT taxable income on an annual basis in order to maintain our REIT qualification; in each case, our activities and financial condition are measured with reference to historical cost and/or fair market value without considering inflation.
Other Matters
We at all times intend to conduct our business so as not to become regulated as an investment company under the 1940 Act. If we were to become regulated as an investment company, our ability to use leverage would be substantially reduced.
Section 3(a)(1)(C) of the Investment Company Act defines an investment company as any issuer that is engaged or proposes to engage in the business of investing, reinvesting, owning, holding or trading in securities and owns or proposes to acquire investment securities having a value exceeding 40% of the value of the issuer’s total assets (exclusive of U.S. Government securities and cash items) on an unconsolidated basis (the “40% test”). Excluded from the term “investment securities,” among other things, are securities issued by majority-owned subsidiaries that rely on the exemption from registration provided by Section 3(c)(5)(C) of the Investment Company Act.
Certain of our subsidiaries, including Chimera Asset Holding LLC and certain subsidiaries that we may form in the future, rely on the exemption from registration provided by Section 3(c)(5)(C) of the Investment Company Act. Section 3(c)(5)(C), as interpreted by the staff of the Securities and Exchange Commission (or the SEC), requires us to invest at least 55% of our assets in “mortgages and other liens on and interest in real estate” (or Qualifying Real Estate Assets) and at least 80% of our assets in Qualifying Real Estate Assets plus real estate related assets. The assets that we acquire, therefore, are limited by the provisions of and the rules and regulations promulgated under the Investment Company Act.
On August 31, 2011, the SEC issued a concept release titled “Companies Engaged in the Business of Acquiring Mortgages and Mortgage-Related Instruments” (SEC Release No. IC-29778). Under the concept release, the SEC is reviewing interpretive issues related to the Section 3(c)(5)(C) exemption. We are monitoring developments related to this matter.
Based on our calculations, as of December 31, 2013 and 2012, we were in compliance with the exemption from registration provided by Section 3(c)(5)(C) and 3(a)(1)(C) of the Investment Company Act.
81
As a result of the Dodd-Frank Wall Street Reform and Consumer Protection Act of 2010, the U.S. Commodity Futures Trading Commission, or CFTC, gained jurisdiction over the regulation of interest rate swaps. The CFTC has asserted that this causes the operators of mortgage real estate investment trusts that use swaps as part of their business model to fall within the statutory definition of Commodity Pool Operator, or CPO, and, absent relief from the Division or the Commission, to register as CPOs. On December 7, 2012, as a result of numerous requests for no-action relief from the CPO registration requirement for operators of mortgage real estate investment trusts, the Division of Swap Dealer and Intermediary Oversight of the CFTC issued no-action relief entitled “No-Action Relief from the Commodity Pool Operator Registration Requirement for Commodity Pool Operators of Certain Pooled Investment Vehicles Organized as Mortgage Real Estate Investment Trusts” that permits a CPO to receive relief by filing a claim to perfect the use of the relief. A claim submitted by a CPO will be effective upon filing, so long as the claim is materially complete. The conditions that must be met to claim the relief are that the mortgage real estate investment trust must:
|
●
|
Limit the initial margin and premiums required to establish its commodity interest positions to no more than five percent of the fair market value of the mortgage real estate investment trust’s total assets;
|
|
●
|
Limit the net income derived annually from its commodity interest positions that are not qualifying hedging transactions to less than five percent of the mortgage real estate investment trust’s gross income;
|
|
●
|
Ensure that interests in the mortgage real estate investment trust are not marketed to the public as or in a commodity pool or otherwise as or in a vehicle for trading in the commodity futures, commodity options, or swaps markets; and
|
|
●
|
Either:
|
|
o
|
identify itself as a “mortgage REIT” in Item G of its last U.S. income tax return on Form 1120-REIT; or
|
|
o
|
if it has not yet filed its first U.S. income tax return on Form 1120-REIT, disclose to its shareholders that it intends to identify itself as a “mortgage REIT” in its first U.S. income tax return on Form 1120-REIT
|
While we disagree that the CFTC’s position that mortgage real estate investment trusts that use swaps as part of their business model fall within the statutory definition of a CPO, we have submitted a claim for the relief set forth in the no-action relief entitled “No-Action Relief from the Commodity Pool Operator Registration Requirement for Commodity Pool Operators of Certain Pooled Investment Vehicles Organized as Mortgage Real Estate Investment Trusts” and believe we meet the criteria for such relief set forth therein.
Item 7a. Quantitative and Qualitative Disclosures about Market Risk
The primary components of our market risk are related to credit risk, interest rate risk, prepayment risk, market value risk and real estate risk. While we do not seek to avoid risk completely, we believe the risk can be quantified from historical experience and we seek to actively manage that risk, to earn sufficient compensation to justify taking those risks and to maintain capital levels consistent with the risks we undertake.
Credit Risk
We are subject to credit risk in connection with our investments in Non-Agency RMBS and residential mortgage loans and face more credit risk on assets we own which are rated below ‘‘AAA’’. The credit risk related to these investments pertains to the ability and willingness of the borrowers to pay, which is assessed before credit is granted or renewed and periodically reviewed throughout the loan or security term. We believe that residual loan credit quality, and thus the quality of our assets, is primarily determined by the borrowers’ credit profiles and loan characteristics. We use a comprehensive credit review process. Our analysis of loans includes borrower profiles, as well as valuation and appraisal data. We use compensating factors such as liquid assets, low loan to value ratios and regional unemployment statistics in evaluating loans. Our resources include a proprietary portfolio management system, as well as third party software systems. We may utilize a third party due diligence firm to perform an independent underwriting review to ensure compliance with existing guidelines. In addition to statistical sampling techniques, we create adverse credit and valuation samples, which we individually review. We reject loans that fail to conform to our standards and do not meet our underwriting criteria. Once we own a loan, our surveillance process includes ongoing analysis through our proprietary data and servicer files. Additionally, the Non-Agency RMBS and other ABS which we acquire for our portfolio are reviewed by us to ensure that they satisfy our risk based criteria. Our review of Non-Agency RMBS and other ABS includes utilizing a proprietary portfolio management system. Our review of Non-Agency RMBS and other ABS is based on quantitative and qualitative analysis of the risk-adjusted returns on Non-Agency RMBS and other ABS. This analysis includes an evaluation of the collateral characteristics supporting the RMBS such as borrower payment history, credit profiles, geographic concentrations, credit enhancement, seasoning, and other pertinent factors.
82
Interest Rate Risk
Interest rate risk is highly sensitive to many factors, including governmental, monetary and tax policies, domestic and international economic and political considerations and other factors beyond our control. We are subject to interest rate risk in connection with our investments and our related debt obligations, which are generally repurchase agreements, warehouse facilities and securitization/re-securitization vehicles. Our repurchase agreements and warehouse facilities may be of limited duration that is periodically refinanced at current market rates. We intend to mitigate this risk through utilization of derivative contracts, primarily interest rate swap agreements, swaptions, futures and mortgage options.
Interest Rate Effects on Net Interest Income
Our operating results depend, in large part, on differences between the income from our investments and our borrowing costs. Most of our warehouse facilities and repurchase agreements provide financing based on a floating rate of interest calculated on a fixed spread over LIBOR. The fixed spread varies depending on the type of underlying asset which collateralizes the financing. Accordingly, the portion of our portfolio which consists of floating interest rate assets will be match-funded utilizing our expected sources of short-term financing, while our fixed interest rate assets will not be match-funded. During periods of rising interest rates, the borrowing costs associated with our investments tend to increase while the income earned on our fixed interest rate investments may remain substantially unchanged. This will result in a narrowing of the net interest spread between the related assets and borrowings and may even result in losses. Further, during this portion of the interest rate and credit cycles, defaults could increase and result in credit losses to us, which could adversely affect our liquidity and operating results. Such delinquencies or defaults could also have an adverse effect on the spread between interest-earning assets and interest-bearing liabilities. Hedging techniques are partly based on assumed levels of prepayments of our fixed-rate and hybrid adjustable-rate mortgage loans and RMBS. If prepayments are slower or faster than assumed, the life of the mortgage loans and RMBS will be longer or shorter, which would reduce the effectiveness of any hedging strategies we may use and may cause losses on such transactions.
Interest Rate Effects on Fair Value
Another component of interest rate risk is the effect changes in interest rates will have on the fair value of the assets we acquire. We face the risk that the fair value of our assets will increase or decrease at different rates than that of our liabilities, including our hedging instruments. We primarily assess our interest rate risk by estimating the duration of our assets and the duration of our liabilities. Duration essentially measures the market price volatility of financial instruments as interest rates change. We generally calculate duration using various financial models and empirical data. Different models and methodologies can produce different duration numbers for the same securities.
It is important to note that the impact of changing interest rates on fair value can change significantly when interest rates change beyond 100 basis points from current levels. Therefore, the volatility in the fair value of our assets could increase significantly when interest rates change beyond 100 basis points. In addition, other factors impact the fair value of our interest rate-sensitive investments and hedging instruments, such as the shape of the yield curve, market expectations as to future interest rate changes and other market conditions. Accordingly, in the event of changes in actual interest rates, the change in the fair value of our assets would likely differ from that shown below and such difference might be material and adverse to our stockholders.
Interest Rate Cap Risk
We also invest in adjustable-rate mortgage loans and RMBS. These are mortgages or RMBS in which the underlying mortgages are typically subject to periodic and lifetime interest rate caps and floors, which limit the amount by which the security’s interest yield may change during any given period. However, our borrowing costs pursuant to our financing agreements will not be subject to similar restrictions. Therefore, in a period of increasing interest rates, interest rate costs on our borrowings could increase without limitation by caps, while the interest-rate yields on our adjustable-rate mortgage loans and RMBS would effectively be limited. This problem will be magnified to the extent we acquire adjustable-rate RMBS that are not based on mortgages which are fully indexed. In addition, the mortgages or the underlying mortgages in an RMBS may be subject to periodic payment caps that result in some portion of the interest being deferred and added to the principal outstanding. This could result in our receipt of less cash income on our adjustable-rate mortgages or RMBS than we need in order to pay the interest cost on our related borrowings. These factors could lower our net interest income or cause a net loss during periods of rising interest rates, which would harm our financial condition, cash flows and results of operations.
83
Interest Rate Mismatch Risk
We fund a substantial portion of our acquisitions of RMBS with borrowings that, after the effect of hedging, have interest rates based on indices and re-pricing terms similar to, but of somewhat shorter maturities than, the interest rate indices and re-pricing terms of the mortgages and RMBS. In most cases the interest rate indices and re-pricing terms of our mortgage assets and our funding sources will not be identical, thereby creating an interest rate mismatch between assets and liabilities. Our cost of funds would likely rise or fall more quickly than would our earnings rate on assets. During periods of changing interest rates, such interest rate mismatches could negatively impact our financial condition, cash flows and results of operations. To mitigate interest rate mismatches, we may utilize the hedging strategies discussed above. Our analysis of risks is based on FIDAC’s experience, estimates, models and assumptions. These analyses rely on models which utilize estimates of fair value and interest rate sensitivity. Actual economic conditions or implementation of investment decisions by our management may produce results that differ significantly from the estimates and assumptions used in our models and the projected results shown in this Form 10-K.
Our profitability and the value of our portfolio (including interest rate swaps) may be adversely affected during any period as a result of changing interest rates. The following table quantifies the potential changes in net interest income and portfolio value for our Agency RMBS portfolio should interest rates go up or down 25, 50, and 75 basis points, assuming parallel movements in the yield curves. All changes in income and value are measured as percentage changes from the projected net interest income and portfolio value at the base interest rate scenario. The base interest rate scenario assumes interest rates at December 31, 2013 and various estimates regarding prepayment and all activities are made at each level of rate change. Actual results could differ significantly from these estimates.
|
December 31, 2013
|
||
|
Change in Interest Rate
|
Projected Percentage
Change in Net Interest
Income (1)
|
Projected Percentage
Change in Portfolio Value
with Effect of Interest Rate Swaps (2)
|
|
-75 Basis Points
|
(6.84%)
|
2.49%
|
|
-50 Basis Points
|
(4.22%)
|
1.76%
|
|
-25 Basis Points
|
(1.81%)
|
0.93%
|
|
Base Interest Rate
|
0.00%
|
0.00%
|
|
+25 Basis Points
|
1.22%
|
(1.03%)
|
|
+50 Basis Points
|
1.71%
|
(2.10%)
|
|
+75 Basis Points
|
1.76%
|
(3.23%)
|
|
(1) Change in annual economic net interest income. Includes interest expense on interest rate swaps.
|
||
|
(2) Projected Percentage Change in Portfolio Value is based on instantaneous moves in interest rates.
|
||
Prepayment Risk
As we receive prepayments of principal on these investments, premiums and discounts on such investments will be amortized or accreted into interest income. In general, an increase in prepayment rates will accelerate the amortization of purchase premiums, thereby reducing the interest income earned on the investments. Conversely, discounts on such investments are accelerated and accreted into interest income increasing interest income.
84
Extension Risk
Our Manager computes the projected weighted-average life of our investments based on assumptions regarding the rate at which the borrowers will prepay the underlying mortgages. In general, when fixed-rate or hybrid adjustable-rate mortgage loans or RMBS are acquired via borrowings, we may, but are not required to, enter into an interest rate swap agreement or other hedging instrument that effectively fixes our borrowing costs for a period close to the anticipated average life of the fixed-rate portion of the related assets. This strategy is designed to protect us from rising interest rates as the borrowing costs are effectively fixed for the duration of the fixed-rate portion of the related assets. However, if prepayment rates decrease in a rising interest rate environment, the life of the fixed-rate portion of the related assets could extend beyond the term of the swap agreement or other hedging instrument. This could have a negative impact on our results from operations, as borrowing costs would no longer be fixed after the end of the hedging instrument while the income earned on the fixed and hybrid adjustable-rate assets would remain fixed. In extreme situations, we may be forced to sell assets to maintain adequate liquidity, which could cause us to incur losses.
Basis Risk
We seek to limit our interest rate risk by hedging portions of our portfolio through interest rate swaps and other types of hedging instruments. Interest rate swaps are generally tied to underlying Treasury benchmark interest rates. Basis risk relates to the risk of the spread between our RMBS and underlying hedges widening. Such a widening may cause a decline in the fair value of our RMBS that is greater than the increase in fair value of our hedges resulting in a net decline in book value. The widening of mortgage-backed securities yields and Treasury benchmark interest rates may result from a variety of factors such as anticipated or actual monetary policy actions or other market factors.
Market Risk
Market Value Risk
Our available-for-sale securities are reflected at their estimated fair value with unrealized gains and losses excluded from earnings and reported in other comprehensive income if no OTTI has been recognized in earnings. The estimated fair value of these securities fluctuates primarily due to changes in interest rates, prepayment speeds, market liquidity, credit quality, and other factors. Generally, in a rising interest rate environment, the estimated fair value of these securities would be expected to decrease; conversely, in a decreasing interest rate environment, the estimated fair value of these securities would be expected to increase. As market volatility increases or liquidity decreases, the fair value of our investments may be adversely impacted.
Real Estate Market Risk
We own assets secured by real property and may own real property directly in the future. Residential property values are subject to volatility and may be affected adversely by a number of factors, including, but not limited to, national, regional and local economic conditions (which may be adversely affected by industry slowdowns and other factors); local real estate conditions (such as an oversupply of housing); changes or continued weakness in specific industry segments; construction quality, age and design; demographic factors; and retroactive changes to building or similar codes. In addition, decreases in property values reduce the value of the collateral and the potential proceeds available to a borrower to repay our loans, which could also cause us to incur losses.
85
Risk Management
To the extent consistent with maintaining our REIT status, we seek to manage risk exposure to protect our portfolio of residential mortgage loans, RMBS, and other assets and related debt against the effects of major interest rate changes. We generally seek to manage risk by:
|
●
|
monitoring and adjusting, if necessary, the reset index and interest rate related to our RMBS and our financings;
|
|
●
|
attempting to structure our financing agreements to have a range of different maturities, terms, amortizations and interest rate adjustment periods;
|
|
●
|
using derivatives, financial futures, swaps, options, caps, floors and forward sales to adjust the interest rate sensitivity of our investments and our borrowings;
|
|
●
|
using securitization financing to lower average cost of funds relative to short-term financing vehicles further allowing us to receive the benefit of attractive terms for an extended period of time in contrast to short term financing and maturity dates of the investments not included in the securitization; and
|
|
●
|
actively managing, on an aggregate basis, the interest rate indices, interest rate adjustment periods, and gross reset margins of our investments and the interest rate indices and adjustment periods of our financings.
|
Our efforts to manage our assets and liabilities are concerned with the timing and magnitude of the re-pricing of assets and liabilities. We attempt to control risks associated with interest rate movements. Methods for evaluating interest rate risk include an analysis of our interest rate sensitivity “gap”, which is the difference between interest-earning assets and interest-bearing liabilities maturing or re-pricing within a given time period. A gap is considered positive when the amount of interest-rate sensitive assets exceeds the amount of interest-rate sensitive liabilities. A gap is considered negative when the amount of interest-rate sensitive liabilities exceeds interest-rate sensitive assets. During a period of rising interest rates, a negative gap would tend to adversely affect net interest income, while a positive gap would tend to result in an increase in net interest income. During a period of falling interest rates, a negative gap would tend to result in an increase in net interest income, while a positive gap would tend to affect net interest income adversely. Because different types of assets and liabilities with the same or similar maturities may react differently to changes in overall market rates or conditions, changes in interest rates may affect net interest income positively or negatively even if an institution were perfectly matched in each maturity category.
The following table sets forth the estimated maturity or re-pricing of our interest-earning assets and interest-bearing liabilities at December 31, 2013. The amounts of assets and liabilities shown within a particular period were determined in accordance with the contractual terms of the assets and liabilities, except adjustable-rate loans, and securities are included in the period in which their interest rates are first scheduled to adjust and not in the period in which they mature and includes the effect of the interest rate swaps. The interest rate sensitivity of our assets and liabilities in the table could vary substantially based on actual prepayments.
|
(dollars in thousands)
|
||||||||||||||||||||
|
Within 3 Months
|
3-12 Months
|
1 Year to 3 Years
|
Greater than 3 Years
|
Total
|
||||||||||||||||
|
Rate sensitive assets
|
$ | 1,613,922 | $ | 2,534,319 | $ | 972,858 | $ | 8,688,916 | $ | 13,810,015 | ||||||||||
|
Cash equivalents
|
77,629 | - | - | - | 77,629 | |||||||||||||||
|
Total rate sensitive assets
|
1,691,551 | 2,534,319 | 972,858 | 8,688,916 | 13,887,644 | |||||||||||||||
|
Rate sensitive liabilities
|
158,032 | 594,260 | 30,209 | 1,157,903 | 1,940,404 | |||||||||||||||
|
Interest rate sensitivity gap
|
$ | 1,533,519 | $ | 1,940,059 | $ | 942,649 | $ | 7,531,013 | $ | 11,947,240 | ||||||||||
|
Cumulative rate sensitivity gap
|
$ | 1,533,519 | $ | 3,473,578 | $ | 4,416,227 | $ | 11,947,240 | ||||||||||||
|
Cumulative interest rate sensitivity gap as a
|
||||||||||||||||||||
|
percentage of total rate sensitive assets
|
11 | % | 25 | % | 32 | % | 86 | % | ||||||||||||
Our analysis of risks is based on our manager’s experience, estimates, models and assumptions. These analyses rely on models which utilize estimates of fair value and interest rate sensitivity. Actual economic conditions or implementation of investment decisions by our manager may produce results that differ significantly from the estimates and assumptions used in our models and the projected results shown in the above tables and in this Form 10-K. These analyses contain certain forward-looking statements and are subject to the safe harbor statement set forth under the heading, “Special Note Regarding Forward-Looking Statements.”
86
Item 8. Financial Statements and Supplementary Data
Our consolidated financial statements and the related notes, together with the Report of Independent Registered Public Accounting Firm thereon, are set forth on pages beginning on F-1 of this 2013 Form 10-K.
Item 9. Changes in and Disagreements with Accountants on Accounting and Financial Disclosure
None
Item 9A. Controls and Procedures
a) Evaluation of Disclosure Controls and Procedures
Disclosure controls and procedures (as defined in Rules 13a-15(e) and 15d-15(e) of the Exchange Act) are designed to ensure that information required to be disclosed in reports filed or submitted under the Exchange Act is recorded, processed, summarized and reported within the time periods specified in SEC rules and forms and that such information is accumulated and communicated to management, including the Chief Executive Officer and Chief Financial Officer, to allow timely decisions regarding required disclosures.
Our management, including our Chief Executive Officer and Chief Financial Officer, reviewed and evaluated the effectiveness of the design and operation of our disclosure controls and procedures as of the end of the period covered by this 2013 annual report. As described below, management has identified material weaknesses in certain components of our internal control over financial reporting, which is an integral component of our disclosure controls and procedures. As a result of these material weaknesses, the inability to file this Annual Report on Form 10-K within the statutory time period, and the evaluation that we have performed, our Chief Executive Officer and Chief Financial Officer have concluded that the disclosure controls and procedures were not effective as of December 31, 2013.
(b) Management’s Report on Internal Control Over Financial Reporting
Our management is responsible for establishing and maintaining adequate internal control over financial reporting, as such term is defined in Exchange Act Rules 13a-15(f) and 15d-15(f). Under the supervision and with the participation of our management, including our Chief Executive Officer and Chief Financial Officer, we conducted an evaluation of the effectiveness of our internal control over financial reporting as of December 31, 2013 based on the framework in Internal Control—Integrated Framework issued by the Committee of Sponsoring Organizations of the Treadway Commission (1992 Framework) (COSO). Based on that evaluation, our management concluded that internal controls over financial reporting and disclosure were not effective as of December 31, 2013 due to the material weaknesses in internal control over financial reporting described below.
Material Weaknesses in Internal Control Over Financial Reporting
A material weakness is a deficiency, or a combination of deficiencies, in internal control over financial reporting such that there is a reasonable possibility that a material misstatement of our annual or interim financial statements will not be prevented or detected on a timely basis. As previously disclosed in Item 9A of our Annual Report on Form 10-K for the period ended December 31, 2012, we reported material weaknesses in our internal control over financial reporting (as defined in Rule 13a-15(f) and 15d-15(f) under the Exchange Act). Certain of the previously reported material weaknesses have been remediated and certain material weaknesses remain un-remediated for this period and remediation as described below is ongoing.
87
Management has remediated the following material weakness in our internal control over financial reporting as of December 31, 2013:
|
●
|
Weakness:
|
Our resources and level of technical accounting expertise within the accounting function were insufficient to properly evaluate and account for the complexity of our investments in Non-Agency RMBS securities, Interest-Only Strips, impairment of securitized loans held for investment, effective interest calculations and related disclosures in accordance with generally accepted accounting principles.
|
●
|
Remediation:
|
Our Manager hired several key people in 2013, including a new Chief Financial Officer, Director of Financial Reporting and Director of Accounting Policy. The new resources and level of technical accounting expertise within the accounting function were sufficient to properly evaluate and account for the complexity of our investments and related disclosures in accordance with generally accepted accounting principles for 2013. Therefore, the previously identified material weakness for inadequate technical accounting experience has been remediated.
|
●
|
Weakness:
|
We did not design and maintain adequate review and approval controls over significant estimates and their related disclosure process to prevent or detect a material misstatement. Specifically, we did not establish adequate procedures or design effective controls as follows:
|
|
o
|
There was no precise or direct independent review and validation of inputs used in significant estimates and their related disclosures such as the determination of fair value.
|
|
●
|
Remediation:
|
In 2013, our Manager formed a middle office group to establish an independent price validation process and to establish review controls over complex calculations and spreadsheets used to support the financial statements and disclosures. The middle office group designed a rigorous process and exercised adequate review and approval controls over the determination of fair value and their related disclosures. Therefore, the previously identified material weakness for inadequate precision or direct independent review and validation of inputs in the determination of fair value has been remediated.
Management has identified the following un-remediated material weaknesses in our internal control over financial reporting as of December 31, 2013:
|
|
●
|
We have identified that our design, procedures, and execution of review controls, including the review of journal entries and reconciliations, for routine processes were not timely or effective. Specifically there was insufficient evidence that our review controls were designed and executed at a precision level that would prevent or detect a material misstatement.
|
|
|
●
|
We did not design and maintain adequate review and approval controls over significant estimates and their related disclosure process to prevent or detect a material misstatement. Specifically, we did not establish adequate procedures or design effective controls as follows:
|
|
|
o
|
There was inadequate or delayed review and validation of inputs used in significant estimates and their related disclosures, such as other-than-temporary impairment, interest income related to investments in RMBS and securitized loans held for investment.
|
|
|
o
|
There was inadequate or delayed evidence of independent validation of calculations used in significant accounting estimates to ensure the accounting policies were appropriately implemented.
|
|
|
o
|
There was inadequate or delayed evidence of review of the schedules supporting the amounts and disclosures in the consolidated financial statements.
|
|
|
●
|
We have identified an overreliance on spreadsheets consisting of manual inputs and complex calculations used to record transactions and estimates supporting the financial statement amounts and disclosures. Our controls over this electronic data were not performed at a level of precision sufficient to rely on the completeness and accuracy of the source data or manual input. The safeguarding and management of electronic data were insufficient to evidence the existence or extent of management's review and validation over the complex spreadsheets by a person with the necessary competency and authority.
|
Due to the material weaknesses, management has concluded that we did not maintain an effective internal control over financial reporting as of December 31, 2013, based on criteria established in the COSO Framework.
The effectiveness of our internal control over financial reporting as of December 31, 2013 has been audited by Ernst & Young LLP, an independent registered public accounting firm, as stated in their report which is included elsewhere herein.
(c) Changes in Internal Control over Financial Reporting
Management is committed to the ongoing remediation efforts to address the material weaknesses as well as other identified areas of risk. These remediation efforts, summarized below, which are either implemented or in process, are intended to both address the identified material weaknesses and to enhance our overall financial control environment.
While a significant amount of review and approval controls were added since the filing of our 2012 Form 10-K on December 31, 2013, there was still insufficient evidence that our review controls were designed and executed at an appropriate precision level. Review controls typically occur during the calendar year as well as the end of the calendar year through the date of the Form 10-K filing; however a majority of the review controls for the Company were executed in 2014 for the 2013 reporting period. As discussed above, the inability to file an Annual Report on Form 10-K within the statutory time period is deemed a result of these material weaknesses.
In November 2013, our Manager hired a new Chief Technology Officer. Our Manager has reviewed its technology infrastructure and is in the process of implementing several new systems which will reduce its reliance on spreadsheets and manual processes. It is expected that the technology projects will take time to implement and may not be fully implemented and functioning until 2015. For 2014, the Company and its Manager have and will continue to focus on its control environment, have and will add controls to its existing infrastructure and will ensure controls are executed on a timely basis until the more systematic and automated processes and procedures are tested and in place.
88
Our Manager has grown the accounting policy, middle office and financial reporting group which has increased the opportunity to further segregate duties, improve the technical competency of the accounting function and improve our control environment. These resources have and will continue to provide improved documentation, evidence and precision of review of the schedules supporting the amounts and disclosures in the consolidated financial statements. The timeliness of the reviews in future periods will further improve the control environment.
Although not all identified material weaknesses have been remediated, our management has concluded that significant changes to the control environment and related processes have occurred and that our consolidated financial statements for the periods covered by and included in this Annual Report on Form 10-K are prepared in accordance with GAAP and fairly present in all material respects, our financial position, results of operation and cash flows for each of the periods presented herein.
Other than the ongoing remediation efforts described above, there have been no changes in our internal control over financial reporting that have materially affected, or are reasonably likely to materially affect, our internal control over financial reporting.
Item 9B. Other Information
None.
PART III
Item 10. Directors, Executive Officers and Corporate Governance
Directors
The following are our directors and officers as of May 16, 2014.
We have three classes of directors. Each of our Class I, Class II and Class III directors will be elected at our next annual meeting of stockholders. Our Class I directors will serve until our annual meeting of stockholders for 2017. Our Class II directors will serve until our annual meeting of stockholders for 2015. Our Class III directors will serve until our annual meeting of stockholders for 2016. Set forth below are the names and certain information on each of our directors.
Mathew Lambiase was previously classified as a Class II Director, however, our Board has reclassified Mr. Lambiase as a Class III Director.
Class I Directors
Paul Donlin, age 52, was appointed as one of our Class I Directors and our Nonexecutive Chairman of the Board of Directors on November 15, 2007. Mr. Donlin left Citigroup in 2007, after a career that spanned 21 years. For the previous 10 years at Citigroup, Mr. Donlin was in the securitization business, with his most recent position being the Head of Global Securitization in the Global Securitized Markets Business within Fixed Income. Earlier in his career at Citigroup, Mr. Donlin managed the Structured Finance and Advisory Unit of Citigroup’s Private Bank. None of the corporations or organization that have employed Mr. Donlin during the past five years is a parent, subsidiary or other affiliate of us. Mr. Donlin has an M.B.A. from Harvard University and a Bachelor’s Degree from Georgetown University.
The Board believes that Mr. Donlin’s qualifications include, among other things, his significant experience in the residential mortgage-backed securities market from his years of management and oversight of securitization activities and his expertise in financial matters.
89
Mark Abrams, age 65, was appointed as one of our Class I Directors on November 15, 2007. Mr. Abrams served as Chief Investment Officer of the Presidential Life Insurance Company from November 2003 to December 2012 and as Executive Vice President from 2005 to December 2012. He was Senior Vice President of the Presidential Life Insurance Company from 2001 to 2005, and before that, Mr. Abrams served as Vice President of the Presidential Life Insurance Company since October 1994. None of the corporations or organizations that have employed Mr. Abrams during the past five years is a parent, subsidiary or other affiliate of us. Mr. Abrams has a Bachelor’s Degree from Hobart College.
The Board believes that Mr. Abrams’s qualifications include, among other things, his experience as a chief investment officer and his prior executive experience with other companies.
Gerard Creagh, age 56, was appointed as one of our Class I Directors effective as of April 1, 2010 to fill a newly created directorship on the board of directors. Since May 2011, Mr. Creagh has served as a Managing Partner at CVC Advisers LLC, a financial consulting firm. From September 2005 through April 2010, Mr. Creagh served as the President and a member of the Board of Directors of Duff & Phelps Corporation. From September 2005 to September 2007, Mr. Creagh served as President of Duff & Phelps Acquisitions, LLC. Prior to its merger with Duff & Phelps in September 2005, Mr. Creagh served as executive managing director of Standard & Poor's Corporate Value Consulting practice. Mr. Creagh joined Standard & Poor’s from PricewaterhouseCoopers, where he held the position of North American Valuation Services practice leader. Mr. Creagh previously served as the U.S. leader for the Valuation Practice of Coopers & Lybrand. None of the corporations or organizations that have employed Mr. Creagh during the past five years is a parent, subsidiary or other affiliate of us. Mr. Creagh received Bachelor’s Degree and Master’s Degree in mechanical engineering from Manhattan College and has an M.B.A. in finance from New York University's Leonard N. Stern School of Business.
The Board believes that Mr. Creagh’s qualifications include, among other things, his experience in the oversight of risk management policies and procedures, his significant background as a lead corporate executive and his prior board experience with other companies.
Class II Directors
Paul A. Keenan, age 47, was appointed as one of our Class II Directors on November 15, 2007. Mr. Keenan has been a partner in the law firm of Kelley Drye and Warren LLP since 2002 and specializes in real estate finance. None of the corporations or organizations that have employed Mr. Keenan during the past five years is a parent, subsidiary or other affiliate of us. Mr. Keenan has a J.D. from Seton Hall University and a Bachelor’s Degree from Rutgers, the State University of New Jersey.
The Board believes that Mr. Keenan’s qualifications include, among other things, his experience as a law firm partner specializing in real estate finance and his knowledge of the real estate finance industry.
Dennis M. Mahoney, age 72, was appointed as one of our Class II Directors effective as of April 1, 2010 to fill a newly created directorship on the board of directors. Before retiring in 2007, Mr. Mahoney was Senior Vice President of Columbia Bank and was responsible for the development and expansion of alternative investment products. Prior to joining Columbia Bank in 1994, Mr. Mahoney was Executive Vice President and Chief Operating Officer of First Atlantic Savings. Mr. Mahoney joined First Atlantic Savings in 1988 from Carteret Savings Bank where he was Executive Vice President, Treasurer. None of the corporations or organizations that have employed Mr. Mahoney during the past five years is a parent, subsidiary or other affiliate of us. Mr. Mahoney received a Bachelor’s Degree in Economics and Business Administration from Roanoke College.
The Board believes that Mr. Mahoney’s qualifications include, among other things, his significant knowledge of the banking and investment industry and his experience as an executive in the financial services industry.
Class III Directors
Matthew Lambiase, age 48, has served as our President and Chief Executive Officer, and one of our directors since August 2007. He is Managing Director for Annaly Capital Management, Inc., or Annaly, and our Manager. He joined these companies in June 2004. Before joining Annaly and FIDAC, Mr. Lambiase was a Director in Fixed Income Sales at Nomura Securities International, Inc. Over his 11 year employment at Nomura, Mr. Lambiase was responsible for the distribution of commercial and residential mortgage-backed securities to a wide variety of institutional investors. Mr. Lambiase also held positions at Bear, Stearns & Company as Vice President in Institutional Fixed Income Sales and as a mortgage analyst in the Financial Analytics and Structured Transaction Group. Mr. Lambiase has been during the past five years and is currently employed at Annaly and our Manager. Mr. Lambiase has a Bachelor’s Degree in Economics from the University of Dayton.
The Board believes that Mr. Lambiase’s qualifications include, among other things, his significant industry knowledge and experience and his current position as our Chief Executive Officer and President provides him with knowledge of our long term strategy and operations.
John P. Reilly, age 65, was appointed as one of our Class III Directors effective as of April 1, 2010 to fill a newly created directorship on the board of directors. Mr. Reilly co-founded and is President and Chief Executive Officer of Keltic Financial Services, LLC, a privately owned finance company providing asset based loans to medium size companies. Prior to founding Keltic Financial Services, LLC, in 1999, Mr. Reilly spent 22 years at Citicorp in various senior executive positions in the Leverage Lending, Capital Markets, Corporate Finance and Private Banking Businesses. Since 2001, Mr. Reilly has served as a director of Scan Source, Inc. None of the corporations or organizations that have employed Mr. Reilly during the past five years is a parent , subsidiary or other affiliate of us. Mr. Reilly has a M.B.A. from Fairleigh Dickinson University, Teaneck , New Jersey, and a Bachelor’s Degree from King’s College, Wilkes-Barre, Pennsylvania.
90
The Board believes that Mr. Reilly’s qualifications include, among other things, his knowledge of the finance industry and prior experience as a director of another company.
Executive Officers
The following sets forth certain information with respect to our current executive officers:
|
Name
|
Age
|
Position Held with Us
|
|
Matthew Lambiase
|
48
|
Chief Executive Officer, President and Director
|
|
Robert Colligan
|
43
|
Chief Financial Officer and Secretary
|
|
Mohit Marria
|
36
|
Chief Investment Officer
|
|
William B. Dyer
|
67
|
Head of Underwriting
|
Biographical information on Mr. Lambiase is provided above. Certain biographical information for Mr. Colligan, Mr. Marria and Mr. Dyer is set forth below.
Robert Colligan is our Chief Financial Officer and Secretary. Before joining FIDAC as a Managing Director in May 2013, Mr. Colligan was the Controller at Starwood Capital Group for the previous five years. Prior to Starwood Capital Group, from 2002 to 2008 Mr. Colligan was a Managing Director at Bear Stearns and from 1999 to 2002 a Vice President at Merrill Lynch in financial reporting, strategy and investor relations roles. Mr. Colligan began his career at PricewaterhouseCoopers where from 1993 to 1999 he had roles in both audit and national tax. He has a Bachelor’s Degree in Accounting from Villanova University, a Master’s Degree in Taxation from George Washington University and is a Certified Public Accountant.
Mohit Marria is our Chief Investment Officer and an Executive Vice President of FIDAC. Mr. Marria joined FIDAC in August 2005. While at FIDAC, Mr. Marria has had responsibility for the development and implementation of Chimera’s trading strategies in residential mortgage-backed securities, residential mortgage loans and its derivatives portfolio. He has been a member of the investment team since Chimera’s inception. Mr. Marria joined FIDAC from American International Group (AIG). Prior to working at AIG, Mr. Marria worked at Metropolitan Life Insurance Company. Mr. Marria earned a Bachelor’s Degree in Finance and a M.B.A., each from the Rutgers University.
William B. Dyer is our Manager’s Executive Vice President and serves as our Head of Underwriting. Before joining FIDAC in August 2007, Mr. Dyer was Vice President, Credit Risk Management for PHH Mortgage Corporation from 1997 where his responsibilities included supervision of the Credit Solutions Department. Mr. Dyer was Vice President at the Fixed-Income Division of Nomura Asset Capital Corporation from 1994 to 1997, where he managed deal-related activities critical for the securitization or sale of the mortgage loans. Mr. Dyer has an M.B.A. from St. John’s University and a Bachelor’s Degree from St. Francis College.
91
Corporate Governance
We believe that we have implemented applicable corporate governance policies and observe good corporate governance procedures and practices. We have adopted a number of written policies, including corporate governance guidelines, code of business conduct and ethics, and charters for our audit committee, compensation committee and nominating and corporate governance committee.
Board Oversight of Risk
The board of directors is responsible for overseeing our risk management practices and committees of the board of directors assist it in fulfilling this responsibility.
As required by its charter, the audit committee routinely discusses with management our significant risk exposures and the actions management has taken to limit, monitor or control such exposures, including guidelines and policies with respect to our assessment of risk and risk management. At least annually, the audit committee reviews with management our risk management program which identifies and quantifies a broad spectrum of enterprise-wide risks, and related action plans. In 2013, our full board of directors participated in this review and discussion and expects to continue this practice as part of its role in the oversight of our risk management practices. In addition, our Manager’s employees report to the audit committee on various matters related to our risk exposures on a regular basis or more frequently if appropriate. At their discretion, members of the board of directors may also directly contact management to review and discuss any risk-related or other concerns that may arise between regular meetings.
Our board of directors reviewed with the compensation committee its compensation policies and practices applicable to our Manager that could affect our assessment of risk and risk management. Following such review, our board of directors determined that our compensation policies and practices, pursuant to which we pay no cash compensation to our Manager’s employees since they are compensated by our Manager, do not create risks that are reasonably likely to have a material adverse effect on us. Our board of directors also considered that while we may grant our Manager’s employees equity awards, such grants align their interests with our interests and do not create risks that are reasonably likely to have a material adverse effect on us. As part of its risk assessment and management activities going forward, our compensation committee also determined that our compensation committee would undertake an annual review of our compensation policies and practices as they relate to risk, the results of which will be shared with our full board of directors.
Board Leadership Structure
We have separated the roles of principal executive officer and chairman of the board. Our principal executive officer is Matthew Lambiase, who is our Chief Executive Officer, President and a Director. Our chairman of the board of directors is Paul Donlin, who is an independent director. The board of directors believes this allocation of responsibilities between these two positions provides for dynamic board leadership while maintaining strong independence and is therefore an effective and appropriate leadership structure.
Board Committees and Charters
Code of Business Conduct and Ethics
We have adopted a Code of Business Conduct and Ethics, which sets forth the basic principles and guidelines for resolving various legal and ethical questions that may arise in the workplace and in the conduct of our business. This code is applicable to all our named executive officers and directors, as well as to our Manager’s officers, directors and employees when such individuals are acting for or on our behalf.
92
We have adopted a Code of Business Conduct and Ethics within the meaning of Item 406(b) of Regulation S-K. This Code of Business Conduct and Ethics applies to our principal executive officer, principal financial officer and principal accounting officer. This Code of Business Conduct and Ethics is publicly available on our website at www.chimerareit.com. If we make substantive amendments to this Code of Business Conduct and Ethics or grant any waiver, including any implicit waiver, we intend to disclose these events on our website.
Corporate Governance Guidelines
We have adopted Corporate Governance Guidelines which, in conjunction with the charters and key practices of our board committees, provide the framework for the governance of our company.
Other Charters
Our compensation committee, audit committee and nominating and corporate governance committee have also adopted written charters which govern their conduct.
Where You Can Find Our Corporate Governance Documents
Our Code of Business Conduct and Ethics, Corporate Governance Guidelines, Compensation Committee Charter, Audit Committee Charter and Nominating and Corporate Governance Committee Charter are available on our website (www.chimerareit.com). We will provide copies of these documents free of charge to any stockholder who sends a written request to Investor Relations, Chimera Investment Corporation, 1211 Avenue of the Americas, Suite 2902, New York, New York 10036.
Compensation Committee
Our board of directors has established a compensation committee, which is composed of each of our independent directors, Messrs. Abrams, Creagh, Donlin, Keenan, Mahoney and Reilly. Mr. Keenan chairs the compensation committee, whose principal functions are to:
|
●
|
evaluate the performance of our officers;
|
|
●
|
evaluate the performance of our Manager;
|
|
●
|
review the compensation and fees payable to our Manager under our management agreement;
|
|
●
|
recommend to the board of directors the compensation for our independent directors; and
|
|
●
|
administer the issuance of any securities under our equity incentive plan to our executives or the employees of our Manager.
|
For additional information on the compensation committee, please see “Compensation Committee Report” below.
Audit Committee
Our board of directors has established an audit committee, which is composed of each of our independent directors, Messrs. Abrams, Creagh, Donlin, Keenan, Mahoney and Reilly. Mr. Mahoney chairs our audit committee as our board of directors has determined that Mr. Mahoney is an audit committee financial expert, as that term is defined by the SEC. Each of the members of the audit committee is “financially literate” under the rules of the NYSE. The committee assists the board in overseeing:
|
●
|
our accounting and financial reporting processes;
|
|
●
|
the integrity and audits of our consolidated financial statements;
|
|
●
|
our compliance with legal and regulatory requirements;
|
|
●
|
the qualifications and independence of our independent registered public accounting firm; and
|
|
●
|
the performance of our independent registered public accounting firm.
|
93
The audit committee is also responsible for engaging our independent registered public accounting firm, reviewing with the independent registered public accounting firm the plans and results of the audit engagement, approving professional services provided by the independent registered public accounting firm, reviewing the independence of the independent registered public accounting firm, considering the range of audit and non-audit fees and reviewing the adequacy of our internal accounting controls.
Our board of directors has determined that all of the directors serving on the audit committee are independent members of the audit committee under the current NYSE independence requirements and SEC rules. The activities of the audit committee are described in greater detail below under the caption “Report of the Audit Committee.”
Nominating and Corporate Governance Committee
Our board of directors has established a nominating and corporate governance committee, which is composed of each of our independent directors, Messrs. Abrams, Creagh, Donlin, Keenan, Mahoney and Reilly. Mr. Donlin chairs the committee, which is responsible for seeking, considering and recommending to the full board of directors qualified candidates for election as directors and recommending a slate of nominees for election as directors at the annual meeting of stockholders. It also periodically prepares and submits to the board for adoption the nominating and corporate governance committee’s selection criteria for director nominees. It reviews and makes recommendations on matters involving general operation of the board and our corporate governance, and annually recommends to the board nominees for each committee of the board. In addition, the nominating and corporate governance committee annually facilitates the assessment of the board of directors’ performance as a whole and of the individual directors and reports thereon to the board.
Our board of directors has determined that all of the directors serving on the nominating and corporate governance committee are independent members of the nominating and corporate governance committee under the current NYSE independence requirements and SEC rules.
Our nominating and corporate governance committee currently considers the following factors in making its recommendations to the board of directors: background, skills, expertise, accessibility and availability to serve effectively on the board of directors. Our nominating and corporate governance committee also conducts inquiries into the background and qualifications of potential candidates. Although the nominating and corporate governance committee does not have a formal diversity policy, it believes that diversity is an important factor in determining the composition of the board of directors. Additionally, the committee believes that it is critical to have a board of directors with diverse backgrounds in various areas as this contributes to our success and is in the best interests of our stockholders. The nominating and corporate governance committee will consider nominees recommended by our stockholders. These recommendations should be submitted in writing to our Secretary.
Our nominating and corporate governance committee uses a variety of methods for identifying and evaluating nominees for director. Our nominating and corporate governance committee regularly assesses the appropriate size of the board of directors, and whether any vacancies on the board of directors are expected due to retirement or otherwise. In the event that vacancies are anticipated, or otherwise arise, our nominating and corporate governance committee considers various potential candidates for director. Candidates may come to the attention of our nominating and corporate governance committee through current members of our board of directors, professional search firms, stockholders or other persons. These candidates are evaluated at regular or special meetings of our nominating and corporate governance committee, and may be considered at any point during the year. As described above, our nominating and corporate governance committee considers properly submitted stockholder nominations for candidates for the board of directors. Following verification of the stockholder status of persons proposing candidates, recommendations are aggregated and considered by our nominating and corporate governance committee at a regularly scheduled or special meeting. If any materials are provided by a stockholder in connection with the nomination of a director candidate, such materials are forwarded to our nominating and corporate governance committee. Our nominating and corporate governance committee also reviews materials provided by professional search firms or other parties in connection with a nominee who is not proposed by a stockholder. In evaluating such nominations, our nominating and corporate governance committee seeks to achieve a balance of knowledge, experience and capability on the board of directors.
94
Communications with the Board of Directors
Interested persons may communicate their complaints or concerns by sending written communications to the board of directors, committees of the board of directors, the non-management directors and individual directors by mailing those communications to:
Chimera Investment Corporation
[Applicable Addressee*]
1211 Avenue of the Americas
Suite 2902
New York, NY 10036
Phone: (646) 454-3759
Facsimile: (212) 696-9809
Email: investor@chimerareit.com
Attention: Investor Relations
* Audit Committee of the Board of Directors
* Compensation Committee of the Board of Directors
* Nominating and Corporate Governance Committee of the Board of Directors
* Non-Management Directors
* Name of individual director
These communications are sent by us directly to the specified addressee.
We require each member of the board of directors to attend our annual meeting of stockholders except for absences due to causes beyond the reasonable control of the director.
Board and Committee Meetings
Our Board of Directors held twenty eight meetings in 2013. During 2013, the compensation committee held two meetings, the audit committee held seventeen meetings, and the nominating and corporate governance committee held three meetings. Each director attended at least 75% of the aggregate number of meetings held by our board of directors during the portion of the last fiscal year for which he was a director. Each director attended at least 75% of the aggregate number of meetings of all committees of the Board of Directors on which the director served during the portion of the last fiscal year for which he was a committee member.
Meetings of Non-Management Directors
Our corporate governance guidelines require that the board have at least two regularly scheduled meetings each year for our non-management directors. These meetings, which are designed to promote unfettered discussions among our non-management directors, are presided over by Paul Donlin or Mark Abrams. During 2013, our non-management directors had five meetings.
Section 16(a) Beneficial Ownership Reporting Compliance
We believe that based solely upon our review of copies of forms we have received or written representations from reporting persons, during the fiscal year ended December 31, 2013, all filing requirements under Section 16(a) of the Securities Exchange Act of 1934, as amended, applicable to our officers, directors and beneficial owners of more than ten percent of our common stock were complied with on a timely basis.
Item 11. Executive Compensation
Compensation Discussion and Analysis
Our Compensation Discussion and Analysis describes our compensation program, objectives and policies for the individuals who were serving as our executive officers at December 31, 2013 as required under item 402(a)(3) of Regulation S-K (“named executive officers”) and our executive officers generally.
95
Our named executive officers who were serving as our executive officers at December 31, 2013 are:
|
Name
|
Current Age
|
Position Held with Us
|
|
Matthew Lambiase
|
48
|
Chief Executive Officer, President and Director
|
|
Rob Colligan
|
43
|
Chief Financial Officer and Secretary
|
|
Mohit Marria
|
36
|
Chief Investment Officer
|
|
William B. Dyer
|
66
|
Head of Underwriting
|
|
A. Alexandra Denahan
|
44
|
Former Chief Financial Officer and Secretary
|
The names and biographical information for our current executive officers are set forth above under the heading “Executive Officers.”
Overview of Compensation Program and Philosophy
We have no employees. We are externally managed by our Manager pursuant to a management agreement between our Manager and us. All of our named executive officers are employees of our Manager. We have not paid, and do not intend to pay, any cash compensation to our named executive officers. We do not provide our named executive officers with pension benefits, perquisites or other personal benefits to them. We have no arrangements to make cash payments to our named executive officers upon their termination from service as our officers. While we do not pay our named executive officers any cash compensation, our compensation committee may grant our named executive officers equity awards intended to align their interests with our interests.
Cash and Other Compensation
Our named executive officers and other personnel who conduct our regular business are employees of our Manager. Accordingly, we do not pay or accrue any salaries or bonuses to our officers.
Equity-Based Compensation
Our compensation committee may, from time to time, grant equity awards in the form of restricted stock, stock options or other types of awards to our named executive officers pursuant to our equity incentive plan. These awards are designed to align the interests of our named executive officers with those of our stockholders, by allowing our named executive officers to share in the creation of value for our stockholders through stock appreciation and dividends. These equity awards are generally subject to vesting requirements over a number of years, and are designed to promote the retention of management and to achieve strong performance for our company. These awards further provide flexibility to us in our ability to enable our Manager to attract, motivate and retain talented individuals. We have not granted any equity awards to employees of our Manager since January 2, 2008.
We believe our compensation policies are particularly appropriate since we are an externally managed REIT. REIT regulations require us to pay at least 90% of our earnings to stockholders as dividends. As a result, we believe that our stockholders are principally interested in receiving attractive risk-adjusted dividends and growth in dividends and book value. Accordingly, we want to provide an incentive to our directors and management that rewards success in achieving these goals. Since we do not have the ability to retain earnings, we believe that equity-based awards serve to align the interests of our Manager’s employees with the interests of our stockholders in receiving attractive risk-adjusted dividends and growth. Additionally, we believe that equity-based awards are consistent with our stockholders’ interest in dividend and book value growth as these individuals will be incented to grow book value and the dividend for stockholders over time. We believe that this alignment of interests provides an incentive to our Manager’s employees to implement strategies that will enhance our long-term performance and promote growth in dividends and growth in book value.
96
Our equity incentive plan permits the granting of options to purchase shares of common stock intended to qualify as incentive stock options under the Internal Revenue Code, and stock options that do not qualify as incentive stock options. The exercise price of each stock option may not be less than 100% of the fair market value of our shares of common stock on the date of grant. Our compensation committee will determine the terms of each option, including when each option may be exercised and the period of time, if any, after retirement, death, disability or termination of employment during which options may be exercised. Options become vested and exercisable in installments and the exercisability of options may be accelerated by the compensation committee.
Our equity incentive plan also permits the granting of shares of our common stock in the form of restricted common stock. A restricted common stock award is an award of shares of common stock that may be subject to forfeiture (vesting), restrictions on transferability and such other restrictions, if any, as the compensation committee may impose at the date of grant. The shares may vest and the restrictions may lapse separately or in combination at such times, under such circumstances, including, without limitation, a specified period of employment or the satisfaction of pre-established criteria, in such installments or otherwise, as our compensation committee may determine.
We may also grant unrestricted shares of common stock, which are shares of common stock awarded at no cost to the participant or for a purchase price determined by the compensation committee, under our equity incentive plan. The compensation committee may also grant shares of our common stock, stock appreciation rights, dividend equivalent rights, and other stock and non-stock-based awards under the equity incentive plan. These awards may be subject to such conditions and restrictions as the compensation committee may determine, including, but not limited to, the achievement of certain goals or continued employment with us through a specific period. Each award under the plan may not be exercisable more than 10 years after the date of grant.
Our equity incentive plan provides that the compensation committee has the discretion to provide that all or any outstanding options and stock appreciation rights will become fully exercisable, all or any outstanding stock awards will become vested and transferable and all or any outstanding options and awards will be earned, all or any outstanding awards may be cancelled in exchange for a payment of cash or all or any outstanding awards may be substituted for awards that will substantially preserve the otherwise applicable terms of any affected awards previously granted under the equity incentive plan if there is a change in control of us.
Our compensation committee does not use a specific formula to calculate the number of equity awards and other rights awarded to executives under our equity incentive plan. Our compensation committee does not explicitly set future award levels/opportunities on the basis of what the executives earned from prior awards. While the compensation committee will take past awards into account, it will not solely base future awards in view of those past awards. Generally, in determining the specific amounts to be granted to an individual, the compensation committee will take into account factors such as the individual’s position, his or her contribution to our company, market practices as well as the recommendations of our Manager.
We have not and do not intend to either backdate stock options or grant stock options retroactively. Presently, we do not have designated dates on which we grant stock option awards. We do not intend to time stock options grants with our release of material nonpublic information for the purpose of affecting the value of executive compensation.
We have designed our compensation policy in an effort to provide the proper incentives to our Manager’s employees to maximize our performance in order to serve the best interests of our stockholders. We seek to achieve this objective through the granting of restricted stock under our equity incentive plan. Consistent with our view that this component of compensation is designed to provide long term incentives, we expect the restricted stock to vest in equal installments over four, five or ten year periods from the date of grant. Consistent with the foregoing, all grants of restricted stock we made in 2008 have a vesting period of ten years.
Consideration of “Say on Pay” Voting Results
The Compensation Committee considered the results of the advisory stockholder “say on pay vote” at our 2011 annual meeting of stockholders in making equity-based compensation decisions for 2011. Because our stockholders approved our equity-based compensation program as described in our 2011 proxy statement, the compensation committee believes that stockholders support our compensation policies. Therefore, the compensation committee continued to apply the same principles with regard to executive compensation in 2013. We will conduct a “say on pay vote” at our next annual meeting of stockholders.
97
Compensation Committee Report
Our Compensation Committee has reviewed and discussed the Compensation Discussion and Analysis required by Item 402(b) of Regulation S-K with management and, based on such review and discussions, the Compensation Committee recommended to the Board that the Compensation Discussion and Analysis be included in this Form 10-K.
Paul A. Keenan, Chair
Mark Abrams
Gerard Creagh
Paul Donlin
Dennis M. Mahoney
John P. Reilly
Compensation Committee Interlocks and Insider Participation
Our compensation committee is comprised solely of the following independent directors: Messrs. Keenan (Chair), Abrams, Creagh, Donlin, Mahoney and Reilly. None of them is serving or has served as an officer or employee of us or any affiliate or has any other business relationship or affiliation with us, except his service as a director.
Summary Compensation Table
We do not provide any of our executive officers with any cash compensation or bonus. Nor do we provide any executive officers with pension benefits or nonqualified deferred compensation plans. We granted shares of restricted stock to our named executive officers during the year ended December 31, 2008 but have not granted any restricted stock or option awards since such time. We have not entered into any employment agreements with any persons, and are not obligated to make any cash payments upon termination of employment or a change in control of us. We did not pay any compensation to our named executive officers during the three year period ended December 31, 2013.
Grants of Plan Based Awards in 2013
We did not grant any shares of restricted stock, options or other incentive compensation to our named executive officers during the year ended December 31, 2013.
Outstanding Equity Awards at Fiscal Year-End
The following table provides information about outstanding equity awards of our named executive officers as of the end of 2013.
|
Stock Awards
|
||
|
Name
|
Equity Incentive Plan Awards:
Number of Unearned Shares,
Units or Other Rights
That Have Not Vested(#)(1)
|
Equity Incentive Plan Awards:
Market or Payout Value of Unearned Shares,
Units or Other Rights That Have Not Yet
Vested($)(2)
|
|
Matthew Lambiase
|
36,000
|
$111,600
|
|
Mohit Marria
|
8,000
|
$24,800
|
|
William Dyer
|
35,000
|
$108,500
|
|
A. Alexandra Denahan
|
35,000
|
$108,500
|
98
• The columns for “Option Awards” have been omitted because they are not applicable.
(1) Reflects a restricted stock award granted to the named executive officer on January 2, 2008, which vests in equal installments on the first business day of each fiscal quarter over a period of 10 years beginning January 2, 2008.
(2) Reflects fair value of unvested shares using December 31, 2013 closing price of $2.90.
Options Exercised and Stock Vested
The following table sets forth certain information with respect to our named executive officers regarding stock vested during the calendar year 2013.
|
Stock Awards
|
||
|
Name
|
Number of
Shares
Acquired on
Vesting (#)
|
Value
Realized on
Vesting(1) ($)
|
|
Matthew Lambiase
|
9,000
|
$26,775
|
|
Mohit Marria
|
1,500
|
$4,463
|
|
William Dyer
|
7,000
|
$20,825
|
|
A. Alexandra Denahan
|
7,000
|
$20,825
|
|
(1)
|
Reflects fair value of vested shares using closing price on date of vesting.
|
Pension Benefits
We do not provide any of our named executive officers with pension benefits.
Nonqualified Deferred Compensation
We do not provide any of our named executive officers with any nonqualified deferred compensation plans.
Potential Payments upon Termination of Employment
We do not have any employment agreements with any of our named executive officers and are not obligated to make any payments to them upon termination of employment.
Potential Post-Employment Payments and Payments on a Change in Control
None of our named executives has the right to terminate employment and receive severance payments from us and we are not required to make payments to an executive upon a change of control of us. However, all unvested shares of restricted stock we have granted under our equity incentive plan will vest immediately upon the executive’s death. The following table presents the potential value our named executive officers would be entitled to in connection with such vesting and assumes that the triggering event took place on December 31, 2013.
|
Name
|
Benefit
|
Termination
with Cause or
Voluntary Termination
|
Termination
without
Cause or for
Good Reason
|
Death or
Disability (1)
|
Other Post Employment Obligations
|
||||||||||||
|
Matthew Lambiase
|
Stock vesting
|
$ | - | $ | - | $ | 111,600 | $ | - | ||||||||
|
Mohit Marria
|
Stock vesting
|
$ | - | $ | - | $ | 24,800 | $ | - | ||||||||
|
William Dyer
|
Stock vesting
|
$ | - | $ | - | $ | 108,500 | $ | - | ||||||||
|
A. Alexandra Denahan
|
Stock vesting
|
$ | - | $ | - | $ | 108,500 | $ | - | ||||||||
(1) We have valued the benefit based on the potential gain executives would have realized if the restricted stock had vested on December 31, 2013.
99
Compensation Policies and Practices as They Relate to Risk Management
We did not pay any compensation of any sort to our named executive officers and did not have any employees during the year ended December 31, 2013 and, therefore, our compensation policies and practices are not reasonably likely to have a material adverse effect on us. We pay our Manager a management fee that is a percentage of our stockholders’ equity. This management fee is not tied to our performance and, as a result, we believe this management fee is not reasonably likely to have a material adverse effect on us. We have designed our compensation policies and practices and the incentives established by the policies and practices, as such policies and practices relate to or affect risk taking by our Manager on our behalf, in a manner that we believe will not cause our Manager to seek to make higher risk investments as the compensation payable to our Manager avoids placing undue emphasis on the maximization of net income at the expense of other criteria, such as preservation of capital, to achieve higher management fees. We have designed our compensation policy in an effort to provide the proper incentives to our Manager’s employees to maximize our performance in order to serve the best interests of our stockholders. Our board of directors monitors our compensation policies and practices to determine whether its risk management objectives are being met with respect to incentivizing our Manager’s employees.
Director Compensation
We compensate only those directors who are independent under the NYSE listing standards. Any member of our board of directors who is also an employee of our Manager is not considered independent under the NYSE listing standards and does not receive additional compensation for serving on our board of directors.
During 2013, our Compensation Committee, together with FPL Associates L.P., a nationally-recognized compensation consulting firm (“FPL”), reviewed the components of the compensation arrangements offered to our independent directors. As part of this process, our Compensation Committee considered, among other things, the duties and responsibilities associated with their positions and emerging trends and best practices in director compensation.
Based upon the recommendations of FPL and our Compensation Committees review of FPL’s analysis, our Compensation Committee determined to leave unchanged the compensation arrangements offered to our independent directors, which are: (i) a cash retainer of $50,000 (which the independent directors may elect to receive shares of our common stock in lieu of cash), (ii) an annual equity grant of $50,000, (iii) an Audit Committee Chairperson retainer of $12,500 (iv) a retainer of $5,000 for each Chairperson of additional committee, and (v) to the extent the combined number of Board/committee meetings exceed 25 in a calendar year, an additional meeting fee of $750 for each meeting (with the same fee to apply for both in-person and telephonic meetings).
We also reimburse our directors for their travel expenses incurred in connection with their attendance at full board and committee meetings. Our independent directors are eligible to receive restricted common stock, option and other stock-based awards under our equity incentive plan.
The Compensation Committee will, on an ongoing basis, continue to examine and assess our director compensation practices relative to our compensation philosophy and objectives, as well as competitive market practices and total stockholder returns, and will make modifications to the compensation programs, as deemed appropriate.
100
The table below summarizes the compensation paid by us to our independent directors for the year ended December 31, 2013.
|
Name
|
Fees
Earned or Paid in Cash
|
Stock
Awards (2)
|
Option
Awards
|
Non-Equity
Incentive
Plan
Compensation
|
Change in
Pension Value
and Deferred
Compensation
Earnings
|
All Other
Compensation
|
Total
|
|
Mark Abrams
|
$61,250
|
$50,000
|
$ -
|
$ -
|
$ -
|
$ -
|
$111,250
|
|
Gerard Creagh
|
$57,500
|
$50,000
|
$ -
|
$ -
|
$ -
|
$ -
|
$107,500
|
|
Paul Donlin
|
$65,500
|
$50,000
|
$ -
|
$ -
|
$ -
|
$ -
|
$115,500
|
|
Paul A. Keenan(1)
|
$58,250
|
$50,000
|
$ -
|
$ -
|
$ -
|
$ -
|
$108,250
|
|
Dennis M. Mahoney
|
$73,750
|
$50,000
|
$ -
|
$ -
|
$ -
|
$ -
|
$123,750
|
|
John P. Reilly
|
$58,250
|
$50,000
|
$ -
|
$ -
|
$ -
|
$ -
|
$108,250
|
(1) Elected to receive common stock in lieu of cash payment for Board of Director fees earned during 2013. The granting of such shares of common stock in lieu of cash payment has been deferred until the Company is current in its filings with the Securities and Exchange Commission under the Securities Exchange Act of 1934, as amended.
(2) For amounts under the column “Stock Awards,” we disclose the expenses associated with the award measured in dollars and calculated in accordance with FASB ASC Topic 718 – Compensation – Stock Compensation.
Item 12. Security Ownership of Certain Beneficial Owners and Management and Related Stockholder Matters
The following table sets forth certain information as of May 16, 2014 relating to the beneficial ownership of our common stock by (i) all persons that we know beneficially own more than 5% of our outstanding common stock, (ii) each of our named executive officers and directors, and (iii) all of our executive officers and directors as a group. Knowledge of the beneficial ownership of our common stock is drawn from statements filed with the SEC pursuant to Section 13(d) or 13(g) of the Securities Act of 1934, as amended. Except as otherwise indicated, to our knowledge, each stockholder listed below has sole voting and investment power with respect to the shares beneficially owned by the stockholder.
Unless otherwise indicated, all shares are owned directly and the indicated person has sole voting and investment power. Except as indicated in the footnotes to the table below, the business address of the stockholders listed below is the address of our principal executive office, 1211 Avenue of the Americas, Suite 2902, New York, New York 10036.
|
Name of Beneficial Owner
|
Amount and Nature of
Beneficial Ownership
|
Percent of
Class
|
|
Matthew Lambiase(1)
|
525,000
|
*
|
|
Robert Colligan(2)
|
0
|
*
|
|
Mohit Marria(3)
|
131,589
|
*
|
|
William B. Dyer(4)
|
99,649
|
*
|
|
Mark Abrams(5)
|
112,032
|
*
|
|
Gerard Creagh(6)
|
228,170
|
*
|
|
Paul Donlin(7)
|
654,137
|
*
|
|
Paul A. Keenan(8)
|
136,357
|
*
|
|
Dennis M. Mahoney(9)
|
81,307
|
*
|
|
John P. Reilly(10)
|
130,927
|
*
|
|
All Directors and Officers As a Group
|
2,099,168
|
*
|
|
Wells Fargo & Company(11)
|
63,740,765
|
6.2%
|
| BlackRock, Inc.(12) |
55,259,856
|
5.4%
|
| Thornburg Investment Management Inc.(13) |
61,360,859
|
6.0%
|
|
Leon G. Cooperman(14)
|
77,886,720
|
7.6%
|
|
Credit Suisse AG(15)
|
55,069,189
|
5.4%
|
|
The Vanguard Group(16)
|
56,775,946
|
5.5%
|
|
|
* Less than 1 percent.
|
101
|
(1)
|
Mr. Lambiase, our Chief Executive Officer, President and one of our directors, is the beneficial owner of 90,000 shares of restricted common stock issued under our equity incentive plan which vests in equal installments on the first business day of each fiscal quarter over a period of ten years beginning on January 2, 2008. Includes 58,500 shares of restricted common stock that have vested as of May 16, 2013; 2,250 shares of restricted common stock that will vest within 60 days after May 16, 2013; and 29,250 shares which vest more than 60 days after December 13, 2013. Includes 43,000 shares of common stock held by Mr. Lambiase in a 401(k) plan.
|
|
(2)
|
Mr. Colligan was named our Chief Financial Officer and Secretary effective May 16, 2013.
|
|
(3)
|
Mr. Marria, our Chief Investment Officer, is the beneficial owner of 20,000 shares of restricted common stock issued under our equity incentive plan which vests in equal installments on the first business day of each fiscal quarter over a period of ten years beginning on January 2, 2008. Includes 13,000 shares of restricted common stock that have vested as of December 13, 2013; 500 shares of restricted common stock that will vest within 60 days after December 13, 2013; and 6,500 shares which vest more than 60 days after December 13, 2013. Includes 54,000 shares of common stock held by Mr. Marria in a 401(k) plan.
|
|
(4)
|
Mr. Dyer, our Head of Underwriting, is the beneficial owner of 70,000 shares of restricted common stock issued under our equity incentive plan which vests in equal installments on the first business day of each fiscal quarter over a period of ten years beginning on January 2, 2008. Includes 45,500 shares of restricted common stock that have vested as of December 13, 2013; 1,750 shares of restricted common stock that will vest within 60 days after December 13, 2013; and 22,750 shares which vest more than 60 days after December 13, 2013.
|
|
(5)
|
Mr. Abrams is one of our directors.
|
|
(6)
|
Mr. Creagh is one of our directors.
|
|
(7)
|
Mr. Donlin is one of our directors. Includes 20,000 shares of common stock held by Mr. Donlin in a Family Trust.
|
|
(8)
|
Mr. Keenan is one of our directors.
|
|
(9)
|
Mr. Mahoney is one of our directors.
|
|
(10)
|
Mr. Reilly is one of our directors. Includes 14,500 shares of common stock held by members of Mr. Reilly’s immediate family.
|
|
(11)
|
The address for this stockholder is 420 Montgomery Street, San Francisco, CA 94104. The shares shown as beneficially owned by Wells Fargo & Company reflect shares owned on its own behalf and on behalf of the following subsidiaries: Wells Capital Management Incorporated; Wells Fargo Advisors Financial Network, LLC; Wells Fargo Advisors, LLC; Wells Fargo Funds Management, LLC; and Wells Fargo Bank, National Association. Aggregate beneficial ownership reported by Wells Fargo & Company is on a consolidated basis and includes any beneficial ownership of a subsidiary. Wells Capital Management Incorporated reported beneficially owning 62,415,720 shares of common stock with the sole power to vote or to direct the vote of zero shares, the shared power to vote or to direct the vote of 13,685,920 of common stock, the sole power to dispose or to direct the disposition of zero shares of common stock and the shared power to dispose or to direct the disposition of 62,415,720 shares of common stock. Wells Fargo & Company reported beneficially owning 63,740,765 shares of common stock with the sole power to vote or to direct the vote of 4 shares of common stock, the shared power to vote or to direct the vote of 63,716,222 of common stock, the sole power to dispose or to direct the disposition of 4 shares of common stock and the shared power to dispose or to direct the disposition of 63,740,761 shares of common stock. Based solely on information contained in a Schedule 13G/A filed by Wells Fargo & Company on January 28, 2014.
|
102
|
(12)
|
The address for this stockholder is 40 East 52nd Street, New York, NY 10022. The shares shown as beneficially owned by BlackRock, Inc. reflect shares owned on its own behalf and on behalf of the following subsidiaries: BlackRock Advisors, LLC; BlackRock Investment Management, LLC; BlackRock Asset Management Canada Limited; BlackRock Advisors (UK) Limited; BlackRock Fund Advisors; BlackRock International Limited; BlackRock Institutional Trust Company, N.A.; BlackRock Investment Management (UK) Limited. Aggregate beneficial ownership reported by BlackRock, Inc. includes any beneficial ownership of a subsidiary. BlackRock, Inc. reported beneficially owning 55,259,856 shares of common stock with the sole power to vote or to direct the vote of 51,237,802 shares of common stock, the shared power to vote or to direct the vote of zero shares of common stock, the sole power to dispose or to direct the disposition of 55,259,856 shares of common stock and the shared power to dispose or to direct the disposition of zero shares of common stock. Based solely on information contained in a Schedule 13G filed by BlackRock, Inc. on January 28, 2014.
|
|
(13)
|
The address for this stockholder is 2300 North Ridgetop Road Santa Fe, NM 87506. Thornburg Investment Management Inc. reported beneficially owning shares of common stock with the sole power to vote or to direct the vote of 61,360,859 shares of common stock, the shared power to vote or to direct the vote of zero shares of common stock, the sole power to dispose or to direct the disposition of 61,360,859 shares of common stock and the shared power to dispose or to direct the disposition of zero shares of common stock. Based solely on information contained in a Schedule 13G filed by Thornburg Investment Management Inc. on January 21, 2014.
|
|
(14)
|
The address for this stockholder is 11431 W. Palmetto Park Road, Boca Raton FL 33428. The shares shown as beneficially owned by Leon G. Cooperman reflect shares owned on his own behalf and on behalf of the following entities: Omega Capital Partners, L.P.; Omega Capital Investors, L.P.; Omega Equity Investors, L.P.; Omega Overseas Partners, Ltd.; Omega Credit Opportunities Fund, LTD. L.P.; a limited number of Managed Accounts; the Cooperman Family Fund for a Jewish Future; the Michael S. Cooperman WRA Trust; the UTMA account for Asher Silvin Cooperman; Toby Cooperman and Michael S. Cooperman; and The Leon and Toby Cooperman Family Foundation. Mr. Cooperman reported that he may be deemed the beneficial owner of 77,886,720 shares. This consists of 12,558,165 shares owned by Omega Capital Partners, L.P.; 5,274,929 shares owned by Omega Capital Investors, L.P.; 5,552,654 shares owned by Omega Equity Investors, L.P.; 14,048,767 shares owned by Omega Overseas Partners, Ltd.; 2,224,000 shares owned by Omega Credit Opportunities Fund, Ltd. L.P.; 23,626,905 shares owned by a limited number of managed accounts; 85,000 shares owned by the Cooperman Family Fund for a Jewish Future; 11,632,500 shares owned by Mr. Cooperman; 600,000 shares owned by Toby Cooperman; 33,800 shares owned by the UTMA account for Asher Silvin Cooperman; 250,000 shares owned by The Leon and Toby Cooperman Family Foundation; 1,000,000 shares owned by Michael S. Cooperman; and 1,000,000 shares owned by the Michael S. Cooperman WRA Trust. Mr. Cooperman reported having the sole power to vote or to direct the vote of 54,259,815 shares, the shared power to vote or to direct the vote of 23,626,905 shares, the sole power to dispose or to direct the disposition of 54,259,815 shares, and the shared power to dispose or to direct the disposition of 23,626,905 shares. Based solely on information contained in a Schedule 13D filed by Leon G. Cooperman on February 24, 2014.
|
|
(15)
|
The address for this stockholder in the United States is Eleven Madison Avenue, New York, NY 10010. Credit Suisse AG reported beneficially owning shares of common stock with the sole power to vote or to direct the vote of zero shares of common stock, the shared power to vote or to direct the vote of 55,069,189 shares of common stock, the sole power to dispose or to direct the disposition of zero shares of common stock and the shared power to dispose or to direct the disposition of 55,069,189 shares of common stock. Based solely on information contained in a Schedule 13G filed by Credit Suisse AG on January 14, 2014.
|
|
(16)
|
The address for this stockholder is 100 Vanguard Blvd., Malvern, PA 19355. The shares shown as beneficially owned by The Vanguard Group reflect shares owned on its own behalf and on behalf of the following subsidiaries: Vanguard Fiduciary Trust Company, and Vanguard Investments Australia, LTD. The Vanguard Group reported beneficially owning shares of common stock with the sole power to vote or to direct the vote of 637,652 shares of common stock, the shared power to vote or to direct the vote of zero shares of common stock, the sole power to dispose or to direct the disposition of 56,205,994 shares of common stock and the shared power to dispose or to direct the disposition of 569,952 shares of common stock. Based solely on information contained in a Schedule 13G filed by The Vanguard Group on February 12, 2014.
|
103
Securities Authorized for Issuance under Equity Compensation Plans
We have adopted an equity incentive plan to provide incentives to our independent directors, employees of our Manager and its affiliates, and other service providers to stimulate their efforts toward our continued success, long-term growth and profitability and to attract, reward and retain personnel.
The following table provides information as of December 31, 2013, concerning shares of our common stock authorized for issuance under our existing equity incentive plan.
|
Plan Category
|
Number of Securities
to be Issued Upon
Exercise of
Outstanding Options,
Warrants, and Rights
|
Weighted Average
Exercise Price of
Outstanding
Options, Warrants,
and Rights
|
Number of Securities
Remaining Available
for Future Issuance
Under Equity
Compensation Plans
|
|||||||||
|
Equity Compensation Plans Approved by Stockholders
|
- | - | 38,387,568 | |||||||||
|
Equity Compensation Plans Not Approved by Stockholders (1)
|
- | - | - | |||||||||
|
Total
|
- | - | 38,387,568 | |||||||||
|
(1) We do not have any equity plans that have not been approved by our stockholders.
|
||||||||||||
Item 13. Certain Relationships and Related Transactions, and Director Independence
Management Agreement
The Management Agreement
On November 15, 2007 we entered into a management agreement with FIDAC, which provided for an initial term through December 31, 2010 with an automatic one-year extension option and subject to certain termination rights. In 2011 and 2010, we paid to our Manager a quarterly management fee equal to 1.50% per annum of our gross Stockholders’ Equity (as defined in the management agreement). Effective November 28, 2012, the management fee was reduced to 0.75% per annum of gross Stockholders’ Equity, which reduction will remain in effect until we are current on all of our filings required under applicable securities laws.
We are obligated to reimburse our Manager for its costs incurred under the management agreement. In addition, the management agreement permits our Manager to require us to pay for its pro rata portion of rent, telephone, utilities, office furniture, equipment, machinery and other office, internal and overhead expenses that our Manager incurred in connection with our operations. These expenses are allocated between our Manager and us based on the ratio of the proportion of gross assets compared to the gross assets managed by our Manager as calculated at each quarter end. Together we will modify this allocation methodology, subject to the approval of our board of directors if the allocation becomes inequitable (i.e., if we become very highly leveraged compared to our Manager’s other funds and accounts).
March 2013 Amendment to Management Agreement
Because of the Restatement Filing, on March 8, 2013 we amended the management agreement. In the amendment, we memorialized the reduction in the management fee effective on November 28, 2012. Additionally, our Manager agreed to pay all past and future expenses that we and/or our Audit Committee incur to: (1) evaluate our accounting policy related to the application of GAAP to our Non-Agency RMBS portfolio (the Evaluation); (2) restate our financial statements for the period covering 2008 through 2011 as a result of the Evaluation (the Restatement Filing); and (3) investigate and evaluate any shareholder derivative demands arising from the Evaluation and/or the Restatement Filing (the Investigation); provided, however, that our Manager’s obligation to pay expenses applies only to expenses not paid by our insurers under our insurance policies. Expenses shall include, without limitation, fees and costs incurred with respect to auditors, outside counsel, and consultants engaged by us and/or our Audit Committee for the Evaluation, Restatement Filing and the Investigation.
104
The amended management agreement is automatically renewed for a one-year term on each anniversary date, although two-thirds of the Independent directors or the holders of a majority of the outstanding shares of common stock (other than those held by Annaly or its affiliates) may elect to terminate the management agreement upon 30 days notice at any time in their sole discretion without the payment of a termination fee. Additionally, we may terminate the management agreement effective immediately if (i) our Manager engages in any act of fraud, misappropriation of funds, or embezzlement against the us, (ii) there is an event of any gross negligence on the part of our Manager in the performance of its duties under the management agreement, (iii) there is a commencement of any proceeding relating to our Manager’s bankruptcy or insolvency, (iv) there is a dissolution of our Manager, or (v) our Manager is convicted of (including a plea of nolo contendere) a felony.
Fees Paid Under the Management Agreement
The fees paid under the management agreement are detailed in the results of operations discussion above. In addition to these fees, our manager received expense reimbursement under the management agreement of $493 thousand, $447 thousand and $625 thousand for the years ended December 31, 2013, 2012 and 2011, respectively. Our Manager uses the proceeds from its management fee in part to pay compensation to its officers and employees who, notwithstanding that certain of them also are our officers, receive no cash compensation directly from us.
Clearing Fees
On March 1, 2011, we entered into an administrative services agreement with RCap Securities, Inc., or RCap. We use RCap, a SEC registered broker-dealer and a wholly-owned subsidiary of Annaly, to clear trades for us and RCap is paid customary fees in return for such services. RCap may also provide brokerage services to us from time to time. During the years ended December 31, 2013, 2012 and 2011, fees paid to RCap were $145 thousand, $138 thousand and $162 thousand, respectively.
Restricted Stock Grants
We granted 98,688 shares of stock to our independent directors during the year ended December 31, 2013 which vested immediately. During the year ended December 31, 2013, approximately 140,000 shares of restricted stock we had awarded to our Manager’s employees during 2008 vested and 70,000 shares were forfeited. At December 31, 2013 there are approximately 384,000 unvested shares of restricted stock issued to our Manager’s employees.
Financing Arrangements with RCap
In September 2009, we entered into a residential mortgage-backed securities repurchase agreement with RCap. This agreement contains customary representations, warranties and covenants. We have not borrowed any amounts under this agreement since April 30, 2010 and currently have no amounts outstanding under this agreement. We have been in compliance with all covenants of this agreement since we entered into this agreement.
Other Relationships
Matthew Lambiase, our President and Chief Executive Officer, one of our directors and the Managing Director of our Manager, is the son of one of Annaly’s directors, John A. Lambiase. Annaly announced on January 30, 2014 that John A. Lambiase would not stand for re-election at Annaly’s annual meeting of shareholders in May 2014 and his departure date will be effective the day of the annual meeting of shareholders. James Zurovchak, a Vice President of Annaly, is the son-in-law of Dennis Mahoney, one of our Directors.
Approval of Related Person Transactions
Our code of business conduct and ethics requires all of our personnel to be scrupulous in avoiding a conflict of interest with regard to our interests. The code prohibits us from entering into a business relationship with an immediate family member or with a company that the employee or immediate family member has a substantial financial interest unless such relationship is disclosed to and approved in advance by our board of directors.
105
Each of our directors and executive officers is required to complete an annual disclosure questionnaire and report all transactions with us in which they and their immediate family members had or will have a direct or indirect material interest with respect to us. We review these questionnaires and, if we determine it is necessary, discuss any reported transactions with the entire board of directors. We do not, however, have a formal written policy for approval or ratification of such transactions, and all such transactions are evaluated on a case-by-case basis. If we believe a transaction is significant to us and raises particular conflict of interest issues, we will discuss it with our legal counsel, and if necessary, we will form an independent board committee which has the right to engage its own legal and financial counsel to evaluate and approve the transaction.
In addition, we will not invest in any collateralized debt obligation or security structured or managed by our Manager or any of its affiliates unless the investment is approved in advance by a majority of our independent directors.
Independence of Our Directors
New York Stock Exchange rules require that at least a majority of our directors be independent of our company and management. The rules also require that our board of directors affirmatively determine that there are no material relationships between a director and us (either directly or as a partner, stockholder or officer of an organization that has a relationship with us) before such director can be deemed independent. We have adopted independence standards consistent with New York Stock Exchange rules. Our board of directors has reviewed both direct and indirect transactions and relationships that each of our directors had or maintained with us and our management. Our board of directors, based upon the fact that none of our independent directors have any material relationships with us other than as directors and holders of our common stock, affirmatively determined that six of our directors are independent directors under New York Stock Exchange rules. Our independent directors are Mark Abrams, Gerard Creagh, Paul Donlin, Paul A. Keenan, Dennis M. Mahoney and John P. Reilly. Matthew Lambiase is not considered independent because he is an employee of our Manager.
Item 14. Principal Accountant Fees and Services
Ernst & Young LLP, or Ernst & Young, was our independent registered public accounting firm for the fiscal years ending December 31, 2013 and 2012. During this time, Ernst & Young and its affiliated entities, or EY, performed accounting and auditing services for us.
Relationship with Independent Registered Public Accounting Firm
Expenses are generally accrued when services are provided. The aggregate fees billed for 2013 and 2012 for each of the following categories of services are set forth below:
Audit Fees: The aggregate fees incurred by EY and Deloitte & Touche, LLP for audits and reviews of our 2013 financial statements were approximately $2.9 million and $25 thousand respectively. We estimate that our Manager will reimburse the Company for approximately $1.4 million of the fees billed by EY for 2013. The aggregate fees incurred by EY for the audit of the Company’s internal control over financial reporting were approximately $600 thousand for 2013. The aggregate fees incurred by EY for audits and reviews of our 2012 financial statements were approximately $3.5 million. We estimate that our Manager will reimburse the Company for approximately $2.8 million of the fees billed by EY for 2012. The aggregate fees incurred by EY for the audit of the Company’s internal control over financial reporting were approximately $570 thousand for 2012.
Audit-Related Fees: No fees were billed by EY for audit-related services during 2013 or 2012.
Tax Fees: The aggregate fees billed by EY for tax services for 2013 were $66 thousand. The aggregate fees billed by EY for tax services for 2012 were $66 thousand.
All Other Fees: EY did not perform any other kinds of services for us during 2013. The aggregate fees billed by EY for other services for 2012 were $99 thousand. The other services billed in 2012 were related to advisory services provided by EY in 2011 prior to EY being appointed as our Independent Registered Public Accounting Firm.
106
The audit committee has also adopted policies and procedures for pre-approving all non-audit work performed by our independent registered public accounting firm. Specifically, the audit committee pre-approved the use of EY for the following categories of non-audit services: merger and acquisition due diligence and audit services; tax services; internal control reviews; employee benefit plan audits; and reviews and procedures that we request EY to undertake to provide assurance on matters not required by laws or regulations. In each case, the audit committee also set a specific annual limit on the amount of such services which we would obtain from EY, and required management to report the specific engagements to the audit committee on a quarterly basis, and also obtain specific pre-approval from the audit committee for any engagement over five percent of the total amount of revenues estimated to be paid by us to EY during the then current fiscal year. Our audit committee approved the hiring of EY to provide all of the services detailed above prior to EY’s engagement. None of the services related to the Audit-Related Fees described above was approved by the audit committee pursuant to a waiver of pre-approval provisions set forth in the applicable rules of the Securities and Exchange Commission.
107
PART IV
Item 15. Exhibits and Financial Statement Schedules
(a) Documents filed as part of this report:
1. Financial Statements.
2. Schedules to Financial Statements.
All financial statement schedules have been omitted because they are either inapplicable or the information required is provided in our Financial Statements and Notes thereto, included in Part II, Item 8, of this Annual Report on Form 10-K.
3. Exhibits:
EXHIBIT INDEX
|
Exhibit
Number
|
Description
|
|
3.1
|
Articles of Amendment and Restatement of Chimera Investment Corporation (filed as Exhibit 3.1 to the Company’s Registration Statement on Amendment No. 1 to Form S-11 (File No. 333-145525) filed on September 27, 2007 and incorporated herein by reference)
|
|
3.2
|
Articles of Amendment of Chimera Investment Corporation (filed as Exhibit 3.1 to the Company’s Report on Form 8-K filed on May 28, 2009 and incorporated herein by reference)
|
|
3.3
|
Articles of Amendment of Chimera Investment Corporation (filed as Exhibit 3.1 to the Company’s Report on Form 8-K filed on November 5, 2010 and incorporated herein by reference)
|
|
3.4
|
Amended and Restated Bylaws of Chimera Investment Corporation (filed as Exhibit 3.2 to the Company’s Report on Form 8-K filed on December 19, 2011 and incorporated herein by reference)
|
|
4.1
|
Specimen Common Stock Certificate of Chimera Investment Corporation (filed as Exhibit 4.1 to the Company’s Registration Statement on Amendment No. 1 to Form S-11 (File No. 333-145525) filed on September 27, 2007 and incorporated herein by reference)
|
|
10.1
|
Form of Management Agreement between Chimera Investment Corporation and Fixed Income Discount Advisory Company (filed as Exhibit 10.1 to the Company’s Registration Statement on Amendment No. 1 to Form S-11 (File No. 333-145525) filed on September 27, 2007 and incorporated herein by reference)
|
|
10.2
|
Form of Amendment No. 1 to the Management Agreement between Chimera Investment Corporation and Fixed Income Discount Advisory Company (filed as Exhibit 10.2 to the Company’s Registration Statement on Amendment No. 1 to Form S-11 (File No. 333-151403) filed on October 14, 2008 and incorporated herein by reference)
|
|
10.3
|
Form of Amendment No. 2 to the Management Agreement between Chimera Investment Corporation and Fixed Income Discount Advisory Company (filed as Exhibit 10.1 to the Company’s Current Report on Form 8-K filed on October 20, 2008 and incorporated herein by reference)
|
|
10.4
|
Amendment No. 3 to the Management Agreement between Chimera Investment Corporation and Fixed Income Discount Advisory Company (filed as Exhibit 10.4 to the Company’s Annual Report on Form 10-K filed on March 8, 2013 and incorporated herein by reference)
|
|
10.5†
|
Form of Equity Incentive Plan (filed as Exhibit 10.2 to the Company’s Registration Statement on Amendment No. 1 to Form S-11 (File No. 333-145525) filed on September 27, 2007 and incorporated herein by reference)
|
|
10.6†
|
Form of Restricted Common Stock Award (filed as Exhibit 10.3 to the Company’s Registration Statement on Amendment No. 1 to Form S-11 (File No. 333-145525) filed on September 27, 2007 and incorporated herein by reference)
|
|
10.7†
|
Form of Stock Option Grant (filed as Exhibit 10.4 to the Company’s Registration Statement on Amendment No. 1 to Form S-11 (File No. 333-145525) filed on September 27, 2007 and incorporated herein by reference)
|
|
10.8
|
Form of Master Securities Repurchase Agreement (filed as Exhibit 10.5 to the Company’s Registration Statement on Amendment No. 3 to Form S-11 (File No. 333-145525) filed on November 13, 2007 and incorporated herein by reference)
|
108
|
12.1
|
Computation of Ratio of Earnings to Fixed Charges
|
|
21.1
|
Subsidiaries of Registrant
|
|
31.1
|
Certification of Matthew Lambiase, Chief Executive Officer and President of the Registrant, pursuant to Section 302 of the Sarbanes-Oxley Act of 2002.
|
|
31.2
|
Certification of Robert Colligan, Chief Financial Officer of the Registrant, pursuant to Section 302 of the Sarbanes-Oxley Act of 2002.
|
|
32.1
|
Certification of Matthew Lambiase, Chief Executive Officer and President of the Registrant, pursuant to 18 U.S.C. Section 1350 as adopted pursuant to Section 906 of the Sarbanes-Oxley Act of 2002.
|
|
32.2
|
Certification of Robert Colligan, Chief Financial Officer of the Registrant, pursuant to 18 U.S.C. Section 1350 as adopted pursuant to Section 906 of the Sarbanes-Oxley Act of 2002.
|
|
Exhibit 101.INS XBRL
|
Instance Document **
|
|
Exhibit 101.SCH XBRL
|
Taxonomy Extension Schema Document **
|
|
Exhibit 101.CAL XBRL
|
Taxonomy Extension Calculation Linkbase Document **
|
|
Exhibit 101.DEF XBRL
|
Additional Taxonomy Extension Definition Linkbase Document Created**
|
|
Exhibit 101.LAB XBRL
|
Taxonomy Extension Label Linkbase Document **
|
|
Exhibit 101.PRE XBRL
|
Taxonomy Extension Presentation Linkbase Document **
|
† Represents a management contract or compensatory plan or arrangement
** Submitted electronically herewith. Attached as Exhibit 101 to this report are the following documents formatted in XBRL (Extensible Business Reporting Language): (i) Consolidated Statements of Financial Condition as of the years ended December 31, 2013 and December 31, 2012; (ii) Consolidated Statements of Operations and Comprehensive Income (Loss) for the years ended December 31, 2013, 2012 and 2011; (iii) Consolidated Statement of Stockholders' Equity for the years ended December 31, 2013, 2012 and 2011; (iv) Consolidated Statements of Cash Flows for the years ended December 31, 2013, 2012 and 2011; and (v) Notes to Consolidated Financial Statements.
109
CHIMERA INVESTMENT CORPORATION
FINANCIAL STATEMENTS
| Reports of Independent Registered Public Accounting Firm |
F-1
|
|
| Consolidated Financial Statements | ||
|
Consolidated Statements of Financial Condition as of December 31, 2013 and 2012
|
F-5
|
|
|
Consolidated Statements of Operations and Comprehensive Income (Loss) for the Years Ended
|
||
|
December 31, 2013, 2012 and 2011
|
F-6
|
|
|
|
||
| Consolidated Statements of Changes in Stockholders' Equity (Deficit) for the Years Ended | ||
|
December 31, 2013, 2012 and 2011
|
F-7
|
|
|
|
||
|
Consolidated Statements of Cash Flows for the Years Ended
|
|
|
|
December 31, 2013, 2012 and 2011
|
F-8 | |
|
Notes to Consolidated Financial Statements
|
F-9
|
|
REPORT OF INDEPENDENT REGISTERED PUBLIC ACCOUNTING FIRM
The Board of Directors and Stockholders of
Chimera Investment Corporation
We have audited the accompanying consolidated statements of financial condition of Chimera Investment Corporation (the “Company”) as of December 31, 2013 and 2012, and the related consolidated statements of operations and comprehensive income (loss), changes in stockholders’ equity (deficit), and cash flows for the years then ended. These financial statements are the responsibility of the Company's management. Our responsibility is to express an opinion on these financial statements based on our audit.
We conducted our audits in accordance with the standards of the Public Company Accounting Oversight Board (United States). Those standards require that we plan and perform the audit to obtain reasonable assurance about whether the financial statements are free of material misstatement. An audit includes examining, on a test basis, evidence supporting the amounts and disclosures in the financial statements. An audit also includes assessing the accounting principles used and significant estimates made by management, as well as evaluating the overall financial statement presentation. We believe that our audits provide a reasonable basis for our opinion.
In our opinion, the financial statements referred to above present fairly, in all material respects, the consolidated financial position of the Company at December 31, 2013 and 2012, and the consolidated results of its operations and its cash flows for the years then ended, in conformity with U.S. generally accepted accounting principles.
We also have audited, in accordance with the standards of the Public Company Accounting Oversight Board (United States), the Company’s internal control over financial reporting as of December 31, 2013, based on criteria established in Internal Control-Integrated Framework issued by the Committee of Sponsoring Organizations of the Treadway Commission (1992 Framework) and our report dated June 4, 2014 expressed an adverse opinion thereon.
/s/ Ernst & Young LLP
New York, New York
June 4, 2014
F-1
REPORT OF INDEPENDENT REGISTERED PUBLIC ACCOUNTING FIRM
To The Board of Directors and Stockholders of
Chimera Investment Corporation
We have audited Chimera Investment Corporation’s internal control over financial reporting as of December 31, 2013, based on criteria established in Internal Control—Integrated Framework issued by the Committee of Sponsoring Organizations of the Treadway Commission (1992 Framework) (the COSO criteria). Chimera Investment Corporation’s management is responsible for maintaining effective internal control over financial reporting, and for its assessment of the effectiveness of internal control over financial reporting included in the accompanying Management’s Report on Internal Control Over Financial Reporting. Our responsibility is to express an opinion on the Company’s internal control over financial reporting based on our audit.
We conducted our audit in accordance with the standards of the Public Company Accounting Oversight Board (United States). Those standards require that we plan and perform the audit to obtain reasonable assurance about whether effective internal control over financial reporting was maintained in all material respects. Our audit included obtaining an understanding of internal control over financial reporting, assessing the risk that a material weakness exists, testing and evaluating the design and operating effectiveness of internal control based on the assessed risk, and performing such other procedures as we considered necessary in the circumstances. We believe that our audit provides a reasonable basis for our opinion.
A company’s internal control over financial reporting is a process designed to provide reasonable assurance regarding the reliability of financial reporting and the preparation of financial statements for external purposes in accordance with generally accepted accounting principles. A company’s internal control over financial reporting includes those policies and procedures that (1) pertain to the maintenance of records that, in reasonable detail, accurately and fairly reflect the transactions and dispositions of the assets of the company; (2) provide reasonable assurance that transactions are recorded as necessary to permit preparation of financial statements in accordance with generally accepted accounting principles, and that receipts and expenditures of the company are being made only in accordance with authorizations of management and directors of the company; and (3) provide reasonable assurance regarding prevention or timely detection of unauthorized acquisition, use, or disposition of the company’s assets that could have a material effect on the financial statements.
Because of its inherent limitations, internal control over financial reporting may not prevent or detect misstatements. Also, projections of any evaluation of effectiveness to future periods are subject to the risk that controls may become inadequate because of changes in conditions, or that the degree of compliance with the policies or procedures may deteriorate.
A material weakness is a deficiency, or combination of deficiencies, in internal control over financial reporting, such that there is a reasonable possibility that a material misstatement of the company’s annual or interim financial statements will not be prevented or detected on a timely basis. The following material weaknesses have been identified and included in management’s assessment.
|
●
|
Management identified that its design, procedures, and execution of review controls, including the review of journal entries and reconciliations, for routine processes were ineffective. Specifically there was insufficient evidence that the Company’s review controls were designed and executed at a precision level that would prevent or detect a material misstatement.
|
|
●
|
Management identified that the Company’s review controls over significant estimates and their related disclosure process were not designed precisely enough to prevent or detect a material misstatement as follows:
|
F-2
|
o
|
There was inadequate or delayed review and validation of inputs used in significant estimates and their related disclosures, such as other-than-temporary impairment, interest income related to investments in RMBS and securitized loans held for investment.
|
|
o
|
There was inadequate or delayed evidence of independent validation of calculations used in significant accounting estimates to ensure the accounting policies were appropriately implemented.
|
|
o
|
There was inadequate or delayed evidence of review of the schedules supporting the amounts and disclosures in the consolidated financial statements by a person with the necessary competency and authority to review such schedules.
|
|
●
|
Management has identified an overreliance on spreadsheets consisting of manual inputs and complex calculations used to record transactions and estimates supporting the financial statement amounts and disclosures. Management's controls over this electronic data were not performed at a level of precision sufficient to rely on the completeness and accuracy of the source data or manual input. The safeguarding and management of electronic data were insufficient to evidence the existence or extent of management's review and validation over the complex spreadsheets by a person with the necessary competency and authority.
|
We also have audited, in accordance with the standards of the Public Company Accounting Oversight Board (United States), the consolidated statements of financial condition of Chimera Investment Corporation as of December 31, 2013 and 2012, and the related consolidated statements of operations and comprehensive income (loss), changes in stockholders’ equity (deficit) and cash flows for the years then ended. These material weaknesses were considered in determining the nature, timing and extent of audit tests applied in our audit of the 2013 financial statements, and this report does not affect our report dated June 4, 2014, which expressed an unqualified opinion on those financial statements.
In our opinion, because of the effect of the material weaknesses described above on the achievement of the objectives of the control criteria, Chimera Investment Corporation has not maintained effective internal control over financial reporting as of December 31, 2013, based on the COSO criteria.
/s/ Ernst & Young LLP
New York, New York
June 4, 2014
F-3
REPORT OF INDEPENDENT REGISTERED PUBLIC ACCOUNTING FIRM
To the Board of Directors and Stockholders of
Chimera Investment Corporation
We have audited the accompanying consolidated statements of operations and comprehensive income (loss), changes in stockholders' equity (deficit), and cash flows of Chimera Investment Corporation and subsidiaries (the "Company") for the year ended December 31, 2011. These financial statements are the responsibility of the Company's management. Our responsibility is to express an opinion on these financial statements based on our audit.
We conducted our audit in accordance with the standards of the Public Company Accounting Oversight Board (United States). Those standards require that we plan and perform the audit to obtain reasonable assurance about whether the financial statements are free of material misstatement. An audit includes examining, on a test basis, evidence supporting the amounts and disclosures in the financial statements. An audit also includes, assessing the accounting principles used and significant estimates made by management, as well as evaluating the overall financial statement presentation. We believe that our audit provides a reasonable basis for our opinion.
In our opinion, the consolidated financial statements referred to above present fairly, in all material respects, the results of operations and cash flows of Chimera Investment Corporation and subsidiaries for the year ended December 31, 2011 in conformity with accounting principles generally accepted in the United States of America.
/s/ Deloitte & Touche LLP
New York, New York
March 8, 2013 (December 31, 2013 as to Note 18)
F-4
|
CHIMERA INVESTMENT CORPORATION
|
||||||||
|
CONSOLIDATED STATEMENTS OF FINANCIAL CONDITION
|
||||||||
|
(dollars in thousands, except share and per share data)
|
||||||||
|
December 31, 2013
|
December 31, 2012
|
|||||||
|
Assets:
|
||||||||
|
Cash and cash equivalents
|
$ | 77,629 | $ | 621,153 | ||||
|
Non-Agency RMBS, at fair value
|
||||||||
|
Senior
|
89,687 | 88 | ||||||
|
Senior interest-only
|
229,065 | 122,869 | ||||||
|
Subordinated
|
457,569 | 547,794 | ||||||
|
Subordinated interest-only
|
16,571 | 16,253 | ||||||
|
Agency RMBS, at fair value
|
1,997,578 | 1,806,697 | ||||||
|
Receivable for investments sold
|
253,541 | - | ||||||
|
Accrued interest receivable
|
15,821 | 15,248 | ||||||
|
Other assets
|
8,297 | 13,970 | ||||||
|
Derivatives, at fair value, net
|
8,095 | - | ||||||
|
Subtotal
|
3,153,853 | 3,144,072 | ||||||
|
Assets of Consolidated VIEs:
|
||||||||
|
Non-Agency RMBS transferred to consolidated variable interest entities ("VIEs"), at fair value
|
2,981,571 | 3,274,204 | ||||||
|
Securitized loans held for investment, net of allowance for loan losses of $9.1 million and $11.6 million, respectively
|
783,484 | 1,300,131 | ||||||
|
Accrued interest receivable
|
17,173 | 24,082 | ||||||
|
Subtotal
|
3,782,228 | 4,598,417 | ||||||
|
Total assets
|
$ | 6,936,081 | $ | 7,742,489 | ||||
|
Liabilities:
|
||||||||
|
Repurchase agreements, Agency RMBS ($1.7 billion and $1.6 billion pledged as collateral, respectively)
|
$ | 1,658,561 | $ | 1,528,025 | ||||
|
Accrued interest payable
|
1,397 | 2,441 | ||||||
|
Dividends payable
|
297,904 | 92,431 | ||||||
|
Accounts payable and other liabilities
|
1,861 | 1,170 | ||||||
|
Investment management fees and expenses payable to affiliate
|
5,658 | 7,675 | ||||||
|
Derivatives, at fair value
|
30,199 | 53,939 | ||||||
|
Subtotal
|
1,995,580 | 1,685,681 | ||||||
|
Non-Recourse Liabilities of Consolidated VIEs
|
||||||||
|
Securitized debt, collateralized by Non-Agency RMBS ($3.0 billion and $3.3 billion pledged as collateral, respectively)
|
933,732 | 1,336,261 | ||||||
|
Securitized debt, collateralized by loans held for investment ($762.6 million and $1.3 billion pledged as collateral, respectively)
|
669,981 | 1,169,710 | ||||||
|
Accrued interest payable
|
5,278 | 8,358 | ||||||
|
Subtotal
|
1,608,991 | 2,514,329 | ||||||
|
Total liabilities
|
$ | 3,604,571 | $ | 4,200,010 | ||||
|
Commitments and Contingencies (See Note 16)
|
||||||||
|
Stockholders' Equity:
|
||||||||
|
Preferred Stock: par value $0.01 per share; 100,000,000 shares authorized, 0 shares issued and outstanding, respectively
|
$ | - | $ | - | ||||
|
Common stock: par value $0.01 per share; 1,500,000,000 shares authorized, 1,027,626,237 and 1,027,597,458 shares issued and outstanding, respectively
|
10,272 | 10,268 | ||||||
|
Additional paid-in-capital
|
3,605,241 | 3,604,554 | ||||||
|
Accumulated other comprehensive income (loss)
|
990,803 | 989,936 | ||||||
|
Retained earnings (accumulated deficit)
|
(1,274,806 | ) | (1,062,279 | ) | ||||
|
Total stockholders' equity
|
$ | 3,331,510 | $ | 3,542,479 | ||||
|
Total liabilities and stockholders' equity
|
$ | 6,936,081 | $ | 7,742,489 | ||||
|
See accompanying notes to consolidated financial statements.
|
||||||||
F-5
|
CHIMERA INVESTMENT CORPORATION
|
||||||||||||
|
CONSOLIDATED STATEMENTS OF OPERATIONS AND COMPREHENSIVE INCOME (LOSS)
|
||||||||||||
|
(dollars in thousands, except share and per share data)
|
||||||||||||
|
For the Year Ended
|
||||||||||||
|
December 31, 2013
|
December 31, 2012
|
December 31, 2011
|
||||||||||
|
Net Interest Income:
|
||||||||||||
|
Interest income
|
$ | 140,224 | $ | 172,089 | $ | 254,028 | ||||||
|
Interest expense
|
(6,770 | ) | (10,678 | ) | (11,941 | ) | ||||||
|
Interest income, Assets of consolidated VIEs
|
371,559 | 417,351 | 450,996 | |||||||||
|
Interest expense, Non-recourse liabilities of consolidated VIEs
|
(95,229 | ) | (115,880 | ) | (122,917 | ) | ||||||
|
Net interest income (expense)
|
409,784 | 462,882 | 570,166 | |||||||||
|
Other-than-temporary impairments:
|
||||||||||||
|
Total other-than-temporary impairment losses
|
(4,356 | ) | (47,632 | ) | (241,962 | ) | ||||||
|
Portion of loss recognized in other comprehensive income (loss)
|
(40,811 | ) | (84,618 | ) | (115,143 | ) | ||||||
|
Net other-than-temporary credit impairment losses
|
(45,167 | ) | (132,250 | ) | (357,105 | ) | ||||||
|
Other gains (losses):
|
||||||||||||
|
Net unrealized gains (losses) on derivatives
|
34,369 | (9,473 | ) | (34,478 | ) | |||||||
|
Net realized gains (losses) on derivatives
|
(7,713 | ) | (20,223 | ) | (15,929 | ) | ||||||
|
Net gains (losses) on derivatives
|
26,656 | (29,696 | ) | (50,407 | ) | |||||||
|
Net unrealized gains (losses) on interest-only RMBS
|
(44,277 | ) | 833 | (14,545 | ) | |||||||
|
Net realized gains (losses) on sales of investments
|
68,107 | 85,166 | 54,353 | |||||||||
|
Realized losses on principal write-downs of Non-Agency RMBS
|
(18,316 | ) | - | - | ||||||||
|
Total other gains (losses)
|
32,170 | 56,303 | (10,599 | ) | ||||||||
|
Net investment income (loss)
|
396,787 | 386,935 | 202,462 | |||||||||
|
Other expenses:
|
||||||||||||
|
Management fees
|
25,952 | 49,525 | 51,969 | |||||||||
|
Expense recoveries from Manager
|
(6,788 | ) | (4,712 | ) | - | |||||||
|
Net management fees
|
19,164 | 44,813 | 51,969 | |||||||||
|
Provision for loan losses, net
|
(1,799 | ) | 368 | 5,291 | ||||||||
|
General and administrative expenses
|
16,734 | 13,986 | 7,267 | |||||||||
|
Total other expenses
|
34,099 | 59,167 | 64,527 | |||||||||
|
Income (loss) before income taxes
|
362,688 | 327,768 | 137,935 | |||||||||
|
Income taxes
|
2 | 1 | 606 | |||||||||
|
Net income (loss)
|
$ | 362,686 | $ | 327,767 | $ | 137,329 | ||||||
|
Net income (loss) per share available to common shareholders:
|
||||||||||||
|
Basic
|
$ | 0.35 | $ | 0.32 | $ | 0.13 | ||||||
|
Diluted
|
$ | 0.35 | $ | 0.32 | $ | 0.13 | ||||||
|
Weighted average number of common shares outstanding:
|
||||||||||||
|
Basic
|
1,027,094,379 | 1,026,831,033 | 1,026,365,197 | |||||||||
|
Diluted
|
1,027,570,343 | 1,027,499,255 | 1,027,171,387 | |||||||||
|
Dividends declared per share of common stock
|
$ | 0.56 | $ | 0.38 | $ | 0.51 | ||||||
|
Comprehensive income (loss):
|
||||||||||||
|
Net income (loss)
|
$ | 362,686 | $ | 327,767 | $ | 137,329 | ||||||
|
Other comprehensive income (loss):
|
||||||||||||
|
Unrealized gains (losses) on available-for-sale securities, net
|
23,807 | 509,399 | (549,422 | ) | ||||||||
|
Reclassification adjustment for net losses included in net income (loss) for other-than-
temporary credit impairment losses
|
45,167 | 132,250 | 357,105 | |||||||||
|
Reclassification adjustment for net realized losses (gains) included in net income (loss)
|
(68,107 | ) | (85,166 | ) | (54,353 | ) | ||||||
|
Other comprehensive income (loss)
|
867 | 556,483 | (246,670 | ) | ||||||||
|
Comprehensive income (loss)
|
$ | 363,553 | $ | 884,250 | $ | (109,341 | ) | |||||
|
See accompanying notes to consolidated financial statements.
|
||||||||||||
F-6
|
CHIMERA INVESTMENT CORPORATION
|
||||||||||||||||||||
|
CONSOLIDATED STATEMENTS OF CHANGES IN STOCKHOLDERS' EQUITY (DEFICIT)
|
||||||||||||||||||||
|
(dollars in thousands, except per share data)
|
||||||||||||||||||||
|
Common Stock
Par Value
|
Additional Paid-
in Capital
|
Accumulated
Other
Comprehensive
Income (Loss)
|
Retained
Earnings
(Accumulated
Deficit)
|
Total
|
||||||||||||||||
|
Balance, December 31, 2010
|
$ | 10,261 | $ | 3,601,890 | $ | 680,123 | $ | (613,688 | ) | $ | 3,678,586 | |||||||||
|
Net income (loss)
|
- | - | - | 137,329 | 137,329 | |||||||||||||||
|
Unrealized gains (losses) on available-for-sale securities, net
|
- | - | (549,422 | ) | - | (549,422 | ) | |||||||||||||
|
Reclassification adjustment for net losses included in net income (loss) for other-than-temporary credit impairment losses
|
- | - | 357,105 | - | 357,105 | |||||||||||||||
|
Reclassification adjustment for net realized losses (gains) included in net income (loss)
|
- | - | (54,353 | ) | - | (54,353 | ) | |||||||||||||
|
Proceeds from direct purchase and dividend reinvestment
|
4 | 1,116 | - | - | 1,120 | |||||||||||||||
|
Proceeds from common stock offerings
|
- | 22 | - | - | 22 | |||||||||||||||
|
Proceeds from restricted stock grants
|
2 | 711 | - | - | 713 | |||||||||||||||
|
Common dividends declared, $0.51 per share
|
- | - | - | (523,481 | ) | (523,481 | ) | |||||||||||||
|
Balance, December 31, 2011
|
$ | 10,267 | $ | 3,603,739 | $ | 433,453 | $ | (999,840 | ) | $ | 3,047,619 | |||||||||
|
Net income (loss)
|
- | - | - | 327,767 | 327,767 | |||||||||||||||
|
Unrealized gains (losses) on available-for-sale securities, net
|
- | - | 509,399 | - | 509,399 | |||||||||||||||
|
Reclassification adjustment for net losses included in net income (loss) for other-than-temporary credit impairment losses
|
- | - | 132,250 | - | 132,250 | |||||||||||||||
|
Reclassification adjustment for net realized losses (gains) included in net income (loss)
|
- | - | (85,166 | ) | - | (85,166 | ) | |||||||||||||
|
Proceeds from direct purchase and dividend reinvestment
|
1 | 116 | - | - | 117 | |||||||||||||||
|
Proceeds from restricted stock grants
|
- | 699 | - | - | 699 | |||||||||||||||
|
Common dividends declared, $0.38 per share
|
- | - | - | (390,206 | ) | (390,206 | ) | |||||||||||||
|
Balance, December 31, 2012
|
$ | 10,268 | $ | 3,604,554 | $ | 989,936 | $ | (1,062,279 | ) | $ | 3,542,479 | |||||||||
|
Net income (loss)
|
- | - | - | 362,686 | 362,686 | |||||||||||||||
|
Unrealized gains (losses) on available-for-sale securities, net
|
- | - | 23,807 | - | 23,807 | |||||||||||||||
|
Reclassification adjustment for net losses included in net income (loss) for other-than-temporary credit impairment losses
|
- | - | 45,167 | - | 45,167 | |||||||||||||||
|
Reclassification adjustment for net realized losses (gains) included in net income (loss)
|
- | - | (68,107 | ) | - | (68,107 | ) | |||||||||||||
|
Proceeds from restricted stock grants
|
4 | 687 | - | - | 691 | |||||||||||||||
|
Common dividends declared, $0.56 per share
|
- | - | - | (575,213 | ) | (575,213 | ) | |||||||||||||
|
Balance, December 31, 2013
|
$ | 10,272 | $ | 3,605,241 | $ | 990,803 | $ | (1,274,806 | ) | $ | 3,331,510 | |||||||||
|
See accompanying notes to consolidated financial statements.
|
||||||||||||||||||||
F-7
|
CHIMERA INVESTMENT CORPORATION
|
||||||||||||
|
CONSOLIDATED STATEMENTS OF CASH FLOWS
|
||||||||||||
|
(dollars in thousands)
|
||||||||||||
|
For the Year Ended
|
||||||||||||
|
December 31, 2013
|
December 31, 2012
|
December 31, 2011
|
||||||||||
|
Cash Flows From Operating Activities:
|
||||||||||||
|
Net income (loss)
|
$ | 362,686 | $ | 327,767 | $ | 137,329 | ||||||
|
Adjustments to reconcile net income to net cash provided by (used in) operating activities:
|
||||||||||||
|
(Accretion) amortization of investment discounts/premiums, net
|
(80,586 | ) | (67,262 | ) | (60,705 | ) | ||||||
|
Amortization of deferred financing costs
|
5,690 | 8,546 | - | |||||||||
|
Accretion (amortization) of securitized debt discounts/premiums, net
|
11,981 | 6,985 | 12,551 | |||||||||
|
Net unrealized losses (gains) on derivatives
|
(34,369 | ) | 9,473 | 34,478 | ||||||||
|
Net unrealized losses (gains) on interest-only RMBS
|
44,277 | (833 | ) | 14,545 | ||||||||
|
Net realized losses (gains) on sales of investments
|
(68,107 | ) | (85,166 | ) | (54,353 | ) | ||||||
|
Realized losses on principal write-downs of Non-Agency RMBS
|
18,316 | - | - | |||||||||
|
Net other-than-temporary credit impairment losses
|
45,167 | 132,250 | 357,105 | |||||||||
|
Provision for loan losses, net
|
(1,799 | ) | 368 | 5,291 | ||||||||
|
Equity-based compensation expense
|
691 | 449 | 713 | |||||||||
|
Changes in operating assets:
|
||||||||||||
|
Decrease (increase) in accrued interest receivable, net
|
6,336 | 9,111 | (672 | ) | ||||||||
|
Decrease (increase) in other assets
|
(13 | ) | (348 | ) | (190 | ) | ||||||
|
Changes in operating liabilities:
|
||||||||||||
|
Increase (decrease) in accounts payable and other liabilities
|
691 | (517 | ) | 1,294 | ||||||||
|
Increase (decrease) in investment management fees and expenses payable to affiliate
|
(2,017 | ) | (5,283 | ) | 536 | |||||||
|
Increase (decrease) in accrued interest payable, net
|
(4,124 | ) | (625 | ) | (217 | ) | ||||||
|
Net cash provided by (used in) operating activities
|
$ | 304,820 | $ | 334,915 | $ | 447,705 | ||||||
|
Cash Flows From Investing Activities:
|
||||||||||||
|
RMBS portfolio:
|
||||||||||||
|
Purchases
|
$ | (2,386,169 | ) | (124,216 | ) | (4,174,746 | ) | |||||
|
Sales
|
1,228,808 | 943,350 | 2,628,994 | |||||||||
|
Principal payments
|
488,255 | 717,352 | 677,190 | |||||||||
|
Non-Agency RMBS transferred to consolidated VIEs:
|
||||||||||||
|
Principal payments
|
466,522 | 505,779 | 668,924 | |||||||||
|
Securitized loans held for investment:
|
||||||||||||
|
Purchases
|
- | (1,531,014 | ) | - | ||||||||
|
Principal payments
|
507,683 | 477,555 | 85,526 | |||||||||
|
Net cash provided by (used in) investing activities
|
$ | 305,099 | $ | 988,806 | $ | (114,112 | ) | |||||
|
Cash Flows From Financing Activities:
|
||||||||||||
|
Proceeds from repurchase agreements
|
$ | 7,879,361 | 6,826,546 | 15,247,543 | ||||||||
|
Payments on repurchase agreements
|
(7,748,825 | ) | (7,971,512 | ) | (14,383,351 | ) | ||||||
|
Net proceeds from common stock offerings
|
- | - | 22 | |||||||||
|
Payment of deferred financing costs
|
- | (9,488 | ) | - | ||||||||
|
Proceeds from securitized debt borrowings, collateralized by loans held for investment
|
- | 1,426,983 | - | |||||||||
|
Payments on securitized debt borrowings, collateralized by loans held for investment
|
(499,549 | ) | (470,788 | ) | (80,181 | ) | ||||||
|
Proceeds from securitized debt borrowings, collateralized by Non-Agency RMBS
|
- | 181,201 | 310,972 | |||||||||
|
Payments on securitized debt borrowings, collateralized by Non-Agency RMBS
|
(414,690 | ) | (481,464 | ) | (645,603 | ) | ||||||
|
Net proceeds from direct purchase and dividend reinvestment
|
- | 367 | 1,120 | |||||||||
|
Common dividends paid
|
(369,740 | ) | (410,712 | ) | (584,989 | ) | ||||||
|
Net cash provided by (used in) financing activities
|
(1,153,443 | ) | $ | (908,867 | ) | $ | (134,467 | ) | ||||
|
Net increase (decrease) in cash and cash equivalents
|
(543,524 | ) | $ | 414,854 | 199,126 | |||||||
|
Cash and cash equivalents at beginning of period
|
621,153 | 206,299 | 7,173 | |||||||||
|
Cash and cash equivalents at end of period
|
$ | 77,629 | $ | 621,153 | $ | 206,299 | ||||||
|
Supplemental disclosure of cash flow information:
|
||||||||||||
|
Interest received
|
$ | 437,533 | $ | 530,578 | $ | 640,199 | ||||||
|
Interest paid
|
$ | 88,455 | $ | 120,734 | $ | 120,688 | ||||||
|
Management fees and expenses paid to affiliate
|
$ | 27,969 | $ | 54,808 | $ | 51,383 | ||||||
|
Non-cash investing activities:
|
||||||||||||
|
Receivable for investments sold
|
$ | 253,541 | $ | - | $ | - | ||||||
|
Net change in unrealized gain (loss) on available-for sale securities
|
$ | 867 | $ | 556,483 | $ | (246,670 | ) | |||||
|
Non-cash financing activities:
|
||||||||||||
|
Common dividends declared, not yet paid
|
$ | 297,904 | $ | 92,431 | $ | 112,937 | ||||||
|
See accompanying notes to consolidated financial statements.
|
||||||||||||
F-8
CHIMERA INVESTMENT CORPORATION
NOTES TO CONSOLIDATED FINANCIAL STATEMENTS
1. Organization
Chimera Investment Corporation (the “Company”) was organized in Maryland on June 1, 2007. The Company commenced operations on November 21, 2007 when it completed its initial public offering. The Company elected to be taxed as a real estate investment trust (“REIT”) under the Internal Revenue Code of 1986, as amended, and regulations promulgated thereunder (the “Code”). The Company formed the following wholly-owned qualified REIT subsidiaries: Chimera Securities Holdings, LLC in July 2008; Chimera Asset Holding LLC and Chimera Holding LLC in June 2009; and Chimera Special Holding LLC in January 2010 which is a wholly-owned subsidiary of Chimera Asset Holding LLC. In July 2010, the Company formed CIM Trading Company LLC, a wholly-owned taxable REIT subsidiary (“TRS”). In October 2013, the Company formed Chimera Funding TRS LLC, which is a wholly-owned TRS.
Annaly Capital Management, Inc. (“Annaly”) owns approximately 4.38% of the Company’s common shares. The Company is managed by Fixed Income Discount Advisory Company (“FIDAC”), an investment advisor registered with the Securities and Exchange Commission (“SEC”). FIDAC is a wholly-owned subsidiary of Annaly.
2. Summary of the Significant Accounting Policies
(a) Basis of Presentation and Consolidation
The accompanying consolidated financial statements and related notes of the Company have been prepared in accordance with accounting principles generally accepted in the United States ("GAAP"). In the opinion of management, all adjustments considered necessary for a fair presentation of the Company's financial position, results of operations and cash flows have been included. Certain prior year amounts have been reclassified to conform to the current year’s presentation.
The consolidated financial statements include, on a consolidated basis, the Company’s accounts, the accounts of its wholly-owned subsidiaries, and variable interest entities (“VIEs”) in which the Company is the primary beneficiary. All significant intercompany balances and transactions have been eliminated in consolidation.
The Company uses securitization trusts considered to be VIEs in its securitization and re-securitization transactions. VIEs are defined as entities in which equity investors (i) do not have the characteristics of a controlling financial interest, and/or (ii) do not have sufficient equity at risk for the entity to finance its activities without additional subordinated financial support from other parties. The entity that consolidates a VIE is known as its primary beneficiary, and is generally the entity with (i) the power to direct the activities that most significantly impact the VIEs’ economic performance, and (ii) the right to receive benefits from the VIE or the obligation to absorb losses of the VIE that could be significant to the VIE. For VIEs that do not have substantial on going activities, the power to direct the activities that most significantly impact the VIEs’ economic performance may be determined by an entity’s involvement with the design and structure of the VIE.
The trusts are structured as pass through entities that receive principal and interest on the underlying collateral and distribute those payments to the certificate holders. The assets held by the securitization entities are restricted in that they can only be used to fulfill the obligations of the securitization entity. The Company’s risks associated with its involvement with these VIEs are limited to its risks and rights as a certificate holder of the bonds it has retained. There have been no recent changes to the nature of risks associated with the Company’s involvement with VIEs.
Determining the primary beneficiary of a VIE requires significant judgment. The Company determined that for the securitizations it consolidates, its ownership of substantially all subordinate interests provided the Company with the obligation to absorb losses and/or the right to receive benefits from the VIE that could be significant to the VIE. In addition, the Company is considered to have the power to direct the activities of the VIEs that most significantly impact the VIEs’ economic performance (“power”) or the Company was determined to have power in connection with its involvement with the purpose and design of the VIE.
F-9
The Company’s interest in the assets held by these securitization vehicles, which are consolidated on the Company’s Statements of Financial Condition, is restricted by the structural provisions of these entities, and a recovery of the Company’s investment in the vehicles will be limited by each entity’s distribution provisions. The liabilities of the securitization vehicles, which are also consolidated on the Company’s Statements of Financial Condition, are non-recourse to the Company, and can generally only be satisfied from each securitization vehicle’s respective asset pool.
The securitization entities are comprised of senior classes of residential mortgage backed securities (“RMBS”) and jumbo, prime, residential mortgage loans. See Notes 3, 4 and 8 for further discussion of the characteristics of the securities and loans in the Company’s portfolio.
(b) Statements of Financial Condition Presentation
The Company’s Consolidated Statements of Financial Condition separately present: (i) the Company’s direct assets and liabilities, and (ii) the assets and liabilities of consolidated securitization vehicles. Assets of each consolidated VIE can only be used to satisfy the obligations of that VIE, and the liabilities of consolidated VIEs are non-recourse to the Company. The Company is not obligated to provide, nor has it provided, any financial support to these consolidated securitization vehicles.
The Company has aggregated all the assets and liabilities of the consolidated securitization vehicles due to the determination that these entities are substantively similar and therefore a further disaggregated presentation would not be more meaningful. The notes to the consolidated financial statements describe the Company’s direct assets and liabilities and the assets and liabilities of consolidated securitization vehicles. See Note 8 for additional information related to the Company’s investments in consolidated securitization vehicles.
(c) Cash and Cash Equivalents
Cash and cash equivalents include cash on hand and cash deposited overnight in money market funds, which are not bank deposits and are not insured or guaranteed by the Federal Deposit Insurance Corporation. There were no restrictions on cash and cash equivalents at December 31, 2013 and 2012.
(d) Agency and Non-Agency Residential Mortgage-Backed Securities
The Company invests in RMBS representing interests in obligations backed by pools of mortgage loans. The Company delineates between Agency RMBS and Non-Agency RMBS as follows: Agency RMBS are mortgage pass-through certificates, collateralized mortgage obligations (“CMOs”), and other RMBS representing interests in or obligations backed by pools of mortgage loans issued or guaranteed by agencies of the U.S. Government, such as Ginnie Mae, or federally chartered corporations such as Freddie Mac or Fannie Mae where principal and interest repayments are guaranteed by the respective agency of the U.S. Government or federally chartered corporation. Non-Agency RMBS are not issued or guaranteed by a U.S. Government Agency or other institution and are subject to credit risk. Repayment of principal and interest on Non-Agency RMBS is subject to the performance of the mortgage loans or RMBS collateralizing the obligation.
The Company classifies its RMBS as available-for-sale, records investments at estimated fair value as described in Note 5 of these consolidated financial statements, and includes unrealized gains and losses considered to be temporary on all RMBS, excluding interest-only (“IO”) strips, in Other comprehensive income (loss) in the Consolidated Statements of Operations and Comprehensive Income (Loss). IO strips are recorded at estimated fair value and all unrealized gains and losses are included in earnings in the Consolidated Statements of Operations and Comprehensive Income (Loss). From time to time, as part of the overall management of its portfolio, the Company may sell any of its RMBS investments and recognize a realized gain or loss as a component of earnings in the Consolidated Statements of Operations and Comprehensive Income (Loss) utilizing the average cost method.
F-10
The Company’s accounting policy for interest income and impairment related to its RMBS is as follows:
Interest Income Recognition
The recognition of interest income on RMBS securities varies depending on the characteristics of the security as follows:
Agency RMBS and Non-Agency RMBS of High Credit Quality
The Financial Accounting Standards Board (“FASB”) Accounting Standards Codification (“ASC”) 310-20, Nonrefundable Fees and Other Costs (“ASC 310-20”) is applied to the recognition of interest income for the following securities:
|
●
|
Agency RMBS
|
|
●
|
Non-Agency RMBS that meet all of the following conditions at the acquisition date (referred to hereafter as “Non-Agency RMBS of High Credit Quality”):
|
|
1.
|
Rated AA or higher by a nationally recognized credit rating agency. The Company uses the lowest rating available.
|
|
2.
|
The Company expects to collect all of the security’s contractual cash flows.
|
|
3.
|
The security cannot be contractually prepaid such that the Company would not recover substantially all of its recorded investment.
|
Under ASC 310-20, interest income, including premiums and discounts associated with the acquisition of these securities, is recognized over the life of such securities using the interest method based on the contractual cash flows of the security. In applying the interest method, the Company considers estimates of future principal prepayments in the calculation of the constant effective yield. Differences that arise between previously anticipated prepayments and actual prepayments received, as well as changes in future prepayment assumptions, result in a recalculation of the effective yield on the security on a quarterly basis. This recalculation results in the recognition of an adjustment to the carrying amount of the security based on the revised prepayment assumptions and a corresponding increase or decrease in reported interest income.
Non-Agency RMBS Not of High Credit Quality
Non-Agency RMBS that are purchased at a discount and that are not of high credit quality at the time of purchase are accounted for under ASC 310-30, Loans and Debt Securities Acquired with Deteriorated Credit Quality (“ASC 310-30”) or ASC 325-40, Beneficial Interests in Securitized Financial Assets (“ASC 325-40”) (referred to hereafter as “Non-Agency RMBS Not of High Credit Quality”).
Non-Agency RMBS are accounted for under ASC 310-30 if the following conditions are met as of the acquisition date:
|
1.
|
There is evidence of deterioration in credit quality of the security from its inception.
|
|
2.
|
It is probable that the Company will be unable to collect all contractual cash flows of the security.
|
Non-Agency RMBS that are not within the scope of ASC 310-30 are accounted for under ASC 325-40 if at the acquisition date:
|
1.
|
The security is not of high credit quality (defined as rated below AA or is unrated), or
|
|
2.
|
The security can contractually be prepaid or otherwise settled in such a way that the Company would not recover substantially all of its recorded investment.
|
Interest income on Non-Agency RMBS Not of High Credit Quality is recognized using the interest method based on management’s estimates of cash flows expected to be collected. The effective interest rate on these securities is based on management’s estimate for each security of the projected cash flows, which are estimated based on observation of current market information and include assumptions related to fluctuations in prepayment speeds and the timing and amount of credit losses. Quarterly, the Company reviews and, if appropriate, makes adjustments to its cash flow projections based on inputs and analyses received from external sources, internal models, and the Company’s judgments about prepayment rates, the timing and amount of credit losses, and other factors. Changes in the amount and/or timing of cash flows from those originally projected, or from those estimated at the last evaluation date, are considered to be either positive changes or adverse changes. For securities accounted for under ASC 325-40, any positive or adverse change in cash flows that does not result in the recognition of an other-than-temporary impairment (“OTTI”) results in a prospective increase or decrease in the effective interest rate used to recognize interest income. For securities accounted for under ASC 310-30, only significant positive changes are reflected prospectively in the effective interest rate used to recognize interest income. Adverse changes in cash flows expected to be collected are generally treated consistently for RMBS accounted for under ASC 325-40 and ASC 310-30, and generally result in recognition of an OTTI with no change in the effective interest rate used to recognize interest income.
F-11
Impairment
Considerations Applicable to all RMBS
When the fair value of an available-for-sale RMBS is less than its amortized cost the security is considered impaired. On at least a quarterly basis the Company evaluates its securities for OTTI. If the Company intends to sell an impaired security, or it is more-likely-than-not that the Company will be required to sell an impaired security before its anticipated recovery, then the Company must recognize an OTTI through a charge to earnings equal to the entire difference between the investment’s amortized cost and its fair value at the measurement date. If the Company does not intend to sell an impaired security and it is not more-likely-than-not that it would be required to sell an impaired security before recovery, the Company must further evaluate the security for impairment due to credit losses. The credit component of OTTI is recognized in earnings and the remaining or non-credit component is recorded as a component of Other comprehensive income (loss) (“OCI”). Following the recognition of an OTTI through earnings, a new amortized cost basis is established for the security and subsequent recoveries in fair value may not be adjusted through earnings.
When evaluating whether the Company intends to sell an impaired security or will more-likely-than-not be required to sell an impaired security before recovery, the Company makes judgments that consider among other things, its liquidity, leverage, contractual obligations, and targeted investment strategy to determine its intent and ability to hold the investments that are deemed impaired. The determination as to whether an OTTI exists is subjective as such determinations are based on factual information available at the time of assessment as well as the Company’s estimates of future conditions. As a result, the determination of OTTI and its timing and amount is based on estimates that may change materially over time.
The Company’s estimate of the amount and timing of cash flows for its RMBS is based on its review of the underlying securities or mortgage loans securing the RMBS. The Company considers historical information available and expected future performance of the underlying securities or mortgage loans, including timing of expected future cash flows, prepayment rates, default rates, loss severities, delinquency rates, percentage of non-performing loans, extent of credit support available, Fair Isaac Corporation (“FICO”) scores at loan origination, year of origination, loan-to-value ratios, geographic concentrations, as well as reports by credit rating agencies, such as Moody’s Investors Service, Inc., Standard & Poor’s Rating Services or Fitch Ratings, Inc., general market assessments and dialogue with market participants. As a result, substantial judgment is used in the Company’s analysis to determine the expected cash flows for its RMBS.
Considerations Applicable to Non-Agency RMBS of High Credit Quality
The impairment assessment for Non-Agency RMBS of High Credit Quality involves comparing the present value of the remaining cash flows expected to be collected to the amortized cost of the security at the assessment date. The discount rate used to calculate the present value of the expected future cash flows is based on the security’s effective interest rate as calculated under ASC 310-20 (i.e., the discount rate implicit in the security as of the last measurement date). If the present value of the remaining cash flows expected to be collected is less than the amortized cost basis, an OTTI is recognized in earnings for the difference. This amount is considered to be the credit loss component; the remaining difference between amortized cost and the fair value of the security is considered to be the portion of loss recognized in other comprehensive income (loss).
F-12
Following the recognition of an OTTI through earnings for the credit loss component, a new amortized cost basis is established for the security and subsequent recoveries in fair value may not be adjusted through earnings.
Considerations Applicable to Non-Agency RMBS Not of High Credit Quality
Non-Agency RMBS within the scope of ASC 325-40 or ASC 310-30 are considered other-than-temporarily impaired when the following two conditions exist: (1) the fair value is less than the amortized cost basis, and (2) there has been an adverse change in cash flows expected to be collected from the last measurement date (i.e., adverse changes in either the amount or timing of cash flows from those previously expected).
The OTTI is separated into a credit loss component that is recognized in earnings and the portion of loss recognized in other comprehensive income (loss). The credit component is comprised of the impact of the fair value decline due to changes in assumptions related to default (collection) risk and prepayments. The portion of loss recognized in other comprehensive income (loss) comprises the change in fair value of the security due to all other factors, including changes in benchmark interest rates and market liquidity. In determining the OTTI related to credit losses for securities, the Company compares the present value of the remaining cash flows adjusted for prepayments expected to be collected at the current financial reporting date to the present value of the remaining cash flows expected to be collected at the original purchase date (or the last date those estimates were revised for accounting purposes). The discount rate used to calculate the present value of expected future cash flows is the effective interest rate used for income recognition purposes as determined under ASC 325-40 or ASC 310-30.
Following the recognition of an OTTI through earnings for the credit component, a new amortized cost basis is established for the security and subsequent recoveries in fair value may not be adjusted through earnings. However, to the extent that there are subsequent increases in cash flows expected to be collected, the OTTI previously recorded through earnings may be accreted into interest income following the guidance in ASC 325-40 or ASC 310-30.
The determination of whether an OTTI exists and, if so, the extent of the credit component is subject to significant judgment and management’s estimates of both historical information available at the time of assessment, the current market environment, as well as the Company’s estimates of the future performance and projected amount and timing of cash flows expected to be collected on the security. As a result, the timing and amount of OTTI constitutes an accounting estimate that may change materially over time.
(e) Interest-Only RMBS
The Company invests in IO Agency and Non-Agency RMBS strips. IO RMBS strips represent the Company’s right to receive a specified proportion of the contractual interest flows of the collateral. The Company has accounted for IO RMBS strips at fair value with changes in fair value recognized in the Company’s Consolidated Statements of Operations and Comprehensive Income (Loss). The Company has elected the fair value option to account for IO RMBS strips to simplify the reporting of changes in fair value. The IO RMBS strips are included in RMBS, at fair value, on the accompanying Consolidated Statements of Financial Condition. Interest income on IO RMBS strips is accrued based on the outstanding notional balance and the security’s contractual terms, and amortization of any premium or discount is calculated in accordance with ASC 325-40. Changes in fair value are presented in Net unrealized gains (losses) on interest-only RMBS on the Consolidated Statement of Operations and Comprehensive Income (Loss). Included in Agency RMBS, at fair value on the Consolidated Statements of Financial condition are IO RMBS strips carried at fair value with changes in fair value reflected in earnings of $42.8 million and $5.1 million as of December 31, 2013 and 2012. Included in Non-Agency RMBS transferred to VIEs, at fair value on the Consolidated Statements of Financial condition are IO RMBS strips carried at fair value with changes in fair value reflected in earnings of $11.7 million and $17.0 million as of December 31, 2013 and 2012. Total Interest income reported on IO securities was $29.9 million, $23.1 million and $32.5 million for the years ended December 31, 2013, 2012 and 2011, respectively.
F-13
(f) Securitized Loans Held for Investment and Related Allowance for Loan Losses
The Company’s securitized residential mortgage loans are comprised of fixed-rate and variable-rate loans. Mortgage loans are designated as held for investment, and are carried at their principal balance outstanding, plus any premiums, less discounts and allowances for loan losses. Interest income on loans held for investment is recognized over the expected life of the loans using the interest method. Nonrefundable fees and costs related to acquiring the Company’s securitized residential mortgage loans are recognized as expenses over the life of the associated debt using the interest method of amortization. Income recognition is suspended for loans when, based on information from the servicer, a full recovery of interest or principal becomes doubtful. The Company estimates the fair value of securitized loans for disclosure purposes only as described in Note 5 of these consolidated financial statements.
(g) Allowance for Loan Losses – Securitized Loans Held for Investment
The securitized loan portfolio is comprised primarily of non-conforming, single family, owner occupied, jumbo, prime loans that are not guaranteed as to repayment of principal or interest. Securitized loans are serviced and modified by a third-party servicer. The Company generally has the ability to approve certain loan modifications and determine the course of action to be taken as it relates to certain loans in technical default, including whether or not to proceed with foreclosure.
The Company’s general reserve is based on historical loss rates for pools of loans with similar credit characteristics, adjusted for current trends and market conditions, including current trends in delinquencies and severities.
The Company has established a specific reserve that reflects consideration of loans more than 60 days delinquent, loans in foreclosure and borrowers that have declared bankruptcy. The loan loss provision related to these loans is measured as the difference between the unpaid principal balance and the estimated fair value of the property securing the mortgage, less estimated costs to sell. The specific reserve also reflects consideration of concessions granted to borrowers by the servicer in the form of modifications (i.e., reductions). Loan loss provisions related to these modifications are based on the contractual principal and interest payments, post-modification, discounted at the loan’s original effective interest rate. Loans with specific reserves are individually evaluated for impairment. Loan modifications made by the servicer are evaluated to determine if they constitute troubled debt restructurings (“TDRs”). A restructuring of a loan constitutes a TDR if the servicer, for economic or legal reasons related to the borrower's financial difficulties, grants a concession to the borrower that it would not otherwise consider. Impairment of modified loans considered to be TDRs is measured based on the present value of expected cash flows discounted at the loan’s effective interest rate at inception. If the present value of expected cash flows is less than the recorded investment in the loan, an allowance for loan losses is recognized with a corresponding charge to the provision for loan losses. Impairment of all other loans individually evaluated is measured as the difference between the unpaid principal balance and the estimated fair value of the collateral, less estimated costs to sell. The Company charges off the corresponding loan allowance and related principal balance when the servicer reports a realized loss. A complete discussion of securitized loans held for investment is included in Note 4 to these consolidated financial statements.
(h) Repurchase Agreements
The Company finances the acquisition of a significant portion of its Agency mortgage-backed securities with repurchase agreements. The Company has evaluated each agreement and determined that each of the repurchase agreements be accounted for as secured borrowings. None of the Company’s repurchase agreements are accounted for as components of linked transactions. As a result, the Company separately accounts for the financial assets posted as collateral and related repurchase agreements in the accompanying consolidated financial statements.
(i) Securitized Debt, Non-Agency RMBS Transferred to Consolidated VIEs, and Securitized Debt, Loans Held for Investment
The Company has issued securitized debt to finance a portion of its residential mortgage loan and RMBS portfolios. Certain transactions involving residential mortgage loans are accounted for as secured borrowings, and are recorded as Securitized loans held for investment and the corresponding debt as Securitized debt, collateralized by loans held for investment in the Consolidated Statements of Financial Condition. These securitizations are collateralized by residential adjustable or fixed rate mortgage loans that have been placed in a trust and pay interest and principal to the debt holders of that securitization. Re-securitization transactions classified as Securitized debt, collateralized by Non-Agency RMBS reflect the transfer to a trust of fixed or adjustable rate RMBS which are classified as Non-Agency RMBS transferred to consolidated VIEs that pay interest and principal to the debt holders of that re-securitization. Re-securitization transactions completed by the Company that did not qualify as sales are accounted for as secured borrowings. The associated securitized debt is carried at amortized cost. The Company estimates the fair value of its securitized debt for disclosure purposes as described in Note 5 to these consolidated financial statements.
F-14
(j) Fair Value Disclosure
A complete discussion of the methodology utilized by the Company to estimate the fair value of its financial instruments is included in Note 5 to these consolidated financial statements.
(k) Derivative Financial Instruments
The Company’s investment policies permit it to enter into derivative contracts, including interest rate swaps, interest rate caps, options, and futures as a means of managing its interest rate risk as well as to enhance investment returns. The Company’s derivatives are recorded as either assets or liabilities in the Consolidated Statements of Financial Condition and measured at fair value. These derivative financial instrument contracts are not designated as hedges for GAAP; therefore, all changes in fair value are recognized in earnings. The Company estimates the fair value of its derivative instruments as described in Note 5 of these consolidated financial statements. Net payments on derivative instruments are included in the Consolidated Statements of Cash Flows as a component of net income (loss). Unrealized gains (losses) on derivatives are removed from net income (loss) to arrive at cash flows from operating activities.
The Company elects to net by counterparty the fair value of its derivative contracts when appropriate. These contracts contain legally enforceable provisions that allow for netting or setting off of all individual swaps receivable and payable with each counterparty and, therefore, the fair value of those swap contracts are reported net by counterparty. The credit support annex provisions of the Company’s interest rate swap contracts allow the parties to mitigate their credit risk by requiring the party which is in a net payable position to post collateral. As the Company elects to net by counterparty the fair value of interest rate swap contracts, it also nets by counterparty any cash collateral exchanged as part of the interest rate swap contracts.
(l) Sales, Securitizations, and Re-Securitizations
The Company periodically enters into transactions in which it sells financial assets, such as RMBS, and mortgage loans. Gains and losses on sales of assets are calculated using the average cost method whereby the Company records a gain or loss on the difference between the average amortized cost of the asset and the proceeds from the sale. In addition, the Company from time to time securitizes or re-securitizes assets and sells tranches in the newly securitized assets. These transactions may be recorded as either sales and the assets contributed to the securitization are removed from the Consolidated Statements of Financial Condition and a gain or loss is recognized, or as secured borrowings whereby the assets contributed to the securitization are not derecognized but rather the debt issued by the securitization entity are recorded to reflect the term financing of the assets. In these securitizations and re-securitizations, the Company may retain senior or subordinated interests in the securitized and/or re-securitized assets.
(m) Income Taxes
The Company has elected to be taxed as a REIT and intends to comply with the provision of the Code, with respect thereto. Accordingly, the Company will not be subject to federal, state or local income tax to the extent that qualifying distributions are made to stockholders and as long as certain asset, income, distribution and stock ownership tests are met. If the Company failed to qualify as a REIT and did not qualify for certain statutory relief provisions, the Company would be subject to federal, state and local income taxes and may be precluded from qualifying as a REIT for the subsequent four taxable years following the year in which the REIT qualification was lost. The Company and CIM Trading made a joint election to treat CIM Trading as a TRS. As such, CIM Trading is taxable as a domestic C corporation and subject to federal, state, and local income taxes based upon its taxable income.
F-15
A tax position is recognized only when, based on management’s judgment regarding the application of income tax laws, it is more likely than not that the tax position will be sustained upon examination. The Company does not have any unrecognized tax benefits that would affect its financial position or require disclosure. No accruals for penalties and interest were necessary as of December 31, 2013 or 2012.
(n) Net Income per Share
The Company calculates basic net income per share by dividing net income for the period by the basic weighted-average shares of its common stock outstanding for that period. Diluted net income per share takes into account the effect of dilutive instruments such as unvested restricted stock.
(o) Stock-Based Compensation
The Company accounts for stock-based compensation awards granted to the employees of FIDAC and FIDAC’s affiliates at the fair value of the stock-based compensation provided. The Company measures the fair value of the equity instrument using the stock prices and other measurement assumptions as of the earlier of either the date at which a performance commitment by the recipient is reached or the date at which the recipient’s performance is complete. Stock compensation expense related to the grants of stock is recognized over the vesting period of such grants based on the fair value of the stock on each quarterly vesting date, at which the recipient’s performance is complete.
Compensation expense for equity based awards granted to the Company’s independent directors is recognized pro-rata over the vesting period of such awards, based upon the fair value of such awards at the grant date.
(p) Use of Estimates
The preparation of financial statements in conformity with GAAP requires management to make estimates and assumptions that affect the reported amounts of assets and liabilities and disclosure of contingent assets and liabilities at the date of the financial statements and the reported amounts of revenues and expenses during the reporting period. Although the Company’s estimates contemplate current conditions and how it expects them to change in the future, it is reasonably possible that actual conditions could be materially different than anticipated in those estimates, which could have a material adverse impact on the Company’s results of operations and its financial condition. Management has made significant estimates in accounting for income recognition and OTTI on Agency and Non-Agency RMBS and IO RMBS (Note 3), valuation of Agency and Non-Agency RMBS (Notes 3 and 5), and derivative instruments (Notes 5 and 9). Actual results could differ materially from those estimates.
(q) Recent Accounting Pronouncements
Presentation
Balance Sheet (Topic 210)
On December 23, 2011, the FASB released Accounting Standards Update (“ASU”) 2011-11, Balance Sheet (Topic 210): Disclosures about Offsetting Assets and Liabilities. Under this update, the Company is required to disclose both gross information and net information about both instruments and transactions eligible for offset in the statement of financial position and transactions subject to an agreement similar to a master netting arrangement. The scope includes derivatives, sale and repurchase agreements and reverse sale and repurchase agreements and securities borrowing and securities lending arrangements. This disclosure is intended to enable financial statement users to understand the effect of such arrangements on the Company’s financial position. The Company adopted this guidance in the first quarter of 2013. As this standard only requires additional disclosure, the adoption of ASU 2011-11 did not have any effect on the consolidated financial statements. The additional disclosures related to the Company’s repurchase agreements and derivatives are presented in Note 14.
F-16
Comprehensive Income (Topic 220)
In February 2013, the FASB issued ASU 2013-02 Comprehensive Income: Reporting of Amounts Reclassified Out of Accumulated Other Comprehensive Income. This update requires the disclosure of information about the amounts reclassified out of accumulated OCI by component. In addition, it requires presentation, either on the face of the statement where net income is presented or in the Notes, significant amounts reclassified out of accumulated OCI by the respective line items of net income, but only if the amount reclassified is required under GAAP to be reclassified to net income in its entirety in the same reporting period. For other amounts that are not required under GAAP to be reclassified in their entirety to net income, a cross-reference must be provided to other disclosures required under GAAP that provide additional detail about those amounts. The Company adopted this guidance in the first quarter of 2013. As this standard only requires additional disclosure, the adoption of ASU 2013-02 did not have any effect on the consolidated financial statements. The additional disclosures related to accumulated OCI are presented in Note 11.
Broad Transactions
Receivables—Troubled Debt Restructurings by Creditors (Subtopic 310-40)
In January 2014, the FASB issued ASU No. 2014-04, Reclassification of Residential Real Estate Collateralized Consumer Mortgage Loans Upon Foreclosure. This update clarifies when the Company is considered to have obtained physical possession, from an in-substance possession or foreclosure, of a residential real estate property collateralizing a mortgage loan. Current guidance indicates that the Company should reclassify a collateralized mortgage loan such that the loan should be derecognized and the collateral asset recognized when it determines that there has been an in-substance repossession or foreclosure by the Company. This update defines the term in substance repossession or foreclosure to reduce diversity in interpretation of when such an event occurs. The guidance in this update is effective for the Company beginning January 1, 2015. The Company is evaluating the impact of this update.
3. Residential Mortgage-Backed Securities
The Company classifies its Non-Agency RMBS as senior, senior IO, subordinated, subordinated IO, and Non-Agency RMBS transferred to consolidated VIEs. The Company also invests in Agency RMBS. Senior interests in Non-Agency RMBS are considered to be entitled to the first principal repayments in their pro-rata ownership interests at the reporting date. The total fair value of the Non-Agency RMBS that are held by consolidated re-securitization trusts was $3.0 billion and $3.3 billion at December 31, 2013 and 2012, respectively. See Note 8 of these consolidated financial statements for further discussion of consolidated VIEs.
The following tables present the principal or notional value, total premium, total discount, amortized cost, fair value, gross unrealized gains, gross unrealized losses, and net unrealized gain (loss) related to the Company’s available-for-sale RMBS portfolio as of December 31, 2013 and 2012, by asset class.
F-17
|
December 31, 2013
|
|||||||||||||||||||||||||||||||||
|
(dollars in thousands)
|
|||||||||||||||||||||||||||||||||
|
Principal or
Notional
Value
|
Total
Premium
|
Total
Discount
|
Amortized
Cost
|
Fair Value
|
Gross
Unrealized
Gains
|
Gross
Unrealized
Losses
|
Net
Unrealized
Gain/(Loss)
|
||||||||||||||||||||||||||
|
Non-Agency RMBS
|
|||||||||||||||||||||||||||||||||
|
Senior
|
$ | 128,217 | $ | - | $ | (39,395 | ) | $ | 88,822 | $ | 89,687 | $ | 974 | $ | (109 | ) | $ | 865 | |||||||||||||||
|
Senior interest-only
|
5,742,781 | 283,271 | - | 283,271 | 229,065 | 11,802 | (66,008 | ) | (54,206 | ) | |||||||||||||||||||||||
|
Subordinated
|
830,632 | - | (490,400 | ) | 340,232 | 457,569 | 119,233 | (1,896 | ) | 117,337 | |||||||||||||||||||||||
|
Subordinated interest-only
|
274,462 | 14,666 | - | 14,666 | 16,571 | 2,483 | (578 | ) | 1,905 | ||||||||||||||||||||||||
|
RMBS transferred to consolidated variable interest
entities ("VIEs")
|
3,912,376 | 7,490 | (1,763,401 | ) | 2,075,628 | 2,981,571 | 905,943 | - | 905,943 | ||||||||||||||||||||||||
|
Agency RMBS
|
2,145,475 | 134,609 | (5,004 | ) | 2,027,736 | 1,997,578 | 22,652 | (52,810 | ) | (30,158 | ) | ||||||||||||||||||||||
|
Total
|
$ | 13,033,943 | $ | 440,036 | $ | (2,298,200 | ) | $ | 4,830,355 | $ | 5,772,041 | $ | 1,063,087 | $ | (121,401 | ) | $ | 941,686 | |||||||||||||||
|
December 31, 2012
|
|||||||||||||||||||||||||||||||||
|
(dollars in thousands)
|
|||||||||||||||||||||||||||||||||
|
Principal or
Notional
Value
|
Total
Premium
|
Total
Discount
|
Amortized
Cost
|
Fair Value
|
Gross
Unrealized
Gains
|
Gross
Unrealized
Losses
|
Net
Unrealized
Gain/(Loss)
|
||||||||||||||||||||||||||
|
Non-Agency RMBS
|
|||||||||||||||||||||||||||||||||
|
Senior
|
$ | 126 | $ | - | $ | (54 | ) | $ | 72 | $ | 88 | $ | 16 | $ | - | $ | 16 | ||||||||||||||||
|
Senior interest-only
|
3,012,868 | 135,868 | - | 135,868 | 122,869 | 7,976 | (20,975 | ) | (12,999 | ) | |||||||||||||||||||||||
|
Subordinated
|
1,057,821 | - | (584,772 | ) | 473,049 | 547,794 | 81,492 | (6,747 | ) | 74,745 | |||||||||||||||||||||||
|
Subordinated interest-only
|
256,072 | 16,180 | - | 16,180 | 16,253 | 1,466 | (1,393 | ) | 73 | ||||||||||||||||||||||||
|
RMBS transferred to consolidated variable interest
entities ("VIEs")
|
4,610,109 | 8,955 | (2,088,125 | ) | 2,437,048 | 3,274,204 | 837,353 | (197 | ) | 837,156 | |||||||||||||||||||||||
|
Agency RMBS
|
1,756,580 | 51,502 | - | 1,720,595 | 1,806,697 | 86,419 | (317 | ) | 86,102 | ||||||||||||||||||||||||
|
Total
|
$ | 10,693,576 | $ | 212,505 | $ | (2,672,951 | ) | $ | 4,782,812 | $ | 5,767,905 | $ | 1,014,722 | $ | (29,629 | ) | $ | 985,093 | |||||||||||||||
The table below presents changes in Accretable Yield, or the excess of the security’s cash flows expected to be collected over the Company’s investment, solely as it pertains to the Company’s Non-Agency RMBS portfolio accounted for according to the provisions of ASC 310-30.
|
For the Year Ended
|
||||||||
|
December 31, 2013
|
December 31, 2012
|
|||||||
|
(dollars in thousands)
|
||||||||
|
Balance at beginning of period
|
$ | 2,107,387 | $ | 2,342,462 | ||||
|
Purchases
|
29,064 | 86,847 | ||||||
|
Accretion
|
(328,491 | ) | (364,282 | ) | ||||
|
Reclassification (to) from non-accretable difference
|
15,957 | 64,017 | ||||||
|
Sales
|
(29,340 | ) | (21,657 | ) | ||||
|
Balance at end of period
|
$ | 1,794,577 | $ | 2,107,387 | ||||
The table below presents the outstanding principal balance and related amortized cost at December 31, 2013 and 2012 as it pertains to the Company’s Non-Agency RMBS portfolio accounted for according to the provisions of ASC 310-30.
|
For the Year Ended
|
||||||||
|
December 31, 2013
|
December 31, 2012
|
|||||||
|
(dollars in thousands)
|
||||||||
|
Outstanding principal balance:
|
||||||||
|
Beginning of period
|
$ | 4,508,475 | $ | 5,245,184 | ||||
|
End of period
|
$ | 3,949,664 | $ | 4,508,475 | ||||
|
Amortized cost:
|
||||||||
|
Beginning of period
|
$ | 2,268,751 | $ | 2,649,303 | ||||
|
End of period
|
$ | 2,027,738 | $ | 2,268,751 | ||||
The following tables present the gross unrealized losses and estimated fair value of the Company’s RMBS by length of time that such securities have been in a continuous unrealized loss position at December 31, 2013 and 2012. All securities in an unrealized loss position have been evaluated by the Company for OTTI as discussed in Note 2(d).
F-18
|
December 31, 2013
|
|||||||||||||||||||||||||||||||||||||
|
(dollars in thousands)
|
|||||||||||||||||||||||||||||||||||||
|
Unrealized Loss Position for Less than 12 Months
|
Unrealized Loss Position for 12 Months or More
|
Total
|
|||||||||||||||||||||||||||||||||||
|
Estimated
Fair Value
|
Unrealized
Losses
|
Number of
Securities
|
Estimated
Fair Value
|
Unrealized
Losses
|
Number of
Securities
|
Estimated
Fair Value
|
Unrealized
Losses
|
Number of
Securities
|
|||||||||||||||||||||||||||||
|
Non-Agency RMBS
|
|||||||||||||||||||||||||||||||||||||
|
Senior
|
$ | 28,163 | $ | (109 | ) | 3 | $ | - | $ | - | - | $ | 28,163 | $ | (109 | ) | 3 | ||||||||||||||||||||
|
Senior interest-only
|
119,913 | (35,252 | ) | 54 | 45,167 | (30,756 | ) | 28 | 165,080 | (66,008 | ) | 82 | |||||||||||||||||||||||||
|
Subordinated
|
- | - | 4 | 17,661 | (1,896 | ) | 2 | 17,661 | (1,896 | ) | 6 | ||||||||||||||||||||||||||
|
Subordinated interest-only
|
1,062 | (578 | ) | 2 | - | - | - | 1,062 | (578 | ) | 2 | ||||||||||||||||||||||||||
|
RMBS transferred to consolidated VIEs
|
- | - | - | - | - | - | - | - | - | ||||||||||||||||||||||||||||
|
Agency RMBS
|
1,149,126 | (52,512 | ) | 34 | 491 | (298 | ) | 3 | 1,149,617 | (52,810 | ) | 37 | |||||||||||||||||||||||||
|
Total
|
$ | 1,298,264 | $ | (88,451 | ) | 97 | $ | 63,319 | $ | (32,950 | ) | 33 | $ | 1,361,583 | $ | (121,401 | ) | 130 | |||||||||||||||||||
|
December 31, 2012
|
|||||||||||||||||||||||||||||||||||||
|
(dollars in thousands)
|
|||||||||||||||||||||||||||||||||||||
|
Unrealized Loss Position for Less than 12 Months
|
Unrealized Loss Position for 12 Months or More
|
Total
|
|||||||||||||||||||||||||||||||||||
|
Estimated
Fair Value
|
Unrealized
Losses
|
Number of
Securities
|
Estimated
Fair Value
|
Unrealized
Losses
|
Number of
Securities
|
Estimated
Fair Value
|
Unrealized
Losses
|
Number of Securities
|
|||||||||||||||||||||||||||||
|
Non-Agency RMBS
|
|||||||||||||||||||||||||||||||||||||
|
Senior
|
$ | - | $ | - | - | $ | - | $ | - | - | $ | - | $ | - | - | ||||||||||||||||||||||
|
Senior interest-only
|
17,764 | (2,828 | ) | 12 | 52,920 | (18,147 | ) | 26 | 70,684 | (20,975 | ) | 38 | |||||||||||||||||||||||||
|
Subordinated
|
- | - | - | 54,774 | (6,747 | ) | 5 | 54,774 | (6,747 | ) | 5 | ||||||||||||||||||||||||||
|
Subordinated interest-only
|
- | - | - | 9,659 | (1,393 | ) | 1 | 9,659 | (1,393 | ) | 1 | ||||||||||||||||||||||||||
|
RMBS transferred to consolidated VIEs
|
- | - | - | 22,490 | (197 | ) | 1 | 22,490 | (197 | ) | 1 | ||||||||||||||||||||||||||
|
Agency RMBS
|
234 | (76 | ) | 2 | 993 | (241 | ) | 2 | 1,227 | (317 | ) | 4 | |||||||||||||||||||||||||
|
Total
|
$ | 17,998 | $ | (2,904 | ) | 14 | $ | 140,836 | $ | (26,725 | ) | 35 | $ | 158,834 | $ | (29,629 | ) | 49 | |||||||||||||||||||
At December 31, 2013, the Company did not intend to sell any of its RMBS that were in an unrealized loss position, and it was not more likely than not that the Company would be required to sell these RMBS before recovery of their amortized cost basis, which may be at their maturity. With respect to RMBS held by consolidated VIEs, the ability of any entity to cause the sale by the VIE prior to the maturity of these RMBS is either expressly prohibited, not probable, or is limited to specified events of default, none of which have occurred as of December 31, 2013.
Gross unrealized losses on the Company’s Agency RMBS were $52.8 million and $317 thousand at December 31, 2013 and 2012, respectively. Given the credit quality inherent in Agency RMBS, the Company does not consider any of the current impairments on its Agency RMBS to be credit related. In evaluating whether it is more likely than not that it will be required to sell any impaired security before its anticipated recovery, which may be at their maturity, the Company considers the significance of each investment, the amount of impairment, the projected future performance of such impaired securities, as well as the Company’s current and anticipated leverage capacity and liquidity position. Based on these analyses, the Company determined that at December 31, 2013 and 2012 unrealized losses on its Agency RMBS were temporary.
Gross unrealized losses on the Company’s Non-Agency RMBS (excluding IO Agency and Non-Agency RMBS strips which are accounted for under the fair value option with changes in fair value recorded in earnings) were $2.0 million and $6.9 million at December 31, 2013 and 2012, respectively. Based upon the most recent evaluation, the Company does not consider these unrealized losses to be indicative of OTTI and does not believe that these unrealized losses are credit related, but rather are due to other factors. The Company has reviewed its Non-Agency RMBS that are in an unrealized loss position to identify those securities with losses that are other-than-temporary based on an assessment of changes in cash flows expected to be collected for such RMBS, which considers recent bond performance and expected future performance of the underlying collateral.
A summary of the OTTI included in earnings for the years ended December 31, 2013, 2012 and 2011 is presented below.
| For the Year Ended | ||||||||||||
|
December 31, 2013
|
December 31, 2012
|
December 31, 2011
|
||||||||||
| (dollars in thousands) | ||||||||||||
|
Total other-than-temporary impairment losses
|
$ | (4,356 | ) | $ | (47,632 | ) | $ | (241,962 | ) | |||
|
Portion of loss recognized in other comprehensive income (loss)
|
(40,811 | ) | (84,618 | ) | (115,143 | ) | ||||||
|
Net other-than-temporary credit impairment losses
|
$ | (45,167 | ) | $ | (132,250 | ) | $ | (357,105 | ) | |||
The following table presents a roll forward of the credit loss component of OTTI on the Company’s Non-Agency RMBS for which a portion of loss was previously recognized in OCI. The table delineates between those securities that are recognizing OTTI for the first time as opposed to those that have previously recognized OTTI.
F-19
|
For the Year Ended
|
||||||||||||
|
December 31, 2013
|
December 31, 2012
|
December 31, 2011
|
||||||||||
|
(dollars in thousands)
|
||||||||||||
|
Cumulative credit loss beginning balance
|
$ | 510,089 | $ | 452,060 | $ | 237,746 | ||||||
|
Additions:
|
||||||||||||
|
Other-than-temporary impairments not previously recognized
|
39,098 | 98,324 | 268,795 | |||||||||
|
Reductions for securities sold during the period
|
(14,038 | ) | (34,577 | ) | (1,300 | ) | ||||||
|
Increases related to other-than-temporary impairments on securities with previously recognized other-than-temporary impairments
|
6,069 | 33,926 | 88,310 | |||||||||
|
Reductions for increases in cash flows expected to be collected over the remaining life of the securities
|
(16,786 | ) | (39,644 | ) | (141,491 | ) | ||||||
|
Cumulative credit impairment loss ending balance
|
$ | 524,432 | $ | 510,089 | $ | 452,060 | ||||||
Cash flows generated to determine net other-than-temporary credit impairment losses recognized in earnings are estimated using significant unobservable inputs. The significant inputs used to measure the component of OTTI recognized in earnings for the Company’s Non-Agency RMBS are summarized as follows:
|
For the Year Ended
|
||||
|
December 31, 2013
|
December 31, 2012
|
|||
|
Loss Severity
|
||||
|
Weighted Average
|
56%
|
57%
|
||
|
Range
|
34% - 75%
|
33% - 86%
|
||
|
60+ days delinquent
|
||||
|
Weighted Average
|
26%
|
26%
|
||
|
Range
|
0% - 43%
|
0% - 53%
|
||
|
Credit Enhancement (1)
|
||||
|
Weighted Average
|
4%
|
13%
|
||
|
Range
|
0% - 48%
|
0% - 75%
|
||
|
3 Month CPR
|
||||
|
Weighted Average
|
15%
|
15%
|
||
|
Range
|
0% - 42%
|
0% - 30%
|
||
|
12 Month CPR
|
||||
|
Weighted Average
|
17%
|
16%
|
||
|
Range
|
9% - 35%
|
8% - 42%
|
||
|
(1) Calculated as the combined credit enhancement to the Re-REMIC and underlying from each of their respective capital structures.
|
||||
The following tables present a summary of unrealized gains and losses at December 31, 2013 and 2012. IO RMBS included in the tables below represent the right to receive a specified proportion of the contractual interest cash flows of the underlying principal balance of specific securities. At December 31, 2013, IO RMBS had a net unrealized loss of $49.1 million and had an amortized cost of $349.2 million. At December 31, 2012, IO RMBS had a net unrealized loss of $4.8 million and had an amortized cost of $166.0 million. The fair value of IOs at December 31, 2013 and 2012 was $300.1 million, and $161.2 million, respectively. All changes in fair value of IOs are reflected in Net income (loss).
F-20
|
December 31, 2013
|
|||||||||||||||||||||||||
|
(dollars in thousands)
|
|||||||||||||||||||||||||
|
Gross Unrealized Gain
Included in Accumulated
Other Comprehensive
Income
|
Gross Unrealized Gain
Included in Accumulated
Deficit
|
Total Gross
Unrealized Gain
|
Gross Unrealized Loss
Included in Accumulated
Other Comprehensive Income
|
Gross Unrealized Loss
Included in Accumulated
Deficit
|
Total Gross
Unrealized Loss
|
||||||||||||||||||||
|
Non-Agency RMBS
|
|||||||||||||||||||||||||
|
Senior
|
$ | 974 | $ | - | $ | 974 | $ | (109 | ) | $ | - | $ | (109 | ) | |||||||||||
|
Senior interest-only
|
- | 11,802 | 11,802 | - | (66,008 | ) | (66,008 | ) | |||||||||||||||||
|
Subordinated
|
119,233 | - | 119,233 | (1,896 | ) | - | (1,896 | ) | |||||||||||||||||
|
Subordinated interest-only
|
- | 2,483 | 2,483 | - | (578 | ) | (578 | ) | |||||||||||||||||
|
RMBS transferred to consolidated VIEs
|
901,773 | 4,170 | 905,943 | - | - | - | |||||||||||||||||||
|
Agency RMBS
|
22,322 | 330 | 22,652 | (51,494 | ) | (1,316 | ) | (52,810 | ) | ||||||||||||||||
|
Total
|
$ | 1,044,302 | $ | 18,785 | $ | 1,063,087 | $ | (53,499 | ) | $ | (67,902 | ) | $ | (121,401 | ) | ||||||||||
|
December 31, 2012
|
|||||||||||||||||||||||||
|
(dollars in thousands)
|
|||||||||||||||||||||||||
|
Gross Unrealized Gain Included in Accumulated Other Comprehensive Income
|
Gross Unrealized Gain Included in Accumulated Deficit
|
Total Gross
Unrealized Gain
|
Gross Unrealized Loss
Included in Accumulated
Other Comprehensive
Income
|
Gross Unrealized Loss
Included in Accumulated
Deficit
|
Total Gross
Unrealized Loss
|
||||||||||||||||||||
|
Non-Agency RMBS
|
|||||||||||||||||||||||||
|
Senior
|
$ | 16 | $ | - | $ | 16 | $ | - | $ | - | $ | - | |||||||||||||
|
Senior interest-only
|
- | 7,976 | 7,976 | - | (20,975 | ) | (20,975 | ) | |||||||||||||||||
|
Subordinated
|
81,492 | - | 81,492 | (6,747 | ) | - | (6,747 | ) | |||||||||||||||||
|
Subordinated interest-only
|
- | 1,466 | 1,466 | - | (1,393 | ) | (1,393 | ) | |||||||||||||||||
|
RMBS transferred to consolidated VIEs
|
829,308 | 8,045 | 837,353 | (197 | ) | - | (197 | ) | |||||||||||||||||
|
Agency RMBS
|
86,062 | 357 | 86,419 | - | (317 | ) | (317 | ) | |||||||||||||||||
|
Total
|
$ | 996,878 | $ | 17,844 | $ | 1,014,722 | $ | (6,944 | ) | $ | (22,685 | ) | $ | (29,629 | ) | ||||||||||
Changes in prepayments, actual cash flows, and cash flows expected to be collected, among other items, are affected by the collateral characteristics of each asset class. The portfolio is most heavily weighted to contain Non-Agency RMBS with credit risk. The Company chooses assets for the portfolio after carefully evaluating each investment’s risk profile.
The following tables provide a summary of the Company’s RMBS portfolio at December 31, 2013 and 2012.
|
December 31, 2013
|
||||||||||||||||||||
|
Principal or
Notional Value
at Period-End
(dollars in
thousands)
|
Weighted
Average
Amortized Cost
Basis
|
Weighted
Average Fair
Value
|
Weighted
Average
Coupon
|
Weighted
Average Yield
at Period-End
(1)
|
||||||||||||||||
|
Non-Agency Mortgage-Backed Securities
|
||||||||||||||||||||
|
Senior
|
$ | 128,217 | $ | 69.27 | $ | 69.95 | 1.42 | % | 5.87 | % | ||||||||||
|
Senior, interest only
|
$ | 5,742,781 | $ | 4.93 | $ | 3.99 | 1.44 | % | 17.17 | % | ||||||||||
|
Subordinated
|
$ | 830,632 | $ | 40.96 | $ | 55.09 | 2.94 | % | 13.49 | % | ||||||||||
|
Subordinated, interest only
|
$ | 274,462 | $ | 5.34 | $ | 6.04 | 1.73 | % | 8.97 | % | ||||||||||
|
RMBS transferred to consolidated variable
interest entities
|
$ | 3,912,376 | $ | 54.17 | $ | 77.82 | 4.66 | % | 15.84 | % | ||||||||||
|
Agency Mortgage-Backed Securities
|
$ | 2,145,475 | $ | 106.83 | $ | 105.24 | 3.99 | % | 3.43 | % | ||||||||||
|
(1) Bond Equivalent Yield at period end.
|
||||||||||||||||||||
|
December 31, 2012
|
||||||||||||||||||||
|
Principal or
Notional Value
at Period-End
(dollars in
thousands)
|
Weighted
Average
Amortized Cost
Basis
|
Weighted
Average Fair
Value
|
Weighted
Average
Coupon
|
Weighted
Average Yield
at Period-End
(1)
|
||||||||||||||||
|
Non-Agency Mortgage-Backed Securities
|
||||||||||||||||||||
|
Senior
|
$ | 126 | $ | 57.02 | $ | 67.00 | 0.00 | % | 11.90 | % | ||||||||||
|
Senior, interest only
|
$ | 3,012,868 | $ | 4.51 | $ | 4.08 | 1.76 | % | 10.36 | % | ||||||||||
|
Subordinated
|
$ | 1,057,821 | $ | 44.72 | $ | 51.79 | 3.18 | % | 11.07 | % | ||||||||||
|
Subordinated, interest only
|
$ | 256,072 | $ | 6.32 | $ | 6.35 | 2.25 | % | 8.90 | % | ||||||||||
|
RMBS transferred to consolidated variable
interest entities
|
$ | 4,610,109 | $ | 53.96 | $ | 72.50 | 4.88 | % | 15.44 | % | ||||||||||
|
Agency Mortgage-Backed Securities
|
$ | 1,756,580 | $ | 103.09 | $ | 108.24 | 4.65 | % | 3.59 | % | ||||||||||
|
(1) Bond Equivalent Yield at period end.
|
||||||||||||||||||||
The following table presents the weighted average credit rating, based on the lowest rating available, of the Company’s Non-Agency RMBS portfolio at December 31, 2013 and 2012.
|
December 31, 2013
|
December 31, 2012
|
|
|
AAA
|
0.00%
|
0.01%
|
|
AA
|
0.71%
|
0.46%
|
|
A
|
0.01%
|
0.00%
|
|
BB
|
1.38%
|
1.41%
|
|
B
|
4.26%
|
1.19%
|
|
Below B or not rated
|
93.64%
|
96.93%
|
|
Total
|
100.00%
|
100.00%
|
F-21
Actual maturities of RMBS are generally shorter than the stated contractual maturities. Actual maturities of the Company’s RMBS are affected by the contractual lives of the underlying mortgages, periodic payments of principal and prepayments of principal. The following tables provide a summary of the fair value and amortized cost of the Company’s RMBS at December 31, 2013 and 2012 according to their estimated weighted-average life classifications. The weighted-average lives of the RMBS in the tables below are based on lifetime expected prepayment rates using an industry prepayment model for the Agency RMBS portfolio and the Company’s prepayment assumptions for the Non-Agency RMBS. The prepayment model considers current yield, forward yield, steepness of the interest rate curve, current mortgage rates, mortgage rates of the outstanding loan, loan age, margin, and volatility.
|
December 31, 2013
|
||||||||||||||||||||
|
(dollars in thousands)
|
||||||||||||||||||||
|
Weighted Average Life
|
||||||||||||||||||||
|
Less than one
year
|
Greater than one
year and less than
five years
|
Greater than five
years and less
than ten years
|
Greater than ten
years
|
Total
|
||||||||||||||||
|
Fair value
|
||||||||||||||||||||
|
Non-Agency RMBS
|
||||||||||||||||||||
|
Senior
|
$ | - | $ | 29,283 | $ | 60,404 | $ | - | $ | 89,687 | ||||||||||
|
Senior interest-only
|
376 | 103,688 | 96,968 | 28,033 | 229,065 | |||||||||||||||
|
Subordinated
|
3,359 | 63,177 | 321,333 | 69,700 | 457,569 | |||||||||||||||
|
Subordinated interest-only
|
- | - | 14,862 | 1,709 | 16,571 | |||||||||||||||
|
RMBS transferred to consolidated VIEs
|
5,724 | 276,752 | 1,986,879 | 712,216 | 2,981,571 | |||||||||||||||
|
Agency RMBS
|
54 | 21,011 | 1,850,438 | 126,075 | 1,997,578 | |||||||||||||||
|
Total fair value
|
$ | 9,513 | $ | 493,911 | $ | 4,330,884 | $ | 937,733 | $ | 5,772,041 | ||||||||||
|
Amortized cost
|
||||||||||||||||||||
|
Non-Agency RMBS
|
||||||||||||||||||||
|
Senior
|
$ | - | $ | 28,900 | $ | 59,922 | $ | - | $ | 88,822 | ||||||||||
|
Senior interest-only
|
1,017 | 131,159 | 117,008 | 34,087 | 283,271 | |||||||||||||||
|
Subordinated
|
2,877 | 50,483 | 243,350 | 43,522 | 340,232 | |||||||||||||||
|
Subordinated interest-only
|
- | - | 13,344 | 1,322 | 14,666 | |||||||||||||||
|
RMBS transferred to consolidated VIEs
|
4,744 | 211,925 | 1,356,981 | 501,978 | 2,075,628 | |||||||||||||||
|
Agency RMBS
|
122 | 19,433 | 1,880,430 | 127,751 | 2,027,736 | |||||||||||||||
|
Total amortized cost
|
$ | 8,760 | $ | 441,900 | $ | 3,671,035 | $ | 708,660 | $ | 4,830,355 | ||||||||||
|
December 31, 2012
|
||||||||||||||||||||
|
(dollars in thousands)
|
||||||||||||||||||||
|
Weighted Average Life
|
||||||||||||||||||||
|
Less than one
year
|
Greater than one
year and less than
five years
|
Greater than five
years and less
than ten years
|
Greater than ten
years
|
Total
|
||||||||||||||||
|
Fair value
|
||||||||||||||||||||
|
Non-Agency RMBS
|
||||||||||||||||||||
|
Senior
|
$ | - | $ | - | $ | 88 | $ | - | $ | 88 | ||||||||||
|
Senior interest-only
|
358 | 47,205 | 66,927 | 8,379 | 122,869 | |||||||||||||||
|
Subordinated
|
4,092 | 23,948 | 359,310 | 160,444 | 547,794 | |||||||||||||||
|
Subordinated interest-only
|
- | - | 9,658 | 6,595 | 16,253 | |||||||||||||||
|
RMBS transferred to consolidated VIEs
|
12,118 | 312,690 | 2,055,568 | 893,828 | 3,274,204 | |||||||||||||||
|
Agency RMBS
|
146 | 1,802,720 | 3,831 | - | 1,806,697 | |||||||||||||||
|
Total fair value
|
$ | 16,714 | $ | 2,186,563 | $ | 2,495,382 | $ | 1,069,246 | $ | 5,767,905 | ||||||||||
|
Amortized cost
|
||||||||||||||||||||
|
Non-Agency RMBS
|
||||||||||||||||||||
|
Senior
|
$ | - | $ | - | $ | 72 | $ | - | $ | 72 | ||||||||||
|
Senior interest-only
|
657 | 58,037 | 70,044 | 7,130 | 135,868 | |||||||||||||||
|
Subordinated
|
2,649 | 20,593 | 318,422 | 131,385 | 473,049 | |||||||||||||||
|
Subordinated interest-only
|
- | - | 11,051 | 5,129 | 16,180 | |||||||||||||||
|
RMBS transferred to consolidated VIEs
|
11,184 | 248,699 | 1,493,647 | 683,518 | 2,437,048 | |||||||||||||||
|
Agency RMBS
|
157 | 1,716,964 | 3,474 | - | 1,720,595 | |||||||||||||||
|
Total amortized cost
|
$ | 14,647 | $ | 2,044,293 | $ | 1,896,710 | $ | 827,162 | $ | 4,782,812 | ||||||||||
The Non-Agency RMBS portfolio is subject to credit risk. The Company seeks to mitigate credit risk through its asset selection process. The Non-Agency RMBS portfolio is primarily collateralized by what the Company classifies as Alt-A first lien mortgages. The Company categorizes collateral as Alt-A regardless of whether the loans were originally described as “prime” if the behavior of the collateral when the Company purchased the security more typically resembles Alt-A. The Company defines Alt-A collateral characteristics to be evidenced by the 60+ day delinquency bucket of the pool being greater than 5% and the weighted average FICO scores at the time of origination as greater than 650. At December 31, 2013, 97.1% of the Non-Agency RMBS collateral was Alt-A. At December 31, 2012, 99.5% of the Non-Agency RMBS collateral was Alt-A.
The Non-Agency RMBS in the Portfolio have the following collateral characteristics at December 31, 2013 and 2012.
F-22
|
December 31, 2013
|
December 31, 2012
|
||||||||||
|
Weighted average maturity (years)
|
24.1 | 24.8 | |||||||||
|
Weighted average amortized loan to value (1)
|
69.4 | % | 71.6 | % | |||||||
|
Weighted average FICO (2)
|
710 | 717 | |||||||||
|
Weighted average loan balance (in thousands)
|
$ | 385.0 | $ | 453.1 | |||||||
|
Weighted average percentage owner occupied
|
84.0 | % | 85.1 | % | |||||||
|
Weighted average percentage single family residence
|
65.4 | % | 65.5 | % | |||||||
|
Weighted average current credit enhancement
|
1.6 | % | 3.1 | % | |||||||
|
Weighted average geographic concentration of top five states
|
CA
|
33.4 | % |
CA
|
36.7 | % | |||||
|
FL
|
9.1 | % |
FL
|
8.7 | % | ||||||
|
NY
|
7.1 | % |
NY
|
6.4 | % | ||||||
|
NJ
|
3.0 | % |
VA
|
2.4 | % | ||||||
|
MD
|
2.7 | % |
NJ
|
2.8 | % | ||||||
|
(1) Value represents appraised value of the collateral at the time of loan origination.
|
|||||||||||
|
(2) FICO as determined at the time of loan origination.
|
|||||||||||
The table below presents the origination year of the underlying loans related to the Company’s portfolio of Non-Agency RMBS at December 31, 2013 and 2012.
|
Origination Year
|
December 31, 2013
|
December 31, 2012
|
||||||
|
2000
|
0.6 | % | 0.2 | % | ||||
|
2001
|
1.2 | % | 0.2 | % | ||||
|
2002
|
1.0 | % | 0.0 | % | ||||
|
2003
|
1.4 | % | 0.4 | % | ||||
|
2004
|
3.6 | % | 0.6 | % | ||||
|
2005
|
17.8 | % | 14.3 | % | ||||
|
2006
|
32.2 | % | 34.6 | % | ||||
|
2007
|
40.1 | % | 46.7 | % | ||||
|
2008
|
2.1 | % | 3.0 | % | ||||
|
Total
|
100.0 | % | 100.0 | % | ||||
Gross realized gains and losses are recorded in “Net realized gains (losses) on sales of investments” on the Company’s Consolidated Statements of Operations and Comprehensive Income. The proceeds and gross realized gains and gross realized losses from sales of investments for the years ended December 31, 2013, 2012 and 2011 are as follows:
|
For the Year Ended
|
||||||||||||
|
December 31, 2013
|
December 31, 2012
|
December 31, 2011
|
||||||||||
|
(dollars in thousands)
|
||||||||||||
|
Proceeds from sales
|
$ | 1,079,649 | $ | 943,350 | $ | 2,628,994 | ||||||
|
Gross realized gains
|
72,946 | 85,166 | 54,353 | |||||||||
|
Gross realized losses
|
(4,839 | ) | - | - | ||||||||
|
Net realized gain
|
$ | 68,107 | $ | 85,166 | $ | 54,353 | ||||||
During the year ended December 31, 2013, we realized a loss due to a full principal paydown of a Non-Agency RMBS for which we owned the IO strip. This resulted in a realized loss of $18.3 million and is reflected as a realized loss in a separate line item in the statement of operations and comprehensive income.
4. Securitized Loans Held for Investment
The Company is considered to be the primary beneficiary of VIEs formed for the purpose of securitizing whole mortgage loans. Refer to Note 8 for additional details regarding the Company’s involvement with VIEs.
The securitized loans held for investment are carried at their principal balance outstanding, plus unamortized premiums, less unaccreted discounts and an allowance for loan losses. There were no new securitizations during the year ended December 31, 2013. During the year ended December 31, 2012, the Company consolidated the CSMC 2012-CIM1, CSMC 2012-CIM2, and CSMC 2012-CIM3 Trusts (the “CSMC Trusts”). The CSMC Trusts are securitizations collateralized by high quality, jumbo, prime, residential mortgage loans. The Company transferred $1.5 billion in principal value to the CSMC Trusts that was recorded as a secured borrowing pursuant to ASC 860. In these transactions, the Company financed $1.4 Billion of AAA-rated, AA-rated, and A-rated fixed rate bonds by selling the bonds to third party investors for net proceeds of $1.4 billion.
The following table provides a summary of the changes in the carrying value of securitized loans held for investment at December 31, 2013 and 2012:
F-23
|
For the Year Ended
|
||||||||
|
December 31, 2013
|
December 31, 2012
|
|||||||
| (dollars in thousands) | ||||||||
|
Balance, beginning of period
|
$ | 1,300,131 | $ | 256,632 | ||||
|
Purchases
|
- | 1,531,014 | ||||||
|
Principal paydowns
|
(507,683 | ) | (477,555 | ) | ||||
|
Net periodic amortization (accretion)
|
(10,763 | ) | (9,592 | ) | ||||
|
Change to loan loss provision
|
1,799 | (368 | ) | |||||
|
Balance, end of period
|
$ | 783,484 | $ | 1,300,131 | ||||
The following table represents the Company’s securitized residential mortgage loans classified as held for investment at December 31, 2013 and 2012:
|
December 31, 2013
|
December 31, 2012
|
|||||||
| (dollars in thousands) | ||||||||
|
Securitized loans, at amortized cost
|
$ | 792,547 | $ | 1,311,755 | ||||
|
Less: allowance for loan losses
|
9,063 | 11,624 | ||||||
|
Securitized loans held for investment
|
$ | 783,484 | $ | 1,300,131 | ||||
The securitized loan portfolio is collateralized by prime, jumbo, first lien residential mortgages of which 39.5% were originated during 2012, 37.8% were originated during 2011, 6.9% during 2010, and the remaining 15.8% of the loans were originated prior to 2010. A summary of key characteristics of these loans follows.
|
December 31, 2013
|
December 31, 2012
|
||||||||||
|
Number of loans
|
1,053 | 1,618 | |||||||||
|
Weighted average maturity (years)
|
27.3 | 28.3 | |||||||||
|
Weighted average loan to value (1)
|
71.7 | % | 71.2 | % | |||||||
|
Weighted average FICO (2)
|
766 | 768 | |||||||||
|
Weighted average loan balance (in thousands)
|
$ | 737.0 | $ | 794.1 | |||||||
|
Weighted average percentage owner occupied
|
94.7 | % | 94.6 | % | |||||||
|
Weighted average percentage single family residence
|
70.0 | % | 70.6 | % | |||||||
|
Weighted average geographic concentration of top five states
|
CA
|
34.7 | % |
CA
|
38.1 | % | |||||
|
VA
|
5.6 | % |
VA
|
6.3 | % | ||||||
|
NY
|
5.5 | % |
NY
|
6.3 | % | ||||||
|
NJ
|
5.1 | % |
WA
|
5.2 | % | ||||||
|
TX
|
4.9 | % |
NJ
|
4.6 | % | ||||||
|
(1) Value represents appraised value of the collateral at the time of loan origination.
|
|||||||||||
|
(2) FICO as determined at the time of loan origination.
|
|||||||||||
The following table summarizes the changes in the allowance for loan losses for the securitized mortgage loan portfolio at December 31, 2013, 2012 and 2011:
|
For the Year Ended
|
||||||||||||
|
December 31, 2013
|
December 31, 2012
|
December 31, 2011
|
||||||||||
|
(dollars in thousands)
|
||||||||||||
|
Balance, beginning of period
|
$ | 11,624 | $ | 13,938 | $ | 11,006 | ||||||
|
Provision for loan losses
|
(1,799 | ) | 368 | 5,291 | ||||||||
|
Charge-offs
|
(762 | ) | (2,682 | ) | (2,359 | ) | ||||||
|
Balance, end of period
|
$ | 9,063 | $ | 11,624 | $ | 13,938 | ||||||
The Company has established an allowance for loan losses related to securitized loans that is composed of a general and specific reserve. The balance in the allowance for loan losses related to the general reserve at December 31, 2013, 2012 and 2011 was $3.7 million, $5.0 million, and $6.3 million, respectively. The balance in the allowance for loan losses related to the specific reserve at December 31, 2013, 2012 and 2011 was $5.4 million, $6.6 million and $7.6 million, respectively.
The total unpaid principal balance of impaired loans for which the Company established a specific reserve was $25.7 million, $29.1 million and $32.9 at December 31, 2013, 2012 and 2011, respectively. The Company’s recorded investment in impaired loans for which there is a related allowance for credit losses at December 31, 2013, 2012 and 2011 was $18.7 million, $21.8 million and $14.3 million, respectively. The total unpaid principal balance of non-impaired loans for which the Company established a general reserve was $750.4 million, $1.3 billion and $235.2 million at December 31, 2013, 2012 and 2011, respectively. The Company’s recorded investment in loans that are not impaired for which there is a related general reserve for credit losses at December 31, 2103, 2012 and 2011 was $764.8 million, $1.3 billion and $228.9 million, respectively. Interest income on impaired loans is not significant.
F-24
The following table summarizes the outstanding principal balance of loans 30 days delinquent and greater as reported by the servicer at December 31, 2013 and 2012.
|
30 Days
Delinquent
|
60 Days
Delinquent
|
90+ Days
Delinquent
|
Bankruptcy
|
Foreclosure
|
REO
|
Total
|
||||||||||||||||||||||
| (dollars in thousands) | ||||||||||||||||||||||||||||
|
December 31, 2013
|
$ | 999 | $ | 570 | $ | 2,087 | $ | 473 | $ | 7,530 | $ | 1,179 | $ | 12,838 | ||||||||||||||
|
December 31, 2012
|
$ | 3,110 | $ | 1,186 | $ | 4,045 | $ | 0 | $ | 4,247 | $ | 1,390 | $ | 13,978 | ||||||||||||||
With the exception of its ability to approve certain loan modifications, the Company is not involved with the servicing or modification of loans held for investment. The trustee and servicer of the respective securitization are responsible for servicing and modifying these loans. The Company is required to make certain assumptions in accounting for loans held for investment due to the limitation of information available to the Company. The following table presents the loans that were modified by the servicer during the years ended December 31, 2013 and 2012.
|
Number of Loans Modified During Period
|
Unpaid Principal Balance of Modified Loans (Pre-modification)
|
Unpaid Principal Balance of Modified Loans (Post-modification)
|
Amortized Cost of Modified Loans
|
Amortized Cost of Modified Loans For Which There is an Allowance for
Loan Losses
|
Amortized Cost of Modified Loans For Which There is No Allowance for
Loan Losses
|
|||||||||||||||||||
|
(dollars in thousands)
|
||||||||||||||||||||||||
|
Year Ended
|
||||||||||||||||||||||||
|
December 31, 2013
|
3 | $ | 2,349 | $ | 2,358 | $ | 2,248 | $ | 2,248 | $ | 0 | |||||||||||||
|
December 31, 2012
|
9 | $ | 5,163 | $ | 5,312 | $ | 5,256 | $ | 5,256 | $ | 0 | |||||||||||||
Loans are modified by the servicer as a method of loss mitigation. Based on the information available, during the year ended December 31, 2013, the Company determined that all loans modified by the servicer were considered TDRs, as defined under GAAP. A TDR is generally any modification of a loan to a borrower that is experiencing financial difficulties, where a lender agrees to terms that are more favorable to the borrower than are otherwise available in the current market. All loan modifications during the years ended December 31, 2013 and 2012 included a reduction of the stated interest rates. Loans modified by the servicer have been individually assessed for impairment and measurement of impairment is based on the excess of the recorded investment in the loan over the present value of the expected cash flows, post modification, discounted at the loan’s effective interest rate at inception. In the absence of additional loan modifications by the servicer in future periods that are considered to be TDRs, the $4.5 million specific reserve related to TDRs as of December 31, 2013 will be recognized in net income in future periods by way of a decrease in the provision for loan losses. If there are further modifications, the reduction of the cashflow is reflected in the provision for loan losses.
As of December 31, 2013, there were no loans that were modified in the past twelve months and delinquent on scheduled payments.
5. Fair Value Measurements
The Company follows fair value guidance in accordance with GAAP to account for its financial instruments. The Company categorizes its financial instruments, based on the priority of the inputs to the valuation technique, into a three-level fair value hierarchy. The fair value hierarchy gives the highest priority to quoted prices in active markets for identical assets or liabilities (Level 1) and the lowest priority to unobservable inputs (Level 3). If the inputs used to measure the financial instruments fall within different levels of the hierarchy, the categorization is based on the lowest level input that is significant to the fair value measurement of the instrument. Financial assets and liabilities recorded at fair value on the Consolidated Statements of Financial Condition or disclosed in the related notes are categorized based on the inputs to the valuation techniques as follows:
Level 1 – inputs to the valuation methodology are quoted prices (unadjusted) for identical assets and liabilities in active markets.
Level 2 – inputs to the valuation methodology include quoted prices for similar assets and liabilities in active markets, and inputs that are observable for the asset or liability, either directly or indirectly, for substantially the full term of the financial instrument.
Level 3 – inputs to the valuation methodology are unobservable and significant to fair value.
F-25
Fair value measurements categorized within Level 3 are sensitive to changes in the assumptions or methodology used to determine fair value and such changes could result in a significant increase or decrease in the fair value. For the Company’s investments in Non-Agency RMBS categorized within Level 3 of the fair value hierarchy, the significant unobservable inputs include the discount rates, assumptions relating to prepayments, default rates and loss severities. Significant increases (decreases) in any of the discount rates, default rates or loss severities in isolation would result in a significantly lower (higher) fair value measurement. The impact of changes in prepayment speeds would have differing impacts on fair value, depending on the seniority of the investment. Generally, a change in the default assumption is accompanied by directionally similar changes in the assumptions used for the loss severity and the prepayment speed.
Any changes to the valuation methodology are reviewed by management to ensure the changes are appropriate. As markets and products evolve and the pricing for certain products becomes more transparent, the Company will continue to refine its valuation methodologies. The methodology utilized by the Company for the periods presented is unchanged. The methods used to produce a fair value calculation may not be indicative of net realizable value or reflective of future fair values. Furthermore, while the Company believes its valuation methods are appropriate and consistent with other market participants, the use of different methodologies, or assumptions, to determine the fair value of certain financial instruments could result in a different estimate of fair value at the reporting date. The Company uses inputs that are current as of the measurement date, which may include periods of market dislocation, during which price transparency may be reduced.
During times of market dislocation, as has been experienced for some time and continues to exist, the observability of prices and inputs can be difficult for certain Non-Agency RMBS. If third party pricing services are unable to provide a price for an asset, or if the price provided by them is deemed unreliable by the Company, then the asset will be valued at its fair value as determined by the Company without validation to third-party pricing. In addition, validating third party pricing for the Company’s investments may be more subjective as fewer participants may be willing to provide this service to the Company. Illiquid investments typically experience greater price volatility as an active market does not exist. Observability of prices and inputs can vary significantly from period to period and may cause instruments to change classifications within the three level hierarchy.
A description of the methodologies utilized by the Company to estimate the fair value of its financial instruments by instrument class follows:
Short-term Instruments
The carrying value of cash and cash equivalents, accrued interest receivable, dividends payable, and accrued interest payable are considered to be a reasonable estimate of fair value due to the short term nature of these financial instruments.
Agency and Non-Agency RMBS
Generally, the Company determines the fair value of its investment securities utilizing an internal pricing model that incorporates such factors as coupon, prepayment speeds, weighted average life, collateral composition, borrower characteristics, expected interest rates, life caps, periodic caps, reset dates, collateral seasoning, expected losses, expected default severity, credit enhancement, and other pertinent factors. Management reviews the fair values generated by the model to determine whether prices are reflective of the current market. Management indirectly corroborates its estimates of the fair value using pricing models by comparing its results to independent prices provided by dealers in the securities and/or third party pricing services. Certain very liquid asset classes, such as Agency fixed-rate pass-throughs may be priced using independent sources such as quoted prices for To-Be-Announced (“TBA”) securities.
The Agency RMBS market is considered to be an active market such that participants transact with sufficient frequency and volume to provide transparent pricing information on an ongoing basis. The liquidity of the Agency RMBS market and the similarity of the Company’s securities to those actively traded enable the Company to observe quoted prices in the market and utilize those prices as a basis for formulating fair value measurements. Consequently, the Company has classified Agency RMBS as having Level 2 inputs in the fair value hierarchy.
F-26
The Company’s fair value estimation process for Non-Agency RMBS utilizes inputs other than quoted prices that are observed in the market. The Company’s estimate of prepayment, default and severity curves all involve Management judgment and assumptions that are deemed to be significant to the fair value measurement process, which renders the resulting Non-Agency RMBS fair value estimates Level 3 inputs in the fair value hierarchy.
Derivatives
Interest Rate Swaps
The Company utilizes dealer quotes to determine the fair values of its interest rate swaps. The Company compares the dealer quotations received to its own estimate of fair value to evaluate for reasonableness. The dealer quotes incorporate common market pricing methods, including a spread measurement to the Treasury yield curve or interest rate swap curve as well as underlying characteristics of the particular contract. Interest rate swaps are modeled by the Company by incorporating such factors as the term to maturity, Treasury curve, overnight index swap rates, and the payment rates on the fixed portion of the interest rate swaps. The Company has classified the characteristics used to determine the fair value of interest rate swaps as Level 2 inputs in the fair value hierarchy.
Treasury Futures
The fair value of Treasury futures is determined by quoted market prices for similar financial instruments in an active market. The Company has classified the characteristics used to determine the fair value of Treasury futures as Level 2 inputs in the fair value hierarchy.
The Company’s financial assets and liabilities carried at fair value on a recurring basis, including the level in the fair value hierarchy, at December 31, 2013 and 2012 is presented below.
|
December 31, 2013
|
||||||||||||
|
(dollars in thousands)
|
||||||||||||
|
Level 1
|
Level 2
|
Level 3
|
||||||||||
|
(dollars in thousands)
|
||||||||||||
|
Assets:
|
||||||||||||
|
Non-Agency RMBS
|
||||||||||||
|
Senior
|
$ | - | $ | - | $ | 89,687 | ||||||
|
Senior interest-only
|
- | - | 229,065 | |||||||||
|
Subordinated
|
- | - | 457,569 | |||||||||
|
Subordinated interest-only
|
- | - | 16,571 | |||||||||
|
RMBS transferred to consolidated VIEs
|
- | - | 2,981,571 | |||||||||
|
Agency RMBS
|
- | 1,997,578 | - | |||||||||
|
Derivatives
|
- | 8,095 | - | |||||||||
|
Liabilities:
|
||||||||||||
|
Derivatives
|
- | (30,199 | ) | - | ||||||||
|
Total
|
$ | - | $ | 1,975,474 | $ | 3,774,463 | ||||||
|
December 31, 2012
|
||||||||||||
|
(dollars in thousands)
|
||||||||||||
|
Level 1
|
Level 2
|
Level 3
|
||||||||||
|
Assets:
|
||||||||||||
|
Non-Agency RMBS
|
||||||||||||
|
Senior
|
$ | - | $ | - | $ | 88 | ||||||
|
Senior interest-only
|
- | - | 122,869 | |||||||||
|
Subordinated
|
- | - | 547,794 | |||||||||
|
Subordinated interest-only
|
- | - | 16,253 | |||||||||
|
RMBS transferred to consolidated VIEs
|
- | - | 3,274,204 | |||||||||
|
Agency RMBS
|
- | 1,806,697 | - | |||||||||
|
Liabilities:
|
||||||||||||
|
Derivatives
|
- | (53,939 | ) | - | ||||||||
|
Total
|
$ | - | $ | 1,752,758 | $ | 3,961,208 | ||||||
The table below provides a summary of the changes in the fair value of securities classified as Level 3 at December 31, 2013 and 2012.
F-27
|
Fair Value Reconciliation, Level 3
|
||||||||
|
For the Year Ended
|
||||||||
|
December 31, 2013
|
December 31, 2012
|
|||||||
| (dollars in thousands) | ||||||||
|
Non-Agency RMBS
|
||||||||
|
Beginning balance Level 3 assets
|
$ | 3,961,208 | $ | 4,088,945 | ||||
|
Transfers in to Level 3 assets
|
- | - | ||||||
|
Transfers out of Level 3 assets
|
- | - | ||||||
|
Purchases
|
317,299 | 122,509 | ||||||
|
Principal payments
|
(475,092 | ) | (516,370 | ) | ||||
|
Sales
|
(191,436 | ) | (328,261 | ) | ||||
|
Accretion of purchase discounts
|
106,290
|
98,804 | ||||||
|
Gains (losses) included in net income
|
||||||||
|
Other than temporary credit impairment losses
|
(45,167 | ) | (132,250 | ) | ||||
|
Realized gains (losses) on sales
|
46,866 | 48,435 | ||||||
|
Realized losses on principal write-downs of Non-Agency RMBS
|
(18,316 | ) | - | |||||
|
Net unrealized gains (losses) on interest-only RMBS
|
(43,252 | ) | 804 | |||||
|
Gains (losses) included in other comprehensive income
|
||||||||
|
Total unrealized gains (losses) for the period
|
116,063
|
578,592 | ||||||
|
Ending balance Level 3 assets
|
$ |
3,774,463
|
$ | 3,961,208 | ||||
There were no transfers to or from Level 3 for the years ended December 31, 2013 and 2012.
Sensitivity of Significant Inputs
The significant unobservable inputs used in the fair value measurement of the Company’s Non-Agency RMBS are the weighted average discount rates, constant prepayment speed (“CPR”), cumulative default rate, and the loss severity.
Prepayment speeds, as reflected by the CPR, vary according to interest rates, the type of investment, conditions in financial markets, and other factors, none of which can be predicted with any certainty. In general, when interest rates rise, it is relatively less attractive for borrowers to refinance their mortgage loans, and as a result, prepayment speeds tend to decrease. When interest rates fall, prepayment speeds tend to increase. For RMBS investments purchased at a premium, as prepayment speeds increase, the amount of income the Company earns decreases as the purchase premium on the bonds amortizes faster than expected. Conversely, decreases in prepayment speeds result in increased income and can extend the period over which the Company amortizes the purchase premium. For RMBS investments purchased at a discount, as prepayment speeds increase, the amount of income the Company earns increases from the acceleration of the accretion of the discount into interest income. Conversely, decreases in prepayment speeds result in decreased income as the accretion of the purchase discount into interest income occurs over a longer period.
Cumulative default rates represent an annualized rate of default on a group of mortgages. The constant default rate (“CDR”) represents the percentage of outstanding principal balances in the pool that are in default, which typically equates to the home being past 60-day and 90-day notices and in the foreclosure process. When default rates increase, expected cash flows on the underlying collateral decreases. When default rates decrease, expected cash flows on the underlying collateral increases.
Loss severity rates reflect the amount of loss expected from a foreclosure and liquidation of the underlying collateral in the mortgage loan pool. When a mortgage loan is foreclosed the collateral is sold and the resulting proceeds are used to settle the outstanding obligation. In many circumstances, the proceeds from the sale do not fully repay the outstanding obligation. In these cases a loss is incurred by the lender. Loss severity is used to predict how costly future losses are likely to be. An increase in loss severity results in a decrease in expected future cashflows. A decrease in loss severity results in an increase in expected future cashflows.
The discount rate refers to the interest rate used in discounted cash flow analysis to determine the present value of future cash flows. The discount rate takes into account not just the time value of money, but also the risk or uncertainty of future cash flows. An increased uncertainty of future cash flows results in a higher discount rate. The discount rate used to calculate the present value of the expected future cash flows is based on the discount rate implicit in the security as of the last measurement date. As discount rates move up, the discounted cash flows are reduced.
A summary of the significant inputs used to estimate the fair value of Non-Agency RMBS as of December 31, 2013 and 2012 follows:
F-28
|
December 31, 2013
|
December 31, 2012
|
|||||||||||||||||||||||||||||||
|
Significant Inputs
|
Significant Inputs
|
|||||||||||||||||||||||||||||||
| Weighted | Weighted | |||||||||||||||||||||||||||||||
| Average | Loss | Average | Loss | |||||||||||||||||||||||||||||
| Discount Rate |
CPR
|
CDR | Severity | Discount Rate | CPR | CDR | Severity | |||||||||||||||||||||||||
|
Range
|
Range | |||||||||||||||||||||||||||||||
| Non-Agency RMBS | ||||||||||||||||||||||||||||||||
|
Senior
|
6.4 | % | 1% - 6 | % | 0% - 33 | % | 50% - 85 | % | 7.5 | % | 11% - 11 | % | 0% - 3 | % | 50% - 58 | % | ||||||||||||||||
|
Senior interest-only
|
14.4 | % | 1% - 28 | % | 0% - 33 | % | 50% - 85 | % | 13.9 | % | 1% - 25 | % | 0% - 25 | % | 50% - 85 | % | ||||||||||||||||
|
Subordinated
|
26.8 | % | 1% - 22 | % | 0% - 38 | % | 50% - 85 | % | 25.9 | % | 1% - 18 | % | 0% - 21 | % | 50% - 85 | % | ||||||||||||||||
|
Subordinated interest-only
|
12.7 | % | 2% - 13 | % | 0% - 18 | % | 50% - 73 | % | 13.3 | % | 4% - 11 | % | 0% - 21 | % | 50% - 68 | % | ||||||||||||||||
|
RMBS transferred to consolidated VIEs
|
5.3 | % | 1% - 20 | % | 0% - 33 | % | 50% - 85 | % | 5.8 | % | 1% - 15 | % | 0% - 36 | % | 50% - 85 | % | ||||||||||||||||
All of the significant inputs listed have some degree of market observability, based on the Company’s knowledge of the market, information available to market participants, and use of common market data sources. Collateral default and loss severity projections are in the form of “curves” that are updated quarterly to reflect the Company’s collateral cash flow projections. Methods used to develop these projections conform to industry conventions. The Company uses assumptions it considers its best estimate of future cash flows for each respective security.
The discount rates applied to the expected cash flows to determine fair value are derived from a range of observable prices on securities backed by similar collateral. As the market becomes more or less liquid, the availability of these observable inputs will change.
The prepayment speed specifies the percentage of the collateral balance that is expected to prepay at each point in the future. The prepayment speed is based on factors such as collateral FICO score, loan-to-value ratio, debt-to-income ratio, and vintage on a loan level basis and is scaled up or down to reflect recent collateral-specific prepayment experience as obtained from remittance reports and market data services.
Default vectors are determined from the current “pipeline” of loans that are more than 30 days delinquent, in foreclosure, bankruptcy, or are real estate owned (“REO”). These delinquent loans determine the first 30 months of the default curve. Beyond month 30, the default curve transitions to a value that is reflective of a portion of the current delinquency pipeline.
The curve generated to reflect the Company’s expected loss severity is based on collateral-specific experience with consideration given to other mitigating collateral characteristics. Characteristics such as seasoning are taken into consideration because severities tend to initially increase on newly originated securities, before beginning to decline as the collateral ages and eventually stabilizes. Collateral characteristics such as loan size, loan-to-value, and geographic location of collateral also effect loss severity.
Securitized Loans Held for Investment
The Company carries securitized loans held for investment at principal value, plus unamortized premiums, less unaccreted discounts and an allowance for loan losses. The Company estimates the fair value of its securitized loans held for investment by considering the loan characteristics, including the credit characteristics of the borrower, purpose of the loan, use of the collateral securing the loan, and management’s expectations of general economic conditions in the sector and greater economy.
Repurchase Agreements
Repurchase agreements are collateralized financing transactions utilized by the Company to acquire investment securities. Due to the short term nature of these financial instruments, the Company estimates the fair value of these repurchase agreements using the contractual obligation plus accrued interest payable at maturity.
Securitized Debt, Non-Agency RMBS Transferred to Consolidated VIEs and Securitized Debt, Loans Held for Investment
The Company records securitized debt for certificates or notes financed without recourse to the Company in securitization or re-securitization transactions treated as secured borrowings. The Company carries securitized debt at the principal balance outstanding plus unamortized premiums, less unaccreted discounts recorded in connection with the financing of the loans or RMBS with third parties. The premiums or discounts associated with the financing of the notes or certificates are amortized over the contractual life of the instrument using the interest method. The Company estimates the fair value of securitized debt by estimating the future cash flows associated with the underlying assets collateralizing the secured debt outstanding. The Company models the fair value of each underlying asset by considering, among other items, the structure of the underlying security, coupon, servicer, actual and expected defaults, actual and expected default severities, reset indices, and prepayment speeds in conjunction with market research for similar collateral performance and management’s expectations of general economic conditions in the sector and other economic factors.
F-29
The following table presents the carrying value and fair value, as described above, of the Company’s financial instruments not carried at fair value on a recurring basis at December 31, 2013 and 2012.
|
December 31, 2013
|
||||||||||||
|
(dollars in thousands)
|
||||||||||||
|
Level in Fair Value Hierarchy
|
Carrying Amount
|
Fair Value
|
||||||||||
|
Securitized loans held for investment
|
3 | 783,484 | 762,550 | |||||||||
|
Repurchase agreements
|
2 | (1,658,561 | ) | (1,660,941 | ) | |||||||
|
Securitized debt, collateralized by Non-Agency RMBS
|
3 | (933,732 | ) | (940,712 | ) | |||||||
|
Securitized debt, collateralized by loans held for investment
|
3 | (669,981 | ) | (647,628 | ) | |||||||
|
December 31, 2012
|
||||||||||||
|
(dollars in thousands)
|
||||||||||||
|
Level in Fair Value Hierarchy
|
Carrying Amount
|
Fair Value
|
||||||||||
|
Securitized loans held for investment
|
3 | 1,300,131 | 1,320,696 | |||||||||
|
Repurchase agreements
|
2 | (1,528,025 | ) | (1,531,511 | ) | |||||||
|
Securitized debt, collateralized by Non-Agency RMBS
|
3 | (1,336,261 | ) | (1,334,551 | ) | |||||||
|
Securitized debt, collateralized by loans held for investment
|
3 | (1,169,710 | ) | (1,194,747 | ) | |||||||
6. Repurchase Agreements
The Company had outstanding $1.7 billion and $1.5 billion of repurchase agreements with weighted average borrowing rates of 0.44% and 0.52% and weighted average remaining maturities of 58 days and 56 days as of December 31, 2013 and 2012, respectively. At December 31, 2013 and 2012, Agency RMBS pledged as collateral under these repurchase agreements had an estimated fair value of $1.7 billion and $1.6 billion, respectively. The average daily balances of the Company’s repurchase agreements for the years ended December 31, 2013 and 2012 were $1.5 billion and $2.1 billion, respectively. The interest rates of these repurchase agreements are generally indexed to the one-month or the three-month LIBOR rate and re-price accordingly.
At December 31, 2013 and 2012, the repurchase agreements collateralized by Agency RMBS had the following remaining maturities.
|
December 31, 2013
|
December 31, 2012
|
|||||||
|
(dollars in thousands)
|
||||||||
|
Overnight
|
$ | - | $ | - | ||||
|
1-29 days
|
644,332 | 732,809 | ||||||
|
30 to 59 days
|
606,945 | 325,915 | ||||||
|
60 to 89 days
|
- | - | ||||||
|
90 to 119 days
|
129,049 | 211,137 | ||||||
|
Greater than or equal to 120 days
|
278,235 | 258,164 | ||||||
|
Total
|
$ | 1,658,561 | $ | 1,528,025 | ||||
At December 31, 2013 and 2012, the Company did not have an amount at risk under its repurchase agreements greater than 10% of its equity with any counterparty.
7. Securitized Debt
All of the Company’s securitized debt is collateralized by residential mortgage loans or Non-Agency RMBS. For financial reporting purposes, the Company’s securitized debt is accounted for as secured borrowings. Thus, the residential mortgage loans or RMBS held as collateral are recorded in the assets of the Company as securitized loans held for investment or Non-Agency RMBS transferred to consolidated VIEs and the securitized debt is recorded as a non-recourse liability in the accompanying Consolidated Statements of Financial Condition.
F-30
At December 31, 2013 the Company’s securitized debt collateralized by residential mortgage loans had a principal balance of $670.4 million. The debt matures between the years 2023 and 2042. At December 31, 2013 the debt carried a weighted average cost of financing equal to 3.31%. At December 31, 2012 the Company’s securitized debt collateralized by residential mortgage loans had a principal balance of $1.2 billion. The debt matures between the years 2023 and 2042. At December 31, 2012 the debt carried a weighted average cost of financing equal to 3.37%.
At December 31, 2013 the Company’s securitized debt collateralized by Non-Agency RMBS had a principal balance of $966.4 million. The debt matures between the years 2035 and 2047. At December 31, 2013 the debt carried a weighted average cost of financing equal to 4.26%. At December 31, 2012 the Company’s securitized debt collateralized by Non-Agency RMBS had a principal balance of $1.4 billion. The debt matures between the years 2035 and 2047. At December 31, 2012 the debt carried a weighted average cost of financing equal to 4.41%.
The carrying value of securitized debt is based on its amortized cost, net of premiums or discounts related to sales of senior certificates to third parties. The following table presents the estimated principal repayment schedule of the securitized debt at December 31, 2013 and 2012, based on expected cash flows of the residential mortgage loans or RMBS, as adjusted for projected losses on the underlying collateral of the debt. All of the securitized debt recorded in the Company’s Consolidated Statements of Financial Condition is non-recourse to the Company.
|
December 31, 2013
|
December 31, 2012
|
|||||||
|
(dollars in thousands)
|
||||||||
|
Within One Year
|
$ | 370,250 | $ | 658,423 | ||||
|
One to Three Years
|
497,943 | 793,150 | ||||||
|
Three to Five Years
|
264,456 | 430,993 | ||||||
|
Greater Than or Equal to Five Years
|
396,916 | 555,717 | ||||||
|
Total
|
$ | 1,529,565 | $ | 2,438,283 | ||||
Maturities of the Company’s securitized debt are dependent upon cash flows received from the underlying loans. The estimate of their repayment is based on scheduled principal payments on the underlying loans. This estimate will differ from actual amounts to the extent prepayments and/or loan losses are experienced. See Notes 3 and 4 for a more detailed discussion of the securities and loans collateralizing the securitized debt.
8. Consolidated Securitization Vehicles and Other Variable Interest Entities
Since its inception, the Company has created VIEs for the purpose of securitizing whole mortgage loans or re-securitizing RMBS and obtaining permanent, non-recourse term financing. The Company evaluated its interest in each VIE to determine if it is the primary beneficiary.
As of December 31, 2013, the Company’s Consolidated Statements of Financial Condition includes ten consolidated VIEs with $3.8 billion of assets and $1.6 billion of liabilities. As of December 31, 2012, the Company’s Consolidated Statements of Financial Condition includes ten consolidated VIEs with $4.6 billion of assets and $2.5 billion of liabilities.
VIEs for Which the Company is the Primary Beneficiary
The retained beneficial interests in VIEs for which the Company is the primary beneficiary are typically the subordinated tranches of these re-securitizations and in some cases the Company may hold interests in additional tranches. The result of consolidation at December 31, 2013 is the inclusion of $3.0 billion of Non-Agency RMBS at fair value representing the underlying securities of the trusts, the inclusion of $783.5 million of securitized loans held for investment, the recognition of $933.7 million of securitized debt associated with Non-Agency RMBS transferred to consolidated VIEs and $670.0 million of securitized debt associated with loans held for investment. In addition, at December 31, 2013 the Company recognized $17.2 million and $5.3 million of accrued interest receivable and accrued interest payable, respectively, of the securitizations.
F-31
The table below reflects the assets and liabilities recorded in the Consolidated Statements of Financial Condition related to the consolidated VIEs as of December 31, 2013 and 2012.
|
December 31, 2013
|
December 31, 2012
|
|||||||
|
(dollars in thousands)
|
||||||||
|
Assets
|
||||||||
|
Non-Agency RMBS transferred to consolidated VIEs
|
$ | 2,981,571 | $ | 3,274,204 | ||||
|
Securitized loans held for investment
|
783,484 | 1,300,131 | ||||||
|
Accrued interest receivable
|
17,173 | 24,082 | ||||||
|
Liabilities
|
||||||||
|
Securitized debt, collateralized by Non-Agency RMBS
|
$ | 933,732 | $ | 1,336,261 | ||||
|
Securitized debt, collateralized by loans held for investment
|
669,981 | 1,169,710 | ||||||
|
Accrued interest payable
|
5,278 | 8,358 | ||||||
Income and expense and OTTI amounts related to consolidated VIEs recorded in the Consolidated Statements of Operations and Comprehensive Income (Loss) is presented in the table below.
|
For the Year Ended
|
||||||||||||
|
December 31, 2013
|
December 31, 2012
|
December 31, 2011
|
||||||||||
|
(dollars in thousands)
|
||||||||||||
|
Interest income, Assets of consolidated VIEs
|
$ | 371,559 | $ | 417,351 | $ | 450,996 | ||||||
|
Interest expense, Non-recourse liabilities of VIEs
|
(95,229 | ) | (115,880 | ) | (122,917 | ) | ||||||
|
Net interest income
|
$ | 276,330 | $ | 301,471 | $ | 328,079 | ||||||
|
Total other-than-temporary impairment losses
|
(4,170 | ) | $ | (7,619 | ) | $ | (113,047 | ) | ||||
|
Portion of loss recognized in other comprehensive income (loss)
|
(33,749 | ) |
(76,699
|
) | (145,512 | ) | ||||||
|
Net other-than-temporary credit impairment losses
|
$ | (37,919 | ) | $ | (84,318 | ) | $ | (258,559 | ) | |||
The amounts recorded on the Consolidated Statements of Cash Flows related to consolidated VIEs is presented in the table below for the periods presented.
|
For the Year Ended
|
||||||||||||
|
December 31, 2013
|
December 31, 2012
|
December 31, 2011
|
||||||||||
| (dollars in thousands) | ||||||||||||
|
Amortization of deferred financing costs
|
5,691 | 8,546 | $ | 1,733 | ||||||||
|
Accretion (amortization) of securitized debt discounts/premiums, net
|
11,981 | 6,985 | 12,551 | |||||||||
|
Payment of deferred financing costs
|
- | (9,488 | ) | - | ||||||||
|
Proceeds from securitized debt borrowings, collateralized by loans held for investment
|
- | 1,426,983 | - | |||||||||
|
Principal payments, Non-Agency RMBS transferred to consolidated VIE's
|
466,522 | 505,779 | 668,924 | |||||||||
|
Principal payments, Securitized loans held for investment
|
507,683 | 477,555 | 85,526 | |||||||||
|
Payments on securitized debt borrowings, collateralized by loans held for investment
|
(499,549 | ) | (470,788 | ) | (80,181 | ) | ||||||
|
Proceeds from securitized debt borrowings, collateralized by Non-Agency RMBS
|
- | 181,201 | 310,972 | |||||||||
|
Payments on securitized debt borrowings, collateralized by Non-Agency RMBS
|
(414,690 | ) | (481,464 | ) | (645,603 | ) | ||||||
|
Decrease (increase) in accrued interest receivable
|
6,909 | 2,534 | (4,832 | ) | ||||||||
|
Increase (decrease) in accrued interest payable
|
(3,080 | ) | 228 | (1,836 | ) | |||||||
|
Net cash provided by/(used in) consolidated VIEs
|
$ | 81,467 | $ | 1,648,071 | $ | 347,254 | ||||||
VIEs for Which the Company is Not the Primary Beneficiary
The Company has interests in the following VIEs in addition to the RMBS described in Note 3.
The Company’s involvement with VIEs for which it is not considered the primary beneficiary generally is in the form of owning securities issued by the trusts, similar to its investments in other RMBS that do not provide the Company with a controlling financial interest. The Company’s maximum exposure to loss does not include other-than-temporary impairments or other write-downs that the Company previously recognized through earnings.
The table below represents the carrying amounts and classification of assets recorded on the Company’s consolidated financial statements related to its variable interests in non-consolidated VIEs, as well as its maximum exposure to loss as a result of its involvement with these VIEs, which is represented by the fair value of the Company’s investments in the trusts.
F-32
|
December 31, 2013
|
December 31, 2012
|
|||||||||||||||
|
Amortized Cost
|
Fair Value
|
Amortized Cost
|
Fair Value
|
|||||||||||||
|
(dollars in thousands)
|
||||||||||||||||
|
Assets
|
||||||||||||||||
|
Non-Agency RMBS
|
||||||||||||||||
|
Senior
|
$ | 59 | $ | 68 | $ | 72 | $ | 85 | ||||||||
|
Senior interest-only
|
- | 75 | - | 128 | ||||||||||||
|
Subordinated
|
- | 1,731 | 581 | 2,266 | ||||||||||||
|
Agency RMBS
|
666 | 437 | 1,198 | 1,001 | ||||||||||||
|
Total
|
$ | 725 | $ | 2,311 | $ | 1,851 | $ | 3,480 | ||||||||
9. Derivative Instruments
In connection with the Company’s interest rate risk management strategy, the Company economically hedges a portion of its interest rate risk by entering into derivative financial instrument contracts in the form of interest rate swaps. The Company’s swaps are used to lock in a fixed rate related to a portion of its current and anticipated payments on its repurchase agreements. The Company typically agrees to pay a fixed rate of interest (“pay rate”) in exchange for the right to receive a floating rate of interest (“receive rate”) over a specified period of time. In addition to interest rate swaps, the Company has purchased mortgage options and Treasury futures. Mortgage options give the Company the right, but not the obligation, to buy or sell mortgage backed securities at a future date for a fixed price. Treasury futures are derivatives which track the prices of specific Treasury securities and are traded on an active exchange. It is generally the Company’s policy to close out any Treasury futures positions prior to taking delivery of the underlying security. The Company has invested in mortgage options and Treasury futures to lock in prices on the purchase or sale of Agency RMBS, to hedge changes in interest rates on its existing portfolio, or to enhance investment returns.
The use of derivatives creates exposure to credit risk relating to potential losses that could be recognized if the counterparties to these instruments fail to perform their obligations under the contracts. In the event of a default by the counterparty, the Company could have difficulty obtaining its RMBS or cash pledged as collateral for these derivative instruments. The Company periodically monitors the credit of its counterparties to determine if it is exposed to counterparty credit risk. See Note 14 for further discussion of counterparty credit risk.
The table below summarizes the location and fair value of the derivatives reported in the Consolidated Statements of Financial Condition after counterparty netting and posting of cash collateral as of December 31, 2013 and 2012.
|
December 31, 2013
|
||||||||||||||||
|
Derivative Assets
|
Derivative Liabilities
|
|||||||||||||||
|
Derivative Instruments
|
Notional Amount Outstanding
|
Location on Consolidated
Statements of Financial
Condition
|
Net Estimated Fair Value/Carrying
Value
|
Location on
Consolidated Statements
of Financial Condition
|
Net Estimated Fair Value/Carrying Value
|
|||||||||||
|
(dollars in thousands)
|
||||||||||||||||
|
Interest Rate Swaps
|
$ | 1,355,000 |
Derivatives, at fair value, net
|
$ | - |
Derivatives, at fair value
|
$ | (30,199 | ) | |||||||
|
Mortgage Options
|
- |
Derivatives, at fair value, net
|
- |
Derivatives, at fair value
|
- | |||||||||||
|
Treasury Futures
|
550,000 |
Derivatives, at fair value, net
|
8,095 |
Derivatives, at fair value
|
- | |||||||||||
|
Total
|
$ | 1,905,000 | $ | 8,095 | $ | (30,199 | ) | |||||||||
|
December 31, 2012
|
||||||||||||||||
|
Derivative Assets
|
Derivative Liabilities
|
|||||||||||||||
|
Derivative Instruments
|
Notional Amount Outstanding
|
Location on Consolidated Statements of Financial Condition
|
Net Estimated Fair Value/Carrying
Value
|
Location on
Consolidated Statements
of Financial Condition
|
Net Estimated Fair Value/Carrying Value
|
|||||||||||
|
(dollars in thousands)
|
||||||||||||||||
|
Interest Rate Swaps
|
$ | 1,355,000 |
Derivatives, at fair value, net
|
$ | - |
Derivatives, at fair value
|
$ | (53,939 | ) | |||||||
|
Total
|
$ | 1,355,000 | $ | - | $ | (53,939 | ) | |||||||||
The effect of the Company’s derivatives on the Consolidated Statements of Operations and Comprehensive Income (Loss) is presented below.
F-33
|
For the Year Ended
|
||||||||||||||
|
Derivative
Instruments
|
Location on Consolidated Statements of
Operations and Comprehensive Income (Loss)
|
December 31, 2013
|
December 31, 2012
|
December 31, 2011
|
||||||||||
|
(dollars in thousands)
|
||||||||||||||
|
Interest Rate Swaps
|
Net unrealized gains (losses) on derivatives
|
$ | 23,740 | $ | (9,473 | ) | $ | (34,478 | ) | |||||
|
Interest Rate Swaps
|
Net realized gains (losses) on derivatives
|
(21,857 | ) | (20,223 | ) | (15,929 | ) | |||||||
|
Mortgage Options
|
Net unrealized gains (losses) on derivatives
|
- | - | - | ||||||||||
|
Mortgage Options
|
Net realized gains (losses) on derivatives
|
12,115 | - | - | ||||||||||
|
Treasury Futures
|
Net unrealized gains (losses) on derivatives
|
10,629 | - | - | ||||||||||
|
Treasury Futures
|
Net realized gains (losses) on derivatives
|
2,029 | - | - | ||||||||||
|
Total
|
$ | 26,656 | $ | (29,696 | ) | $ | (50,407 | ) | ||||||
The weighted average pay rate on the Company’s interest rate swaps at December 31, 2013 was 1.81% and the weighted average receive rate was 0.17%. The weighted average pay rate on the Company’s interest rate swaps at December 31, 2012 was 1.81% and the weighted average receive rate was 0.21%. The weighted average pay rate on the Company’s interest rate swaps at December 31, 2011 was 2.08% and the weighted average receive rate was 0.29%.
Certain of the Company’s interest rate swap and mortgage option contracts are subject to International Swaps and Derivatives Association Master Agreements (“ISDA”) which contain provisions that grant counterparties certain rights with respect to the applicable ISDA upon the occurrence of (i) negative performance that results in a decline in net assets in excess of specified thresholds or dollar amounts over set periods of time, (ii) the Company’s failure to maintain its REIT status, (iii) the Company’s failure to comply with limits on the amount of leverage, and (iv) the Company’s stock being delisted from the New York Stock Exchange (NYSE). Upon the occurrence of items (i) through (iv), the counterparty to the applicable ISDA has a right to terminate the ISDA in accordance with its provisions.
Certain of the Company’s interest rate swaps are centrally cleared through a registered commodities exchange. Each of the Company’s ISDAs and central clearing exchange agreements contains provisions under which the Company is required to fully collateralize its obligations under the interest rate swap agreements if at any point the fair value of the swap represents a liability greater than the minimum transfer amount contained within the agreements. The Company is also required to post initial collateral upon execution of certain of its swap transactions. If the Company breaches any of these provisions, it will be required to settle its obligations under the agreements at their termination values, which approximates fair value. Centrally cleared swaps are fair valued using internal pricing models and compared to the exchange market values. The aggregate fair value of all derivative instruments with credit-risk-related contingent features that are in a net liability position at December 31, 2013 is approximately $30.2 million including accrued interest, which represents the maximum amount the Company would be required to pay upon termination, which is fully collateralized.
10. Common Stock
On January 28, 2011 the Company entered into an equity distribution agreement with FIDAC and UBS Securities LLC (“UBS”). Through this agreement, the Company may sell through UBS, as its sales agent, up to 125,000,000 shares of its common stock in ordinary brokers’ transactions at market prices or other transactions as agreed between the Company and UBS. The Company did not sell any shares of its common stock under the equity distribution agreement during the years ended December 31, 2013 and 2012.
On September 24, 2009, the Company implemented a Dividend Reinvestment and Share Purchase Plan (“DRSPP”). The DRSPP provides holders of record of its common stock an opportunity to automatically reinvest all or a portion of their cash distributions received on common stock in additional shares of the Company’s common stock as well as to make optional cash payments to purchase shares of its common stock. Persons who are not already stockholders may also purchase the Company’s common stock under the plan through optional cash payments. The DRSPP is administered by the Administrator, Computershare. The DRSPP was suspended during the quarter ended March 31, 2012 when the Company was no longer current in its filings with the SEC. There were no shares issued as a part of the DRSPP during the year ended December 31, 2013 due to the suspension of the DRSPP. During the year ended December 31, 2012 the Company raised $117 thousand by issuing 39,000 shares through the DRSPP.
As a result of the Company’s delay in filing its SEC reports by the filing date required by the SEC (including the grace period permitted by Rule 12b-25 under the Securities Exchange Act of 1934, as amended), the Company will not be able to issue shares of common stock under the equity distribution agreement or the DRSPP until filings with the SEC have been timely made for a full year.
During the year ended December 31, 2013 the Company declared dividends to common shareholders totaling $575.2 million, or $0.56 per share. During the year ended December 31, 2012 the Company declared dividends to common shareholders totaling $390.2 million, or $0.38 per share. During the year ended December 31, 2011 the Company declared dividends to common shareholders totaling $523.5 million, or $0.51 per share.
F-34
Earnings per share for the years ended December 31, 2013 and 2012, respectively, are computed as follows:
| For the Year Ended | ||||||||||||
|
December 31, 2013
|
December 31, 2012
|
December 31, 2011
|
||||||||||
| (dollars in thousands) | ||||||||||||
|
Numerator:
|
||||||||||||
|
Net income
|
$ | 362,686 | $ | 327,767 | $ | 137,329 | ||||||
|
Effect of dilutive securities:
|
- | - | - | |||||||||
|
Dilutive net income available to stockholders
|
$ | 362,686 | $ | 327,767 | $ | 137,329 | ||||||
|
Denominator:
|
||||||||||||
|
Weighted average basic shares
|
1,027,094,379 | 1,026,831,033 | 1,026,365,197 | |||||||||
|
Effect of dilutive securities
|
475,964 | 668,222 | 806,190 | |||||||||
|
Weighted average dilutive shares
|
1,027,570,343 | 1,027,499,255 | 1,027,171,387 | |||||||||
|
Net income per average share attributable to common stockholders - Basic
|
$ | 0.35 | $ | 0.32 | $ | 0.13 | ||||||
|
Net income per average share attributable to common stockholders - Diluted
|
$ | 0.35 | $ | 0.32 | $ | 0.13 | ||||||
11. Accumulated Other Comprehensive Income
The following table presents the changes in the components of Accumulated Other Comprehensive Income (“AOCI”) for the year ended December 31, 2013:
|
December 31, 2013
|
||||||||
|
(dollars in thousands)
|
||||||||
|
Unrealized gains (losses) on available-for-sale securities, net
|
Total Accumulated OCI Balance
|
|||||||
|
Balance as of December 31, 2012
|
$ | 989,936 | $ | 989,936 | ||||
|
OCI before reclassifications
|
23,807 | 23,807 | ||||||
|
Amounts reclassified from AOCI
|
(22,940 | ) | (22,940 | ) | ||||
|
Net current period OCI
|
867 | 867 | ||||||
|
Balance as of December 31, 2013
|
$ | 990,803 | $ | 990,803 | ||||
The following table presents the details of the reclassifications from AOCI for the year ended December 31, 2013:
|
December 31, 2013
|
|||||
|
(dollars in thousands)
|
|||||
|
Details about Accumulated OCI Components
|
Amounts
Reclassified from Accumulated OCI
|
Affected Line on the Consolidated
Statements Of Operations And
Comprehensive Income (Loss)
|
|||
|
Unrealized gains and losses on available-for-sale securities
|
|||||
| $ | 68,107 |
Net realized gains (losses) on sales of investments
|
|||
| (45,167 | ) |
Net other-than-temporary credit impairment losses
|
|||
| $ | 22,940 |
Income (loss) before income taxes
|
|||
| - |
Income taxes
|
||||
| $ | 22,940 |
Net of tax
|
|||
12. Long Term Incentive Plan
The Company has adopted a long term stock incentive plan to provide incentives to its independent directors and employees of FIDAC and its affiliates, to reward their efforts, to attract, reward and retain personnel and other service providers, and to align their interest with the common share investors. The incentive plan authorizes the Compensation Committee of the board of directors to grant awards, including incentive stock options, non-qualified stock options, restricted shares and other types of incentive awards. The specific award granted to an individual is based upon, in part, the individual’s position within FIDAC, the individual’s position within the Company, his or her contribution to the Company’s performance, as well as the recommendations of FIDAC. The incentive plan authorizes the granting of options or other awards of 8.0% of the outstanding shares of the Company’s common stock up to a ceiling of 40,000,000 shares.
F-35
On January 2, 2008, the Company granted restricted stock awards in the amount of 1,301,000 shares to employees of FIDAC and its affiliates and the Company’s independent directors. The awards to the independent directors vested on the date of grant and the awards to FIDAC’s employees vest quarterly over a period of 10 years. As of December 31, 2013 there was $1.2 million of total unrecognized compensation costs related to non-vested share-based compensation arrangements granted under the long term incentive plan, based on the closing price of the shares at quarter end. That cost is expected to be recognized over a period of 4 years. The total fair value of shares vested, less those forfeited, during the years ended December 31, 2013, 2012 and 2011 was $395 thousand, $401 thousand and $443 thousand, respectively, based on the closing price of the stock on the vesting date. For the years ended December 31, 2013, 2012 and 2011, compensation expense associated with the amortization of the fair value of the restricted stock was approximately $418 thousand, $449 thousand and $451 thousand, respectively.
The Company’s independent directors receive a fixed dollar amount of the Company’s common stock in return for services provided to the Company. Equity based awards granted to the independent directors vest during the year of service. For the years ended December 31, 2013, 2012 and 2011, the Company recognized $300 thousand, $300 thousand, and $270 thousand of stock based compensation to independent directors, respectively.
The following table presents information with respect to the Company’s restricted stock awards during the years ended December 31, 2013 and 2012:
|
For the Year Ended
|
||||||||||||||||
|
December 31, 2013
|
December 31, 2012
|
|||||||||||||||
|
Number of Shares
|
Weighted
Average Grant
Date Fair Value
|
Number of Shares
|
Weighted
Average Grant
Date Fair Value
|
|||||||||||||
|
Unvested shares outstanding - beginning of period
|
586,000 | 17.72 | 758,400 | 17.72 | ||||||||||||
|
Granted
|
98,688 | 3.04 | 111,528 | 2.69 | ||||||||||||
|
Vested
|
(230,779 | ) | 17.72 | (264,232 | ) | 17.72 | ||||||||||
|
Forfeited
|
(69,909 | ) | 17.72 | (19,696 | ) | 17.72 | ||||||||||
|
Unvested shares outstanding - end of period
|
384,000 | 17.72 | 586,000 | 17.72 | ||||||||||||
13. Income Taxes
For the year ended December 31, 2013, the Company was qualified to be taxed as a REIT under Code Sections 856 through 860. As a REIT, the Company is not subject to federal income tax to the extent that it makes qualifying distributions of taxable income to its stockholders. To maintain qualification as a REIT, the Company must distribute at least 90% of its annual REIT taxable income to its shareholders and meet certain other requirements such as assets it may hold, income it may generate and its shareholder composition. It is generally the Company’s policy to distribute to its shareholders all of the Company’s taxable income.
The state and local tax jurisdictions for which the Company is subject to tax-filing obligations recognize the Company’s status as a REIT, and therefore, the Company generally does not pay income tax in such jurisdictions. The Company may, however, be subject to certain minimum state and local tax filing fees and its TRS is subject to federal, state, and local taxes.
For the years ended December 31, 2013, 2012 and 2011, the Company recorded income tax expense of $2 thousand, $1 thousand, and $606 thousand, respectively.
In general, common stock cash dividends declared by the Company will be considered ordinary income to stockholders for income tax purposes. From time to time, a portion of the Company’s dividends may be characterized as capital gains or return of capital. For the years ended December 31, 2013 and 2012, $0.08 and $0.12 of the income distributed in the form of dividends declares is characterized as a return of capital for federal income tax purposes, respectively. For the year ended December 31, 2011, all of the income distributed in the form of dividends declared is characterized as ordinary income.
The Company’s effective tax rate differs from its combined federal, state and city corporate statutory tax rate primarily due to the deduction of dividend distributions required to be paid under Code Section 857(a).
The Company’s 2013, 2012, 2011 and 2010 federal, state and local tax returns remain open for examination.
F-36
14. Credit Risk and Interest Rate Risk
The Company’s primary components of market risk are credit risk and interest rate risk. The Company is subject to interest rate risk in connection with its investments in Agency and Non-Agency RMBS, residential mortgage loans, and borrowings under repurchase agreements. When the Company assumes interest rate risk, it attempts to minimize interest rate risk through asset selection, hedging and matching the income earned on mortgage assets with the cost of related liabilities. The Company attempts to minimize credit risk through due diligence and asset selection by purchasing loans underwritten to agreed-upon specifications of selected originators. The Company has established a whole loan target market including prime borrowers with FICO scores generally greater than 650, Alt-A documentation, geographic diversification, owner-occupied property, and moderate loan-to-value ratios. These factors are considered to be important indicators of credit risk.
By using derivative instruments and repurchase agreements, the Company is exposed to counterparty credit risk if counterparties to the contracts do not perform as expected. If a counterparty fails to perform on a derivative hedging instrument, the Company’s counterparty credit risk is equal to the amount reported as a derivative asset on its balance sheet to the extent that amount exceeds collateral obtained from the counterparty or, if in a net liability position, the extent to which collateral posted exceeds the liability to the counterparty. The amounts reported as a derivative asset/(liability) are derivative contracts in a gain/(loss) position, and to the extent subject to master netting arrangements, net of derivatives in a loss/(gain) position with the same counterparty and collateral received/(pledged). If the counterparty fails to perform on a repurchase agreement, the Company is exposed to a loss to the extent that the fair value of collateral pledged exceeds the liability to the counterparty. The Company attempts to minimize counterparty credit risk by evaluating and monitoring the counterparty’s credit, executing master netting arrangements and obtaining collateral, and executing contracts and agreements with multiple counterparties to reduce exposure to a single counterparty, where appropriate.
Our repurchase agreements and derivative transactions are governed by underlying agreements that provide for a right of setoff under master netting arrangements, including in the event of default or in the event of bankruptcy of either party to the transactions. We present our assets and liabilities subject to such arrangements on a net basis in our consolidated statements of financial condition. The following table presents information about our liabilities that are subject to such arrangements and can potentially be offset on our consolidated statements of financial condition as of December 31, 2013 and 2012. The Company has no financial instruments subject to master netting arrangements, or similar arrangements, in an asset position on a gross basis.
|
December 31, 2013
|
||||||||||||||||||||||||
|
(dollars in thousands)
|
||||||||||||||||||||||||
|
Gross Amounts Not Offset with Financial
Assets (Liabilities) in the Consolidated
Statements of Financial Position
|
||||||||||||||||||||||||
|
Gross Amounts of Recognized Assets (Liabilities)
|
Gross Amounts Offset in the Consolidated Statements
of Financial Position
|
Net Amounts Offset in the Consolidated Statements
of Financial Position
|
Financial Instruments
|
Cash Collateral
(Received) Pledged
|
Net Amount
|
|||||||||||||||||||
|
Repurchase agreements
|
$ | (1,658,561 | ) | $ | - | $ | (1,658,561 | ) | $ | 1,737,381 | $ | - | $ | 78,820 | ||||||||||
|
Interest Rate Swaps
|
(30,199 | ) | - | (30,199 | ) | 39,470 | - | 9,271 | ||||||||||||||||
|
Mortgage Options
|
- | - | - | - | - | - | ||||||||||||||||||
|
Treasury Futures
|
10,629 | (2,534 | ) | 8,095 | - | - | 8,095 | |||||||||||||||||
|
Total Liabilities
|
$ | (1,678,131 | ) | $ | (2,534 | ) | $ | (1,680,665 | ) | $ | 1,776,851 | $ | - | $ | 96,186 | |||||||||
|
December 31, 2012
|
||||||||||||||||||||||||
|
(dollars in thousands)
|
||||||||||||||||||||||||
|
Gross Amounts Not Offset with Financial
Assets (Liabilities) in the Consolidated
Statements of Financial Position
|
||||||||||||||||||||||||
|
Gross Amounts of Recognized Assets (Liabilities)
|
Gross Amounts Offset in the Consolidated Statements
of Financial Position
|
Net Amounts Offset in the Consolidated Statements
of Financial Position
|
Financial Instruments
|
Cash Collateral
(Received) Pledged
|
Net Amount
|
|||||||||||||||||||
|
Repurchase Agreements
|
$ | (1,528,025 | ) | $ | - | $ | (1,528,025 | ) | $ | 1,604,560 | $ | - | $ | 76,535 | ||||||||||
|
Interest Rate Swaps
|
(53,939 | ) | - | (53,939 | ) | $ | 60,382 | - | 6,443 | |||||||||||||||
|
Total Liabilities
|
$ | (1,581,964 | ) | $ | - | $ | (1,581,964 | ) | $ | 1,664,942 | $ | - | $ | 82,978 | ||||||||||
F-37
15. Management Agreement and Related Party Transactions
Because of the Restatement Filing (as defined below) the Company entered into a management agreement with FIDAC, which provided for an initial term through December 31, 2010 with an automatic one-year extension option and subject to certain termination rights. In 2011 and through November 28, 2012, the Company paid FIDAC a quarterly management fee equal to 1.50% per annum of the gross Stockholders’ Equity (as defined in the management agreement) of the Company. Effective November 28, 2012, the management fee was reduced to 0.75% per annum of gross Stockholders’ Equity, which reduction will remain in effect until the Company is current on all of its filings required under applicable securities laws.
Management fees accrued and paid to FIDAC for the years ended December 31, 2013, 2012 and 2011 were $26.0 million, $49.5 million and $52.0 million, respectively.
Under the management agreement, the Company is obligated to reimburse FIDAC for its costs incurred under the management agreement. In addition, the management agreement permits FIDAC to require the Company to pay for its pro rata portion of rent, telephone, utilities, office furniture, equipment, machinery and other office, internal and overhead expenses that FIDAC incurred in connection with the Company’s operations. These expenses are allocated between FIDAC and the Company based on the ratio of the Company’s proportion of gross assets compared to the gross assets managed by FIDAC as calculated at each quarter end. FIDAC and the Company will modify this allocation methodology, subject to the approval of the Company’s board of directors if the allocation becomes inequitable (i.e., if the Company becomes very highly leveraged compared to FIDAC’s other funds and accounts). During the year ended December 31, 2013, 2012 and 2011, the Company reimbursed FIDAC approximately $493 thousand, $447 thousand and $625 thousand for such expenses, respectively.
The Company and FIDAC amended the management agreement on March 8, 2013. In the amendment, the reduction in the management fee was memorialized. In addition, FIDAC agreed to pay all past and future expenses that the Company and/or the Audit Committee of the Company incur to: (1) evaluate the Company’s accounting policy related to the application of GAAP to its Non-Agency RMBS portfolio (the “Evaluation”); (2) restate the Company’s financial statements for the period covering 2008 through 2011 as a result of the Evaluation (the “Restatement Filing”); and (3) investigate and evaluate any shareholder derivative demands arising from the Evaluation and/or the Restatement Filing (the “Investigation”); provided, however, that FIDAC’s obligation to pay expenses applies only to expenses not paid by the Company’s insurers under its insurance policies. Expenses shall include, without limitation, fees and costs incurred with respect to auditors, outside counsel, and consultants engaged by the Company and/or the Audit Committee of the Company for the Evaluation, Restatement Filing and the Investigation. The amount paid by FIDAC related to these expenses for the years ended December 31, 2013 and 2012 is $6.8 million and $4.7 million, respectively, and is presented in the Consolidated Statements of Operations and Comprehensive Income (Loss) as Expense recoveries from Manager.
The amended management agreement is automatically renewed for a one-year term on each anniversary date, although two-thirds of the independent directors or the holders of a majority of the outstanding shares of common stock (other than those held by Annaly or its affiliates) may elect to terminate the management agreement upon 30 days notice at any time in their sole discretion without the payment of a termination fee. The amendment also provides that the Company may terminate the management agreement effective immediately if (i) FIDAC engages in any act of fraud, misappropriation of funds, or embezzlement against the Company, (ii) there is an event of any gross negligence on the part of FIDAC in the performance of its duties under the management agreement, (iii) there is a commencement of any proceeding relating to FIDAC’s bankruptcy or insolvency, (iv) there is a dissolution of FIDAC, or (v) FIDAC is convicted of (including a plea of nolo contendere) a felony.
On March 1, 2011, the Company entered into an administrative services agreement with RCap Securities Inc., (“RCap”). RCap is a SEC-registered broker-dealer and a wholly-owned subsidiary of Annaly that clears the Company’s securities trades in return for normal and customary fees that RCap charges for such services. RCap may also provide brokerage services to the Company from time to time. During the years ended December 31, 2013, 2012 and 2011, fees paid to RCAP were $145 thousand, $137 thousand and $162 thousand, respectively.
During the years ended December 31, 2013 and 2012, 140,000 shares and 172,000 shares of restricted stock issued by the Company to FIDAC’s employees vested, respectively.
F-38
16. Commitments and Contingencies
From time to time, the Company may become involved in various claims and legal actions arising in the ordinary course of business. In connection with certain re-securitization transactions engaged in by the Company, the Company has the obligation under certain circumstances to repurchase assets from the VIE upon breach of certain representations and warranties. Management is not aware of any contingencies that require accrual or disclosure as of December 31, 2013 and 2012.
17. Subsequent Events
The Board of Directors declared and paid a common stock cash dividend of $0.09 per common share for the first quarter of 2014. The Board of Directors has also determined that there will be a quarterly dividend of $0.09 per share for the second, third and fourth quarters of 2014. As of March 31, 2014, the Company has sold all of its interests in CSMC 2010-12R for approximately $580 million. A portion of the proceeds of this sale were invested in other Non-Agency RMBS securities and the remainder was invested in Agency RMBS securities. Also, subsequent to March 31, 2014, the Company increased its Agency portfolio by approximately $4 billion, financed primarily by repurchase agreements. From time to time, the Company may add to its Agency and Non-Agency portfolio and may increase leverage to increase net interest income.
18. Summarized Quarterly Results (Unaudited) and Immaterial Restatements
In the 2012 Form 10-K as filed, the Company corrected amounts previously reported in Total other-than-temporary impairments (“OTTI”) losses and the Portion of loss recognized in other comprehensive income (loss) in the Consolidated Statements of Operations and Comprehensive Income (Loss) as the previous presentation was reported on a cumulative basis. The current presentation reflects only that portion of Total other-than-temporary impairments loss and the Portion of loss recognized in other comprehensive income (loss) that is incremental for the reporting period by giving consideration to both the credit and portions of OTTI reported in Other comprehensive income (loss) and recognized in prior periods. For the years ended December 31, 2011, the previously reported Total other-than-temporary impairments losses of $418.1 million was reduced by $176.2 million. This change was fully offset by an adjustment to the previously reported Portion of loss recognized in other comprehensive income (loss) of $61.0 million. The corrections had no impact on any previously reported Net other-than-temporary credit impairment losses, Net income (loss), Other comprehensive income (loss), Net income (loss) per share available to common shareholders or Consolidated Statements of Cash Flows.
In the Company’s 2012 Form 10-Q, for the period ending March 31, 2012, the Company did not present total OTTI correctly when total cumulative credit losses are greater than total OTTI in the Consolidated Statements of Operations and Comprehensive Income (Loss). Total OTTI losses should be reported net of unrealized gains on a security when they occur in the same period as a credit loss. The previously reported total OTTI and portion of loss recognized in OCI for three month period ending March 31, 2012 of $57.0 million and $8.6 million, respectively, were reduced by $24.9 million. Additionally, the Company noted an error in the presentation of reclassification items within Comprehensive income (loss) in the Consolidated Statements of Operations and Comprehensive Income (Loss) for the quarter ended March 31, 2012. This error would result in a reduction of $47.1 million between Unrealized gains (losses) on available-for-sale securities, net, an increase in Reclassification adjustment for net losses included in net income (loss) for other-than-temporary credit impairment losses of $62.6 million and a reduction in Reclassification adjustment for net realized losses (gains) included in net income (loss) of $15.5 million. These adjustments are solely between the components of Accumulated other comprehensive income (loss) and have no impact on Total stockholders’ equity. The errors noted related to the financial statements for the period ended March 31, 2012 will be corrected in the Company’s future filings that presents such information. The fiscal year ended December 31, 2012 reflects the correction of the March 31, 2012 errors. The correction had no impact on any previously reported Net other-than-temporary credit impairment losses, Net income (loss), Other comprehensive income (loss), Net income (loss) per share available to common shareholders or Consolidated Statements of Cash Flows.
The following is a presentation of the results of operations for the quarters ended December 31, 2013, September 30, 2013, June 30, 2013 and March 31, 2013.
|
For the Quarter Ended
|
||||||||||||||||
|
December 31, 2013
|
September 30, 2013
|
June 30, 2013
|
March 31, 2013
|
|||||||||||||
|
(dollars in thousands, except per share data)
|
||||||||||||||||
|
Net Interest Income:
|
||||||||||||||||
|
Interest income
|
$ | 128,062 | $ | 130,361 | $ | 127,565 | $ | 125,795 | ||||||||
|
Less interest expense
|
(21,485 | ) | (25,074 | ) | (26,611 | ) | (28,829 | ) | ||||||||
|
Net interest income (expense)
|
106,577 | 105,287 | 100,954 | 96,966 | ||||||||||||
|
Other-than-temporary impairments:
|
||||||||||||||||
|
Total other-than-temporary impairment losses
|
(2,147 | ) | (2,209 | ) | - | - | ||||||||||
|
Portion of loss recognized in other comprehensive income (loss)
|
(20,402 | ) | (14,246 | ) | - | (6,163 | ) | |||||||||
|
Net other-than-temporary credit impairment losses
|
(22,549 | ) | (16,455 | ) | - | (6,163 | ) | |||||||||
|
Net gains (losses) on derivatives
|
22,361 | (3,364 | ) | 7,787 | (128 | ) | ||||||||||
|
Net unrealized gains (losses) on interest-only RMBS
|
(2,416 | ) | (27,874 | ) | (12,974 | ) | (1,013 | ) | ||||||||
|
Net realized gains (losses) on sales of investments
|
(4,832 | ) | 18,816 | 54,117 | 6 | |||||||||||
|
Total other expenses
|
8,514 | 9,043 | 6,677 | 9,865 | ||||||||||||
|
Net income (loss)
|
$ | 72,311 | $ | 67,367 | $ | 143,207 | $ | 79,801 | ||||||||
|
Net income (loss) per share-basic and diluted
|
$ | 0.06 | $ | 0.07 | $ | 0.14 | $ | 0.08 | ||||||||
The following is a presentation of the results of operations for the quarters ended December 31, 2012, September 30, 2012, June 30, 2012 and March 31, 2012. The amounts below reflect the impact of the immaterial restatement as described above.
|
For the Quarter Ended
|
||||||||||||||||
|
December 31, 2012
|
September 30, 2012
|
June 30, 2012
|
March 31, 2012
|
|||||||||||||
|
(dollars in thousands, except per share data)
|
||||||||||||||||
|
Net Interest Income:
|
||||||||||||||||
|
Interest income
|
$ | 133,552 | $ | 144,696 | $ | 161,524 | $ | 149,668 | ||||||||
|
Less interest expense
|
(33,874 | ) | (34,356 | ) | (21,953 | ) | (36,375 | ) | ||||||||
|
Net interest income (expense)
|
99,678 | 110,340 | 139,571 | 113,293 | ||||||||||||
|
Other-than-temporary impairments:
|
||||||||||||||||
|
Total other-than-temporary impairment losses
|
(368 | ) | (2,713 | ) | (12,474 | ) | (32,077 | ) | ||||||||
|
Portion of loss recognized in other comprehensive income (loss)
|
(7,817 | ) | (7,301 | ) | (53,213 | ) | (16,287 | ) | ||||||||
|
Net other-than-temporary credit impairment losses
|
(8,185 | ) | (10,014 | ) | (65,687 | ) | (48,364 | ) | ||||||||
|
Net gains (losses) on derivatives
|
(199 | ) | (9,725 | ) | (16,186 | ) | (3,586 | ) | ||||||||
|
Net unrealized gains (losses) on interest-only RMBS
|
811 | (15,393 | ) | (2,532 | ) | 17,947 | ||||||||||
|
Net gains (losses) on embedded derivatives in interest-only RMBS
|
- | - | - | - | ||||||||||||
|
Net realized gains (losses) on sales of investments
|
1 | 69,155 | - | 16,010 | ||||||||||||
|
Total other expenses
|
13,422 | 16,295 | 14,385 | 15,065 | ||||||||||||
|
Net income (loss)
|
$ | 78,685 | $ | 128,068 | $ | 40,781 | $ | 80,233 | ||||||||
|
Net income (loss) per share-basic and diluted
|
$ | 0.08 | $ | 0.12 | $ | 0.04 | $ | 0.08 | ||||||||
The following is a presentation of the results of operations for the quarters ended December 31, 2011, September 30, 2011, June 30, 2011 and March 31, 2011. The amounts below reflect the impact of the immaterial restatement as described above.
|
For the Quarter Ended
|
||||||||||||||||
|
December 31, 2011
|
September 30, 2011
|
June 30, 2011
|
March 31, 2011
|
|||||||||||||
|
(dollars in thousands, except per share data)
|
||||||||||||||||
|
Net Interest Income:
|
||||||||||||||||
|
Interest income
|
$ | 167,541 | $ | 185,581 | $ | 179,859 | $ | 172,043 | ||||||||
|
Less interest expense
|
(30,696 | ) | (32,792 | ) | (35,793 | ) | (35,577 | ) | ||||||||
|
Net interest income (expense)
|
136,845 | 152,789 | 144,066 | 136,466 | ||||||||||||
|
Other-than-temporary impairments:
|
||||||||||||||||
|
Total other-than-temporary impairment losses
|
(80,038 | ) | (78,950 | ) | (57,926 | ) | (25,048 | ) | ||||||||
|
Portion of loss recognized in other comprehensive income (loss)
|
(31,154 | ) | (71,610 | ) | (4,244 | ) | (8,135 | ) | ||||||||
|
Net other-than-temporary credit impairment losses
|
(111,192 | ) | (150,560 | ) | (62,170 | ) | (33,183 | ) | ||||||||
|
Net gains (losses) on derivatives
|
(3,782 | ) | (29,812 | ) | (23,797 | ) | 6,984 | |||||||||
|
Net unrealized gains (losses) on interest-only RMBS
|
(12,934 | ) | (17,600 | ) | 11,883 | 4,106 | ||||||||||
|
Net realized gains (losses) on sales of investments
|
52,566 | 58 | (913 | ) | 2,642 | |||||||||||
|
Total other expenses
|
18,794 | 15,082 | 14,972 | 15,679 | ||||||||||||
|
Net income (loss)
|
$ | 42,748 | $ | (60,036 | ) | $ | 53,979 | $ | 100,638 | |||||||
|
Net income (loss) per share-basic and diluted
|
$ | 0.04 | $ | (0.06 | ) | $ | 0.05 | $ | 0.10 | |||||||
F-39
SIGNATURES
Pursuant to the requirements of Section 13 or 15(d) of the Securities Exchange Act of 1934, the registrant has duly caused this report to be signed on its behalf by the undersigned, thereunto duly authorized, in the city of New York, State of New York.
CHIMERA INVESTMENT CORPORATION
| By: | /s/ Matthew Lambiase | |
|
Matthew Lambiase
|
||
|
Chief Executive Officer and President
|
||
|
June 4, 2014
|
Pursuant to the requirements of the Securities Exchange Act of 1934, this report has been signed below by the following persons on behalf of the registrant and in the capacities and on the date indicated.
|
Signatures
|
Title
|
Date
|
||
|
/s/ Matthew Lambiase
|
Chief Executive Officer, President, and
Director (Principal Executive Officer)
|
June 4, 2014
|
||
|
Matthew Lambiase
|
||||
|
/s/ Robert Colligan
|
Chief Financial Officer (Principal Financial
and Accounting Officer)
|
June 4, 2014
|
||
|
Robert Colligan
|
||||
|
/s/ Mark Abrams
|
Director
|
June 4, 2014
|
||
|
Mark Abrams
|
||||
|
/s/ Paul A. Keenan
|
Director
|
June 4, 2014
|
||
|
Paul A. Keenan
|
||||
|
/s/ Paul Donlin
|
Director
|
June 4, 2014
|
||
|
Paul Donlin
|
||||
|
/s/ Gerard Creagh
|
Director
|
June 4, 2014
|
||
|
Gerard Creagh
|
||||
|
/s/ Dennis Mahoney
|
Director
|
June 4, 2014
|
||
|
Dennis Mahoney
|
||||
|
/s/ John P. Reilly
|
Director
|
June 4, 2014
|
||
|
John P. Reilly
|
S-1