EX-99.1
Published on March 6, 2023
Exhibit 99.1

INVESTOR PRESENTATION March 6, 2023
DISCLAIMER This presentation includes forward-looking statements within the meaning of the safe harbor provisions of the United States Private Securities Litigation Reform Act of 1995. Actual results may differ from expectations, estimates and projections and, consequently, readers should not rely on these forward-looking statements as predictions of future events. Words such as goal expect, target, assume, estimate, project, budget, forecast, anticipate, intend, plan, may, will, could, should, believe, predicts, potential, continue, and similar expressions are intended to identify such forward-looking statements. These forward-looking statements involve significant risks and uncertainties that could cause actual results to differ materially from expected results, including, among other things, those described in our most recent Annual Report on Form 10-K, and any subsequent Quarterly Reports on Form 10-Q and Current Report on Form 8-K, under the caption Risk Factors. Factors that could cause actual results to differ include, but are not limited to: our business and investment strategy; our ability to accurately forecast the payment of future dividends on our common and preferred stock, and the amount of such dividends; our ability to determine accurately the fair market value of our assets; availability of investment opportunities in real estate-related and other securities, including our valuation of potential opportunities that may arise as a result of current and future market dislocations; our expected investments; changes in the value of our investments, including negative changes resulting in margin calls related to the financing of our assets; changes in inflation, interest rates and mortgage prepayment rates; prepayments of the mortgage and other loans underlying our mortgage-backed securities, or MBS, or other asset-backed securities, or ABS; rates of default, delinquencies, forbearance, deferred payments, or decreased recovery rates on our investments; general volatility of the securities markets in which we invest; our ability to maintain existing financing arrangements and our ability to obtain future financing arrangements; our ability to effect our strategy to securitize residential mortgage loans; interest rate mismatches between our investments and our borrowings used to finance such purchases; effects of interest rate caps on our adjustable-rate investments; the degree to which our hedging strategies may or may not protect us from interest rate volatility; the impact of and changes to various government programs; the impact of and changes in governmental regulations, tax law and rates, accounting guidance, and similar matters; market trends in our industry, interest rates, the debt securities markets or the general economy; estimates relating to our ability to make distributions to our stockholders in the future; our understanding of our competition; qualified personnel; our ability to maintain our classification as a real estate investment trust, or, REIT, for U.S. federal income tax purposes; our ability to maintain our exemption from registration under the Investment Company Act of 1940, as amended, or 1940 Act; our expectations regarding materiality or significance; and the effectiveness of our disclosure controls and procedures. Readers are cautioned not to place undue reliance upon any forward-looking statements, which speak only as of the date made. Chimera does not undertake or accept any obligation to release publicly any updates or revisions to any forward-looking statement to reflect any change in its expectations or any change in events, conditions or circumstances on which any such statement is based. Additional information concerning these, and other risk factors is contained in Chimeras most recent filings with the Securities and Exchange Commission (SEC). All subsequent written and oral forward-looking statements concerning Chimera or matters attributable to Chimera or any person acting on its behalf are expressly qualified in their entirety by the cautionary statements above. This presentation may include industry and market data obtained through research, surveys, and studies conducted by third parties and industry publications. We have not independently verified any such market and industry data from third-party sources. This presentation is provided for discussion purposes only and may not be relied upon as legal or investment advice, nor is it intended to be inclusive of all the risks and uncertainties that should be considered. This presentation does not constitute an offer to purchase or sell any securities, nor shall it be construed to be indicative of the terms of an offer that the parties or their respective affiliates would accept. Readers are advised that the financial information in this presentation is based on company data available at the time of this presentation and, in certain circumstances, may not have been audited by the companys independent auditors.
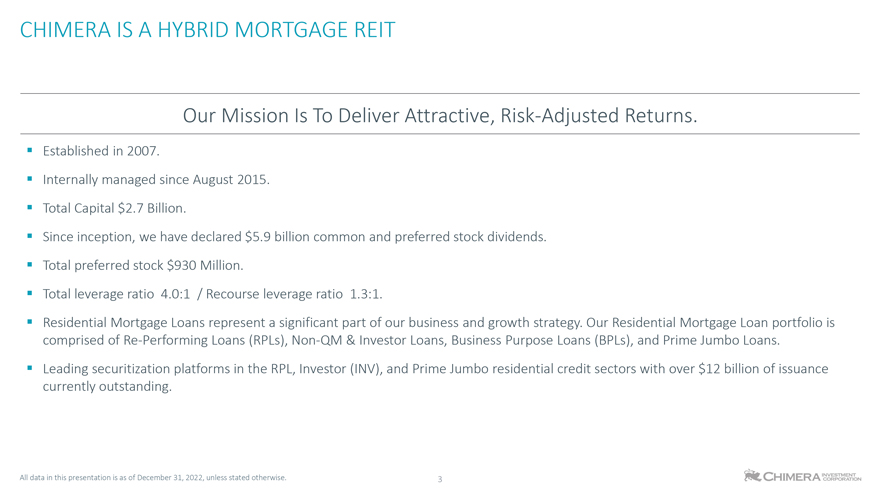
CHIMERA IS A HYBRID MORTGAGE REIT Our Mission Is To Deliver Attractive, Risk-Adjusted Returns. Established in 2007. Internally managed since August 2015. Total Capital $2.7 Billion. Since inception, we have declared $5.9 billion common and preferred stock dividends. Total preferred stock $930 Million. Total leverage ratio 4.0:1 / Recourse leverage ratio 1.3:1. Residential Mortgage Loans represent a significant part of our business and growth strategy. Our Residential Mortgage Loan portfolio is comprised of Re-Performing Loans (RPLs), Non-QM & Investor Loans, Business Purpose Loans (BPLs), and Prime Jumbo Loans. Leading securitization platforms in the RPL, Investor (INV), and Prime Jumbo residential credit sectors with over $12 billion of issuance currently outstanding. All data in this presentation is as of December 31, 2022, unless stated otherwise.
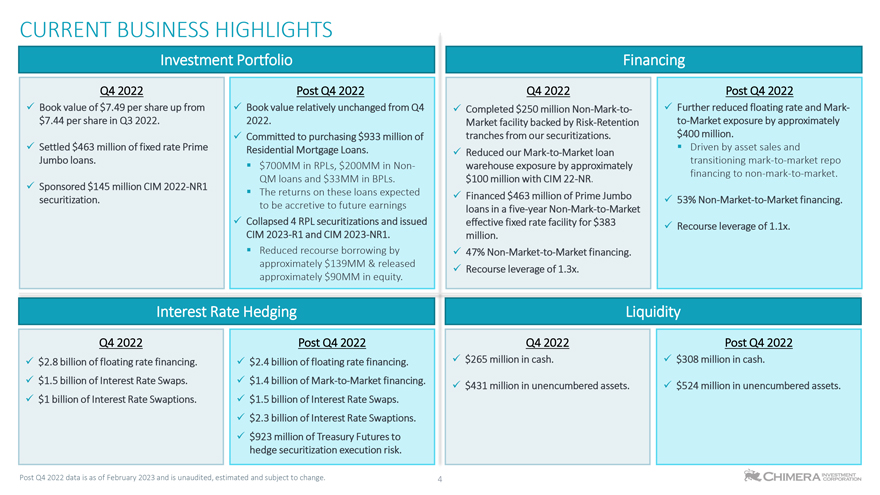
CURRENT BUSINESS HIGHLIGHTS Investment Portfolio Financing Q4 2022 Post Q4 2022 Q4 2022 Post Q4 2022 Book value of $7.49 per share up from Book value relatively unchanged from Q4 Completed $250 million Non-Mark-to- Further reduced floating rate and Mark$7.44 per share in Q3 2022. 2022. Market facility backed by Risk-Retention to-Market exposure by approximately Committed to purchasing $933 million of tranches from our securitizations. $400 million. Settled $463 million of fixed rate Prime Residential Mortgage Loans. Driven by asset sales and Reduced our Mark-to-Market loan Jumbo loans. transitioning mark-to-market repo $700MM in RPLs, $200MM in Non- warehouse exposure by approximately financing to non-mark-to-market. QM loans and $33MM in BPLs. $100 million with CIM 22-NR. Sponsored $145 million CIM 2022-NR1 The returns on these loans expected Financed $463 million of Prime Jumbo securitization. to be accretive to future earnings 53% Non-Market-to-Market financing. loans in a five-year Non-Mark-to-Market Collapsed 4 RPL securitizations and issued effective fixed rate facility for $383 Recourse leverage of 1.1x. CIM 2023-R1 and CIM 2023-NR1. million. Reduced recourse borrowing by 47% Non-Market-to-Market financing. approximately $139MM & released Recourse leverage of 1.3x. approximately $90MM in equity. Interest Rate Hedging Liquidity Q4 2022 Post Q4 2022 Q4 2022 Post Q4 2022 $2.8 billion of floating rate financing. $2.4 billion of floating rate financing. $265 million in cash. $308 million in cash. $1.5 billion of Interest Rate Swaps. $1.4 billion of Mark-to-Market financing. $431 million in unencumbered assets. $524 million in unencumbered assets. $1 billion of Interest Rate Swaptions. $1.5 billion of Interest Rate Swaps. $2.3 billion of Interest Rate Swaptions. $923 million of Treasury Futures to hedge securitization execution risk. Post Q4 2022 data is as of February 2023 and is unaudited, estimated and subject to change. 4
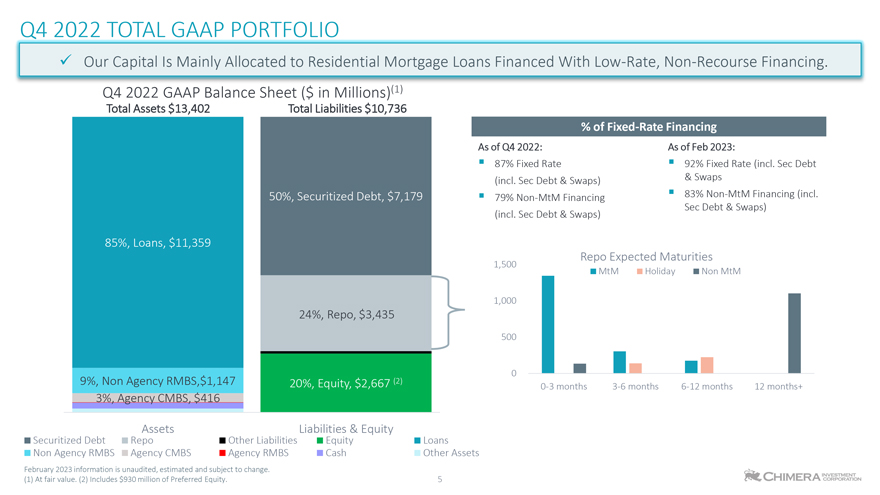
Q4 2022 TOTAL GAAP PORTFOLIO Our Capital Is Mainly Allocated to Residential Mortgage Loans Financed With Low-Rate, Non-Recourse Financing. Q4 2022 GAAP Balance Sheet ($ in Millions)(1) Total Assets $13,402 Total Liabilities $10,736 % of Fixed-Rate Financing As of Q4 2022: As of Feb 2023: 87% Fixed Rate 92% Fixed Rate (incl. Sec Debt (incl. Sec Debt & Swaps) & Swaps 50%, Securitized Debt, $7,179 79% Non-MtM Financing 83% Non-MtM Financing (incl. Sec Debt & Swaps) (incl. Sec Debt & Swaps) 85%, Loans, $11,359 Repo Expected Maturities 1,500 MtM Holiday Non MtM 1,000 24%, Repo, $3,435 500 0 9%, Non Agency RMBS,$1,147 20%, Equity, $2,667 (2) 3%, Agency CMBS, $416 0-3 months 3-6 months 6-12 months 12 months+ Securitized Debt Repo Assets Other Liabilities Liabilities Equity & Equity Loans Non Agency RMBS Agency CMBS Agency RMBS Cash Other Assets February 2023 information is unaudited, estimated and subject to change. (1) At fair value. (2) Includes $930 million of Preferred Equity. 5
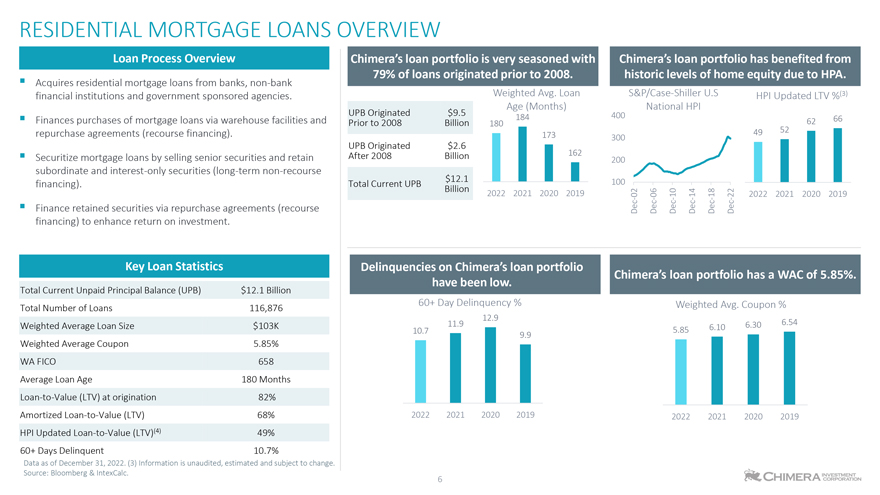
RESIDENTIAL MORTGAGE LOANS OVERVIEW Loan Process Overview Chimeras loan portfolio is very seasoned with Chimeras loan portfolio has benefited from 79% of loans originated prior to 2008. historic levels of home equity due to HPA. Acquires residential mortgage loans from banks, non-bank financial institutions and government sponsored agencies. Weighted Avg. Loan S&P/Case-Shiller U.S HPI Updated LTV %(3) Age (Months) National HPI UPB Originated $9.5 184 400 Finances purchases of mortgage loans via warehouse facilities and Prior to 2008 Billion 62 66 180 repurchase agreements (recourse financing). 49 52 173 300 UPB Originated $2.6 Securitize mortgage loans by selling senior securities and retain After 2008 Billion 162 200 subordinate and interest-only securities (long-term non-recourse $12.1 100 financing). Total Current UPB Billion 2022 2021 2020 2019 02 06 10 14 18 22 2022 2021 2020 2019 Finance retained securities via repurchase agreements (recourse Dec Dec Dec Dec Dec Dec financing) to enhance return on investment. Key Loan Statistics Delinquencies on Chimeras loan portfolio Chimeras loan portfolio has a WAC of 5.85%. have been low. Total Current Unpaid Principal Balance (UPB) $12.1 Billion 60+ Day Delinquency % Weighted Avg. Coupon % Total Number of Loans 116,876 12.9 Weighted Average Loan Size $103K 11.9 6.30 6.54 10.7 5.85 6.10 9.9 Weighted Average Coupon 5.85% WA FICO 658 Average Loan Age 180 Months Loan-to-Value (LTV) at origination 82% Amortized Loan-to-Value (LTV) 68% 2022 2021 2020 2019 2022 2021 2020 2019 HPI Updated Loan-to-Value (LTV)(4) 49% 60+ Days Delinquent 10.7% Data as of December 31, 2022. (3) Information is unaudited, estimated and subject to change. Source: Bloomberg & IntexCalc. 6
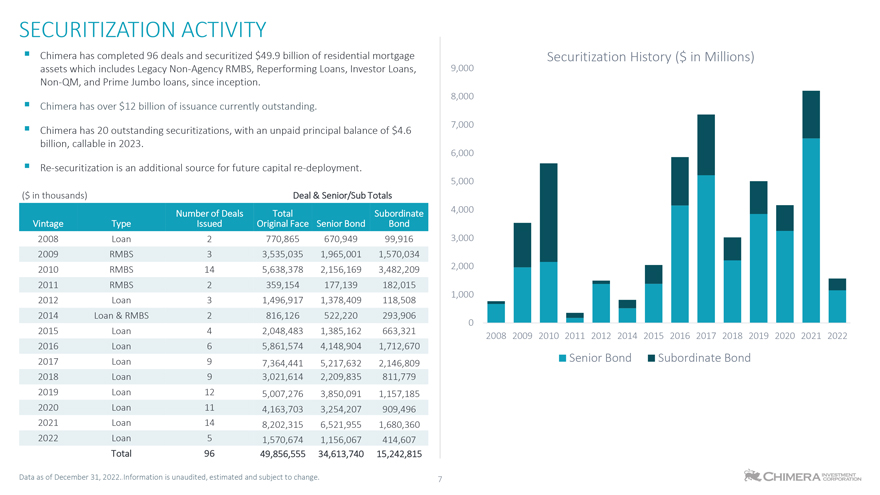
SECURITIZATION ACTIVITY Chimera has completed 96 deals and securitized $49.9 billion of residential mortgage Securitization History ($ in Millions) assets which includes Legacy Non-Agency RMBS, Reperforming Loans, Investor Loans, 9,000 Non-QM, and Prime Jumbo loans, since inception. 8,000 Chimera has over $12 billion of issuance currently outstanding. 7,000 Chimera has 20 outstanding securitizations, with an unpaid principal balance of $4.6 billion, callable in 2023. 6,000 Re-securitization is an additional source for future capital re-deployment. 5,000 ($ in thousands) Deal & Senior/Sub Totals Number of Deals Total Subordinate 4,000 Vintage Type Issued Original Face Senior Bond Bond 2008 Loan 2 Type 770,865 670,949 99,916 3,000 2009 RMBS 3 3,535,035 1,965,001 1,570,034 2010 RMBS 14 5,638,378 2,156,169 3,482,209 2,000 2011 RMBS 2 359,154 177,139 182,015 1,000 2012 Loan 3 1,496,917 1,378,409 118,508 2014 Loan & RMBS 2 816,126 522,220 293,906 0 2015 Loan 4 2,048,483 1,385,162 663,321 2008 2009 2010 2011 2012 2014 2015 2016 2017 2018 2019 2020 2021 2022 2016 Loan 6 5,861,574 4,148,904 1,712,670 Senior Bond Subordinate Bond 2017 Loan 9 7,364,441 5,217,632 2,146,809 2018 Loan 9 3,021,614 2,209,835 811,779 2019 Loan 12 5,007,276 3,850,091 1,157,185 2020 Loan 11 4,163,703 3,254,207 909,496 2021 Loan 14 8,202,315 6,521,955 1,680,360 2022 Loan 5 1,570,674 1,156,067 414,607 Total 96 49,856,555 34,613,740 15,242,815 Data as of December 31, 2022..Information is unaudited, estimated and subject to change. 7
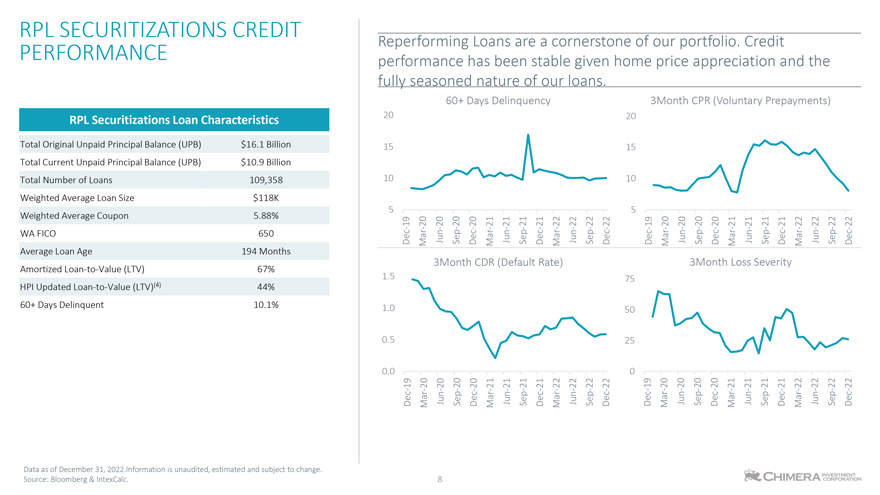
RPL PERFORMANCE SECURITIZATIONS CREDIT RPL Securitizations Loan Characteristics Total Original Unpaid Principal Balance (UPB) $16.1 Billion Total Current Unpaid Principal Balance (UPB) $10.9 Billion Total Number of Loans 109,358 Weighted Average Loan Size $118K Weighted Average Coupon 5.88% WA FICO 650 Average Loan Age 194 Months Amortized Loan-to-Value (LTV) 67% HPI Updated Loan-to-Value (LTV)(4) 44% 60+ Days Delinquent 10.1% Data as of December 31, 2022.Information is unaudited, estimated and subject to change. Source: Bloomberg & IntexCalc. 0.0 0.5 1.0 1.5 5 10 15 20 fully Dec-19 Dec-19 Mar-20 Mar-20 Jun-20 Jun-20 Sep-20 Sep-20 60+ performance 3Month seasoned Reperforming Dec-20 Dec-20 Days has Mar-21 CDR Mar-21 Jun-21 Jun-21 Loans nature Sep-21 Sep-21 been (Default of are Dec-21 Dec-21 Delinquencya Mar-22 Rate) Mar-22 our stable Jun-22 Jun-22 Sep-22 Sep-22 loans. Dec-22 Dec-22 given cornerstone 0 25 50 75 5 10 15 20 of Dec-19 Dec-19 home Mar-20 Mar-20 our Jun-20 Jun-20 3Month price Sep-20 Sep-20 CPR Dec-20 3Month Dec-20 Mar-21 Mar-21 portfolio. Jun-21 Loss Jun-21 (Voluntary Sep-21 Sep-21 appreciation Dec-21 Dec-21 Credit Severity Mar-22 Mar-22 and Jun-22 Jun-22 Prepayments)the Sep-22 Sep-22 Dec-22 Dec-22
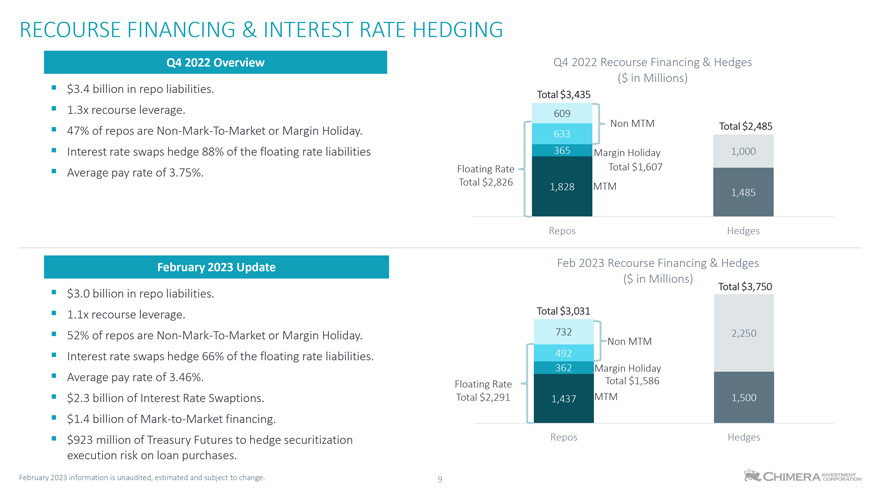
RECOURSE FINANCING & INTEREST RATE HEDGING Q4 2022 Overview Q4 2022 Recourse Financing & Hedges ($ in Millions) $3.4 billion in repo liabilities. Total $3,435 1.3x recourse leverage. 609 Non MTM Total $2,485 47% of repos are Non-Mark-To-Market or Margin Holiday. 633 Interest rate swaps hedge 88% of the floating rate liabilities 365 Margin Holiday 1,000 Average pay rate of 3.75%. Floating Rate Total $1,607 Total $2,826 1,828 MTM 1,485 Repos Hedges February 2023 Update Feb 2023 Recourse Financing & Hedges ($ in Millions) Total $3,750 $3.0 billion in repo liabilities. 1.1x recourse leverage. Total $3,031 52% of repos are Non-Mark-To-Market or Margin Holiday. 732 2,250 Non MTM Interest rate swaps hedge 66% of the floating rate liabilities. 492 362 Margin Holiday Average pay rate of 3.46%. Total $1,586 Floating Rate $2.3 billion of Interest Rate Swaptions. Total $2,291 1,437 MTM 1,500 $1.4 billion of Mark-to-Market financing. $923 million of Treasury Futures to hedge securitization Repos Hedges execution risk on loan purchases. February 2023 information is unaudited, estimated and subject to change. 9
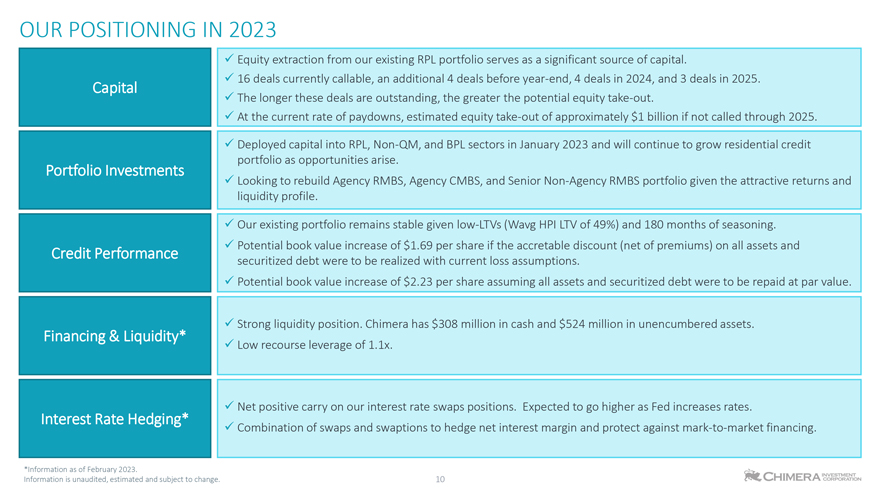
OUR POSITIONING IN 2023 Equity extraction from our existing RPL portfolio serves as a significant source of capital. 16 deals currently callable, an additional 4 deals before year-end, 4 deals in 2024, and 3 deals in 2025. Capital The longer these deals are outstanding, the greater the potential equity take-out. At the current rate of paydowns, estimated equity take-out of approximately $1 billion if not called through 2025. Deployed capital into RPL, Non-QM, and BPL sectors in January 2023 and will continue to grow residential credit portfolio as opportunities arise. Portfolio Investments Looking to rebuild Agency RMBS, Agency CMBS, and Senior Non-Agency RMBS portfolio given the attractive returns and liquidity profile. Our existing portfolio remains stable given low-LTVs (Wavg HPI LTV of 49%) and 180 months of seasoning. Credit Performance Potential book value increase of $1.69 per share if the accretable discount (net of premiums) on all assets and securitized debt were to be realized with current loss assumptions. Potential book value increase of $2.23 per share assuming all assets and securitized debt were to be repaid at par value. Strong liquidity position. Chimera has $308 million in cash and $524 million in unencumbered assets. Financing & Liquidity* Low recourse leverage of 1.1x. Net positive carry on our interest rate swaps positions. Expected to go higher as Fed increases rates. Interest Rate Hedging* Combination of swaps and swaptions to hedge net interest margin and protect against mark-to-market financing. *Information as of February 2023. Information is unaudited, estimated and subject to change. 10

APPENDIX
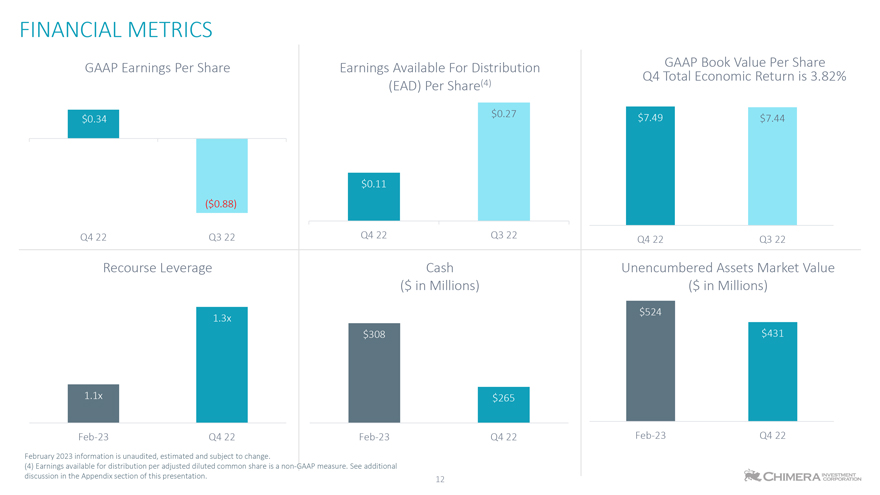
FINANCIAL METRICS GAAP Earnings Per Share Earnings Available For Distribution Q4 Total GAAP Economic Book Value Return Per Share is 3.82% (EAD) Per Share(4) $0.27 $7.49 $7.44 $0.34 $0.11 ($0.88) Q4 22 Q3 22 Q4 22 Q3 22 Q4 22 Q3 22 Recourse Leverage Cash Unencumbered Assets Market Value ($ in Millions) ($ in Millions) $524 1.3x $308 $431 1.1x $265 Feb-23 Q4 22 Feb-23 Q4 22 Feb-23 Q4 22 February 2023 information is unaudited, estimated and subject to change. (4) Earnings available for distribution per adjusted diluted common share is a non-GAAP measure. See additional discussion in the Appendix section of this presentation. 12
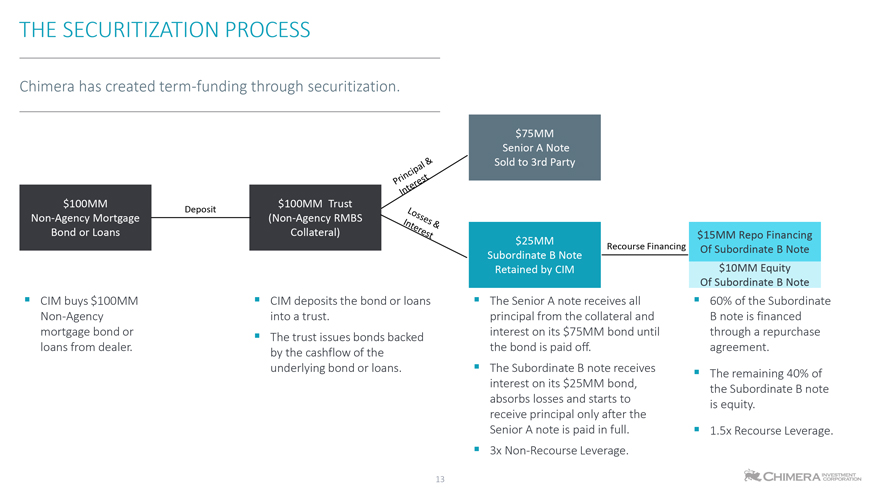
THE SECURITIZATION PROCESS Chimera has created term-funding through securitization. $75MM Senior A Note Sold to 3rd Party $100MM Deposit $100MM Trust Non-Agency Mortgage (Non-Agency RMBS Bond or Loans Collateral) $15MM Repo Financing $25MM Recourse Financing Subordinate B Note Of Subordinate B Note Retained by CIM $10MM Equity Of Subordinate B Note CIM buys $100MM CIM deposits the bond or loans The Senior A note receives all 60% of the Subordinate Non-Agency into a trust. principal from the collateral and B note is financed mortgage bond or The trust issues bonds backed interest on its $75MM bond until through a repurchase loans from dealer. by the cashflow of the the bond is paid off. agreement. underlying bond or loans. The Subordinate B note receives The remaining 40% of interest on its $25MM bond, the Subordinate B note absorbs losses and starts to is equity. receive principal only after the Senior A note is paid in full. 1.5x Recourse Leverage. 3x Non-Recourse Leverage. 13
EARNINGS AVAILABLE FOR DISTRIBUTION Earnings available for distribution is a non-GAAP measure and is defined as GAAP net income excluding unrealized gains or losses on financial instruments carried at fair value with changes in fair value recorded in earnings, realized gains or losses on the sales of investments, gains or losses on the extinguishment of debt, interest expense on long term debt, changes in the provision for credit losses, other gains or losses on equity investments, and transaction expenses incurred. In addition, stock compensation expense charges incurred on awards to retirement eligible employees is reflected as an expense over a vesting period (36 months) rather than reported as an immediate expense. Earnings available for distribution is the Economic net interest income, reduced by compensation and benefits expenses (adjusted for awards to retirement eligible employees), general and administrative expenses, servicing and asset manager fees, income tax benefits or expenses incurred during the period, as well as the preferred dividend charges. Economic net interest income is a non-GAAP financial measure that equals GAAP net interest income adjusted for interest expense on long term debt, net periodic interest cost of interest rate swaps and excludes interest earned on cash. See a reconciliation of Economic net interest income to the most relevant GAAP measure below. We view Earnings available for distribution as one measure of our investment portfolios ability to generate income for distribution to common stockholders. Earnings available for distribution is one of the metrics, but not the exclusive metric, that our Board of Directors uses to determine the amount, if any, of dividends on our common stock. Other metrics that our Board of Directors may consider when determining the amount, if any, of dividends on our common stock include (among others) REIT taxable income, dividend yield, book value, cash generated from the portfolio, reinvestment opportunities and other cash needs. In addition, Earnings available for distribution is different than REIT taxable income and the determination of whether we have met the requirement to distribute at least 90% of our annual REIT taxable income (subject to certain adjustments) to our stockholders in order to maintain qualification as a REIT is not based on Earnings available for distribution. Therefore, Earnings available for distribution should not be considered as an indication of our REIT taxable income, a guaranty of our ability to pay dividends, or as a proxy for the amount of dividends we may pay. We believe Earnings available for distribution as described above helps us and investors evaluate our financial performance period over period without the impact of certain transactions. Therefore, Earnings available for distribution should not be viewed in isolation and is not a substitute for net income or net income per basic share computed in accordance with GAAP. In addition, our methodology for calculating Earnings available for distribution may differ from the methodologies employed by other REITs to calculate the same or similar supplemental performance measures, and accordingly, our Earnings available for distribution may not be comparable to the Earnings available for distribution reported by other REITs.
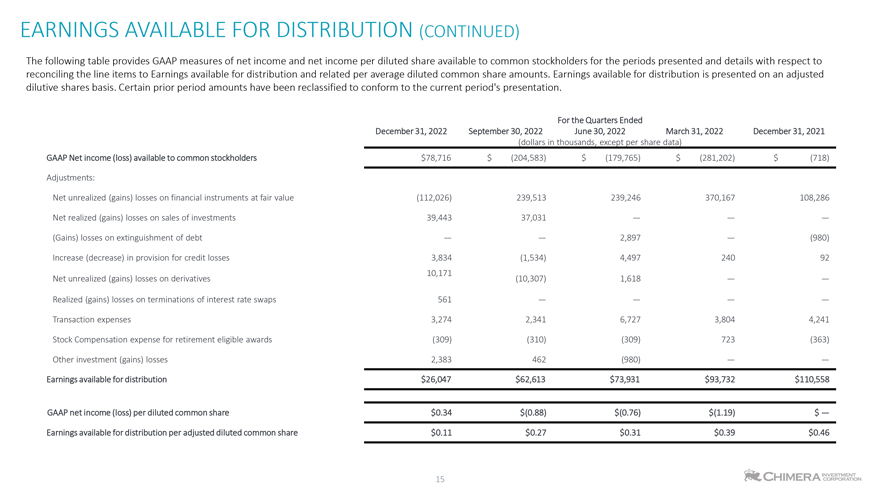
EARNINGS AVAILABLE FOR DISTRIBUTION (CONTINUED) The following table provides GAAP measures of net income and net income per diluted share available to common stockholders for the periods presented and details with respect to reconciling the line items to Earnings available for distribution and related per average diluted common share amounts. Earnings available for distribution is presented on an adjusted dilutive shares basis. Certain prior period amounts have been reclassified to conform to the current periods presentation. For the Quarters Ended December 31, 2022 September 30, 2022 June 30, 2022 March 31, 2022 December 31, 2021 (dollars in thousands, except per share data) GAAP Net income (loss) available to common stockholders $78,716 $ (204,583) $ (179,765) $ (281,202) $ (718) Adjustments: Net unrealized (gains) losses on financial instruments at fair value (112,026) 239,513 239,246 370,167 108,286 Net realized (gains) losses on sales of investments 39,443 37,031 (Gains) losses on extinguishment of debt 2,897 (980) Increase (decrease) in provision for credit losses 3,834 (1,534) 4,497 240 92 10,171 Net unrealized (gains) losses on derivatives (10,307) 1,618 Realized (gains) losses on terminations of interest rate swaps 561 Transaction expenses 3,274 2,341 6,727 3,804 4,241 Stock Compensation expense for retirement eligible awards (309) (310) (309) 723 (363) Other investment (gains) losses 2,383 462 (980) Earnings available for distribution $26,047 $62,613 $73,931 $93,732 $110,558 GAAP net income (loss) per diluted common share $0.34 $(0.88) $(0.76) $(1.19) $ Earnings available for distribution per adjusted diluted common share $0.11 $0.27 $0.31 $0.39 $0.46

Information is unaudited, estimated and subject to change.