EX-99.2
Published on November 6, 2025

Q 3 2 0 2 5 | I N V E S T O R P R E S E N T A T I O N N o v e m b e r 6 , 2 0 2 5
I n f o r m a t i o n u n a u d i t e d , e s t i m a t e d , a n d s u b j e c t t o c h a n g e . This presentation includes “forward-looking statements” within the meaning of the safe harbor provisions of the United States Private Securities Litigation Reform Act of 1995, including as related to the expected impact (including related to Chimera’s future earnings) of Chimera’s acquisition of HomeXpress. Actual results may differ from expectations, estimates and projections and, consequently, readers should not rely on these forward-looking statements as predictions of future events. Words such as “goal,” “expect,” “target,” “assume,” “estimate,” “project,” “budget,” “forecast,” “anticipate,” “intend,” “plan,” “may,” “would,” “will,” “could,” “should,” “believe,” “predict,” “potential,” “continue,” or similar expressions are intended to identify such forward-looking statements. These forward-looking statements involve significant risks and uncertainties that could cause actual results to differ materially from expected results, including, among other things, those described in our most recent Annual Report on Form 10-K, and any subsequent Quarterly Reports on Form 10-Q and Current Reports on Form 8-K, under the caption “Risk Factors.” Factors that could cause actual results to differ include, but are not limited to: the potential that Chimera may not fully realize the expected benefits of the acquisition of HomeXpress, including the potential financial impact; our ability to obtain funding on favorable terms and access the capital markets; our ability to achieve optimal levels of leverage and effectively manage our liquidity; changes in inflation, the yield curve, interest rates and mortgage prepayment rates; our ability to manage credit risk related to our investments and comply with the Dodd-Frank Act and related laws and regulations relating to credit risk retention for securitizations; rates of default, delinquencies, forbearance, deferred payments or decreased recovery rates on our investments; the concentration of properties securing our securities and residential loans in a small number of geographic areas; our ability to execute on our business and investment strategy; our ability to determine accurately the fair market value of our assets; changes in our industry, the general economy or geopolitical conditions; our ability to successfully integrate and realize the anticipated benefits of any acquisitions, including the acquisition of The Palisades Group in 2024 and the acquisition of HomeXpress; our ability to originate or acquire quality and profitable loans at an appropriate and consistent cost; our ability to sell the loans that we originate or acquire; our ability to refinance or obtain additional liquidity for borrowing; our ability to operate our investment management and advisory services and manage any regulatory rules and conflicts of interest; the degree to which our hedging strategies may or may not be effective; our ability to effect our strategy to securitize residential mortgage loans; our ability to compete with competitors and source target assets at attractive prices; our ability to find and retain qualified executive officers and key personnel; the ability of servicers and other third parties to perform their services at a high level and comply with applicable law and expanding regulations; our dependence on information technology and its susceptibility to cyber-attacks; our ability to comply with extensive government regulation, including, but not limited to, federal and state consumer lending regulations; the impact of and changes in governmental regulations, tax law and rates, accounting guidance, refinancing and borrowing guidelines and similar matters; our ability to maintain our exemption from registration under the Investment Company Act of 1940, as amended; our ability to maintain our classification as a real estate investment trust for U.S. federal income tax purposes; the volatility of the market price and trading volume of our shares; and our ability to make distributions to our stockholders in the future. Readers are cautioned not to place undue reliance upon any forward-looking statements, which speak only as of the date made. Chimera does not undertake or accept any obligation to release publicly any updates or revisions to any forward-looking statement to reflect any change in its expectations or any change in events, conditions or circumstances on which any such statement is based. Additional information concerning these, and other risk factors, is contained in Chimera’s most recent filings with the Securities and Exchange Commission (SEC). All subsequent written and oral forward-looking statements concerning Chimera or matters attributable to Chimera or any person acting on its behalf are expressly qualified in their entirety by the cautionary statements above. This presentation may include industry and market data obtained through research, surveys, and studies conducted by third parties and industry publications. We have not independently verified any such market and industry data from third-party sources. This presentation is provided for discussion purposes only and may not be relied upon as legal or investment advice, nor is it intended to be inclusive of all the risks and uncertainties that should be considered. This presentation does not constitute an offer to purchase or sell any securities, nor shall it be construed to be indicative of the terms of an offer that the parties or their respective affiliates would accept. We use our website (www.chimerareit.com) as a channel of distribution of company information. The information we post on our website may be deemed material. Accordingly, investors should monitor our website, in addition to following our press releases, SEC filings and public conference calls and webcasts. In addition, you may automatically receive email alerts and other information about Chimera when you enroll your email address by visiting our website, then clicking on “News and Events" and selecting "Email Alerts" to complete the email notification form. Our website and any alerts are not incorporated into this document. All information in this presentation is as of September 30, 2025, unless stated otherwise. Readers are advised that the financial information in this presentation is based on company data available at the time of this presentation and, in certain circumstances, may not have been audited by the company’s independent auditors. Disclaimer 2
I n f o r m a t i o n u n a u d i t e d , e s t i m a t e d , a n d s u b j e c t t o c h a n g e . This presentation includes certain non-GAAP financial measures, including earnings available for distribution. We believe the non-GAAP financial measures are useful for management, investors, analysts, and other interested parties in evaluating our performance but should not be viewed in isolation and are not a substitute for financial measures computed in accordance with U.S. generally accepted accounting principles (“GAAP”). In addition, we may calculate our non-GAAP metrics, such as earnings available for distribution, differently than our peers making comparative analysis difficult. Non-GAAP Financial Measures 3
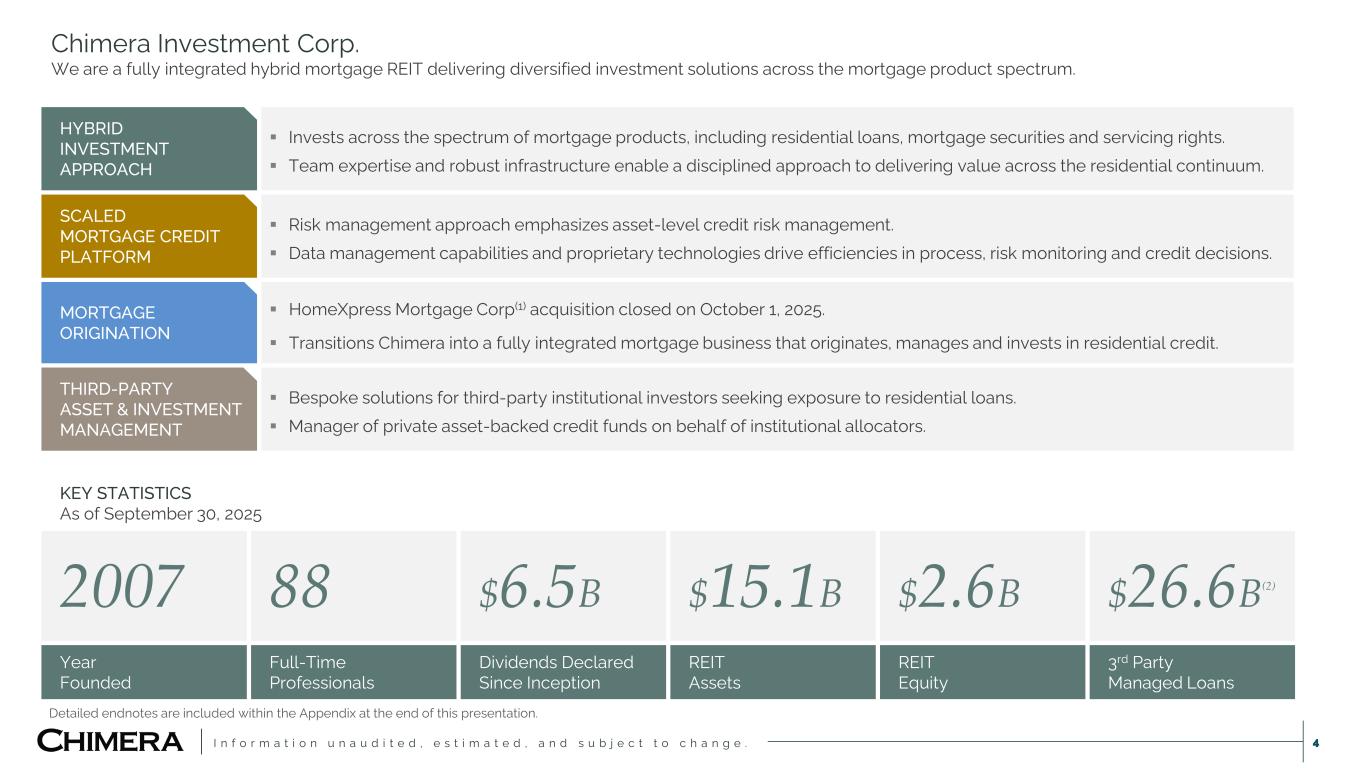
I n f o r m a t i o n u n a u d i t e d , e s t i m a t e d , a n d s u b j e c t t o c h a n g e . 4 HYBRID INVESTMENT APPROACH Invests across the spectrum of mortgage products, including residential loans, mortgage securities and servicing rights. Team expertise and robust infrastructure enable a disciplined approach to delivering value across the residential continuum. SCALED MORTGAGE CREDIT PLATFORM Risk management approach emphasizes asset-level credit risk management. Data management capabilities and proprietary technologies drive efficiencies in process, risk monitoring and credit decisions. MORTGAGE ORIGINATION HomeXpress Mortgage Corp(1) acquisition closed on October 1, 2025. Transitions Chimera into a fully integrated mortgage business that originates, manages and invests in residential credit. THIRD-PARTY ASSET & INVESTMENT MANAGEMENT Bespoke solutions for third-party institutional investors seeking exposure to residential loans. Manager of private asset-backed credit funds on behalf of institutional allocators. KEY STATISTICS As of September 30, 2025 2007 88 $6.5B $15.1B $2.6B $26.6B(2) Year Founded Full-Time Professionals Dividends Declared Since Inception REIT Assets REIT Equity 3rd Party Managed Loans Chimera Investment Corp. We are a fully integrated hybrid mortgage REIT delivering diversified investment solutions across the mortgage product spectrum. Detailed endnotes are included within the Appendix at the end of this presentation.
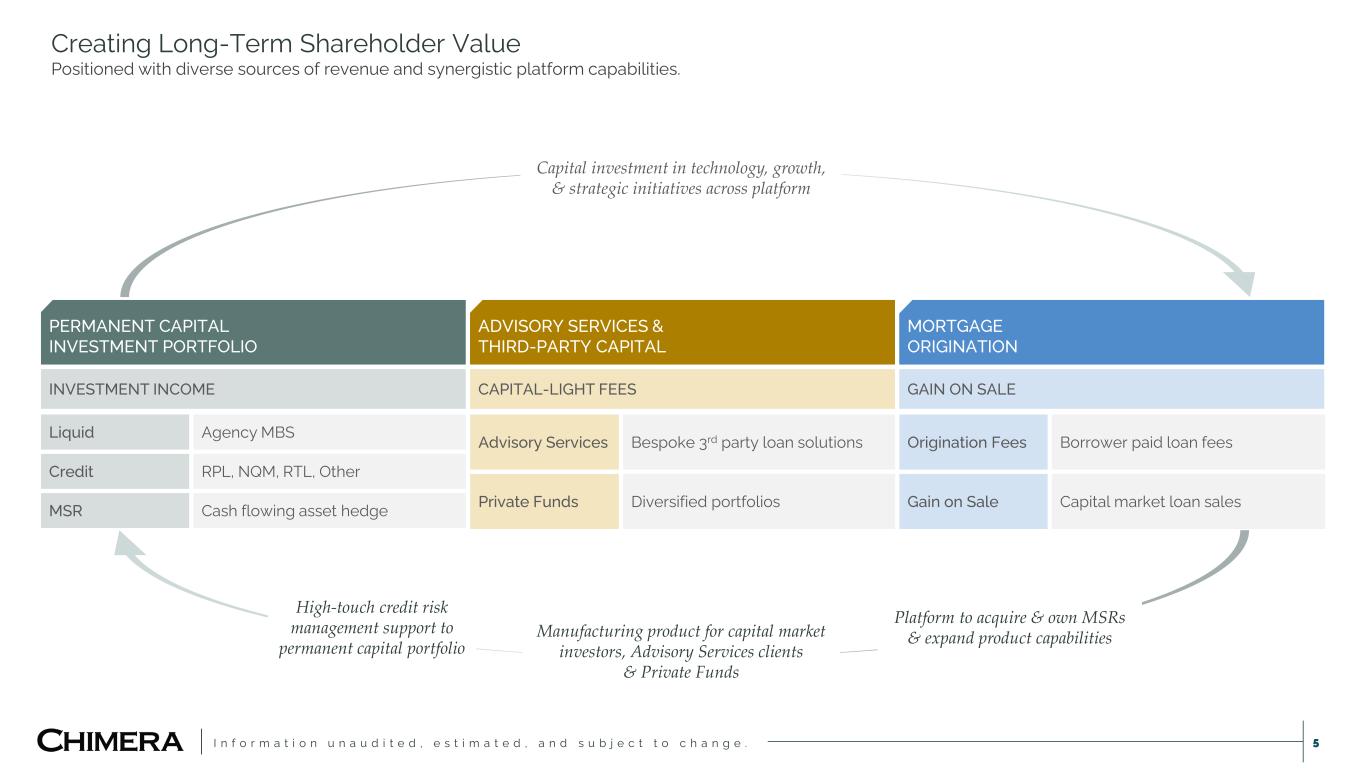
I n f o r m a t i o n u n a u d i t e d , e s t i m a t e d , a n d s u b j e c t t o c h a n g e . 5 Creating Long-Term Shareholder Value Positioned with diverse sources of revenue and synergistic platform capabilities. PERMANENT CAPITAL INVESTMENT PORTFOLIO ADVISORY SERVICES & THIRD-PARTY CAPITAL MORTGAGE ORIGINATION Liquid Agency MBS Credit RPL, NQM, RTL, Other MSR Cash flowing asset hedge Advisory Services Bespoke 3rd party loan solutions Private Funds Diversified portfolios Origination Fees Borrower paid loan fees Gain on Sale Capital market loan sales INVESTMENT INCOME CAPITAL-LIGHT FEES GAIN ON SALE High-touch credit risk management support to permanent capital portfolio Platform to acquire & own MSRs & expand product capabilitiesManufacturing product for capital market investors, Advisory Services clients & Private Funds Capital investment in technology, growth, & strategic initiatives across platform
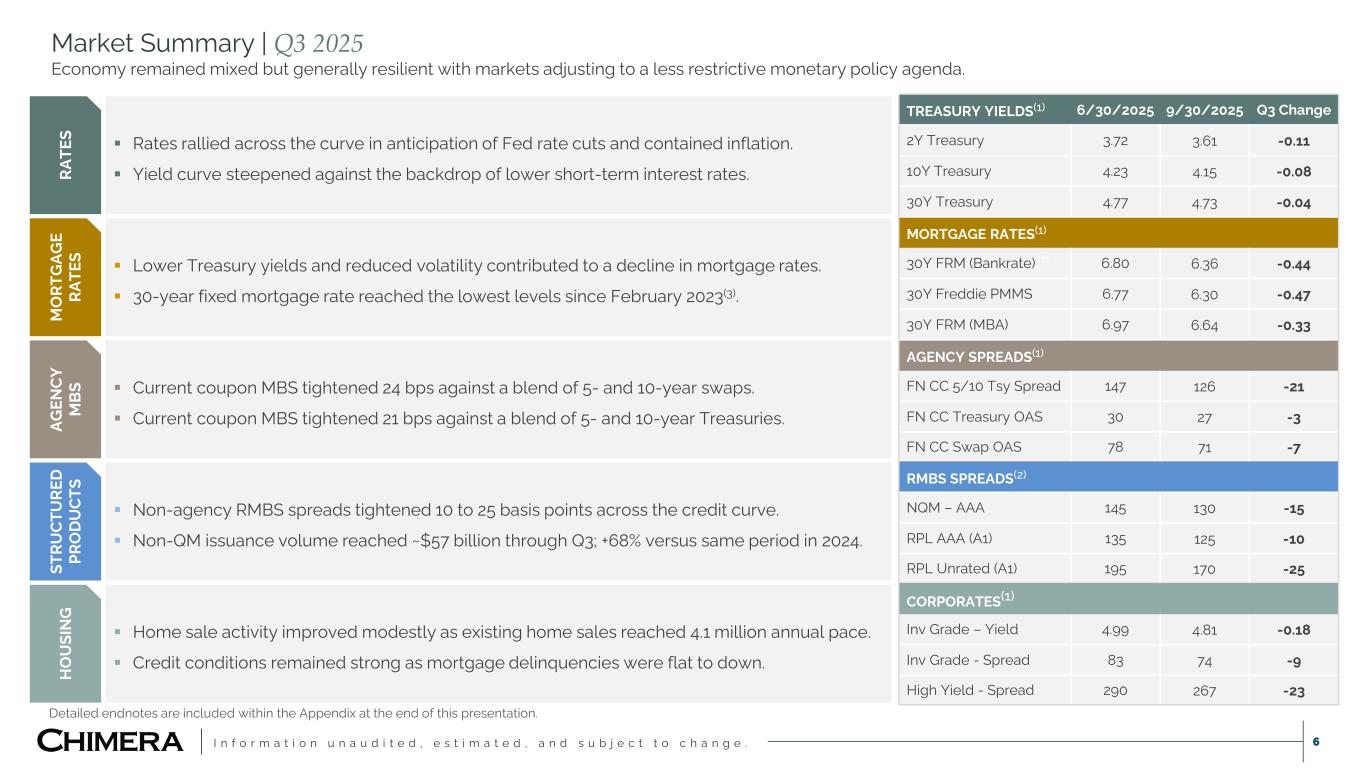
I n f o r m a t i o n u n a u d i t e d , e s t i m a t e d , a n d s u b j e c t t o c h a n g e . 6 Market Summary | Q3 2025 Economy remained mixed but generally resilient with markets adjusting to a less restrictive monetary policy agenda. TREASURY YIELDS(1) 6/30/2025 9/30/2025 Q3 Change 2Y Treasury 3.72 3.61 -0.11 10Y Treasury 4.23 4.15 -0.08 30Y Treasury 4.77 4.73 -0.04 MORTGAGE RATES(1) 30Y FRM (Bankrate) (2) 6.80 6.36 -0.44 30Y Freddie PMMS 6.77 6.30 -0.47 30Y FRM (MBA) 6.97 6.64 -0.33 AGENCY SPREADS(1) FN CC 5/10 Tsy Spread 147 126 -21 FN CC Treasury OAS 30 27 -3 FN CC Swap OAS 78 71 -7 RMBS SPREADS(2) NQM – AAA 145 130 -15 RPL AAA (A1) 135 125 -10 RPL Unrated (A1) 195 170 -25 CORPORATES(1) Inv Grade – Yield 4.99 4.81 -0.18 Inv Grade - Spread 83 74 -9 High Yield - Spread 290 267 -23 RA TE S Rates rallied across the curve in anticipation of Fed rate cuts and contained inflation. Yield curve steepened against the backdrop of lower short-term interest rates. M O RT G AG E RA TE S Lower Treasury yields and reduced volatility contributed to a decline in mortgage rates. 30-year fixed mortgage rate reached the lowest levels since February 2023(3). AG EN C Y M B S Current coupon MBS tightened 24 bps against a blend of 5- and 10-year swaps. Current coupon MBS tightened 21 bps against a blend of 5- and 10-year Treasuries. ST RU C TU RE D PR O D U C TS Non-agency RMBS spreads tightened 10 to 25 basis points across the credit curve. Non-QM issuance volume reached ~$57 billion through Q3; +68% versus same period in 2024. H O U SI N G Home sale activity improved modestly as existing home sales reached 4.1 million annual pace. Credit conditions remained strong as mortgage delinquencies were flat to down. Detailed endnotes are included within the Appendix at the end of this presentation.
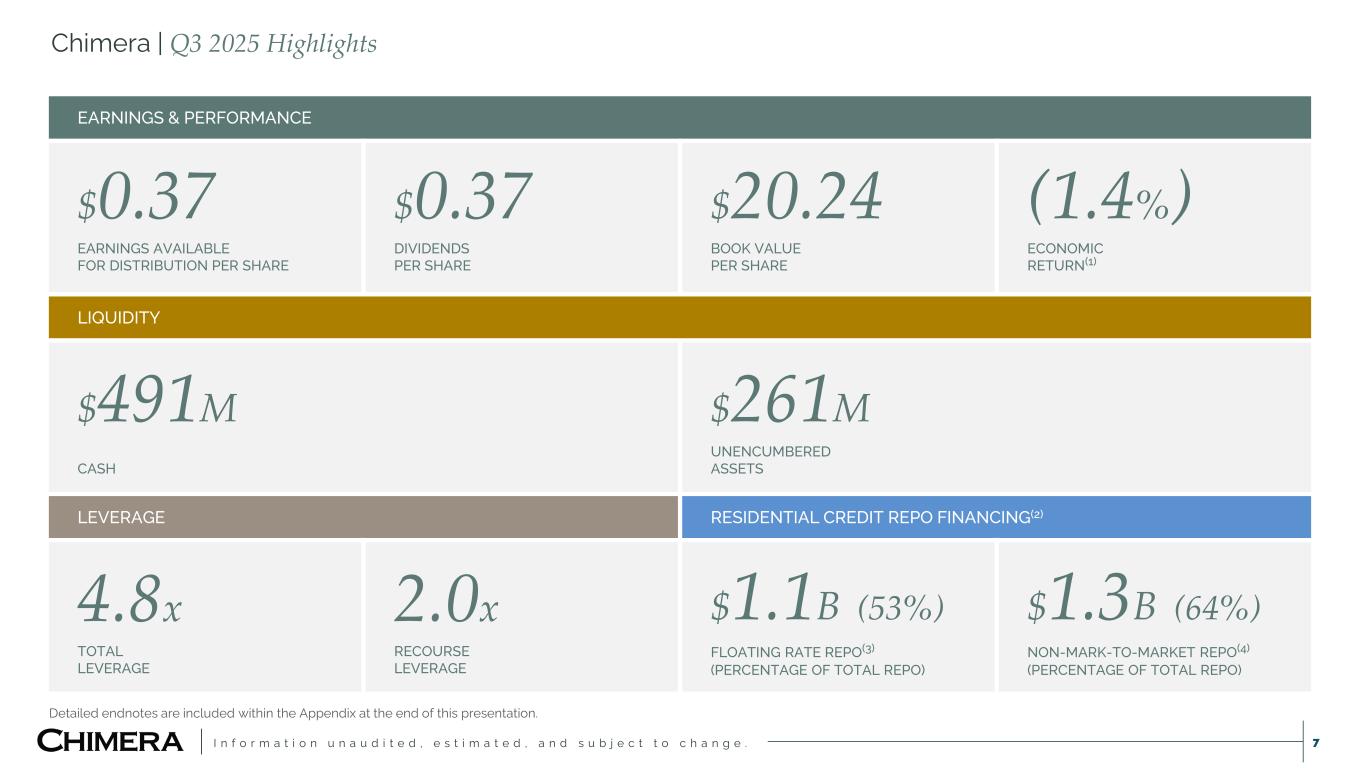
I n f o r m a t i o n u n a u d i t e d , e s t i m a t e d , a n d s u b j e c t t o c h a n g e . 7 EARNINGS & PERFORMANCE $0.37 EARNINGS AVAILABLE FOR DISTRIBUTION PER SHARE $0.37 DIVIDENDS PER SHARE $20.24 BOOK VALUE PER SHARE (1.4%) ECONOMIC RETURN(1) LIQUIDITY $491M CASH $261M UNENCUMBERED ASSETS LEVERAGE RESIDENTIAL CREDIT REPO FINANCING(2) 4.8x TOTAL LEVERAGE 2.0x RECOURSE LEVERAGE $1.1B (53%) FLOATING RATE REPO(3) (PERCENTAGE OF TOTAL REPO) $1.3B (64%) NON-MARK-TO-MARKET REPO(4) (PERCENTAGE OF TOTAL REPO) Chimera | Q3 2025 Highlights Detailed endnotes are included within the Appendix at the end of this presentation.
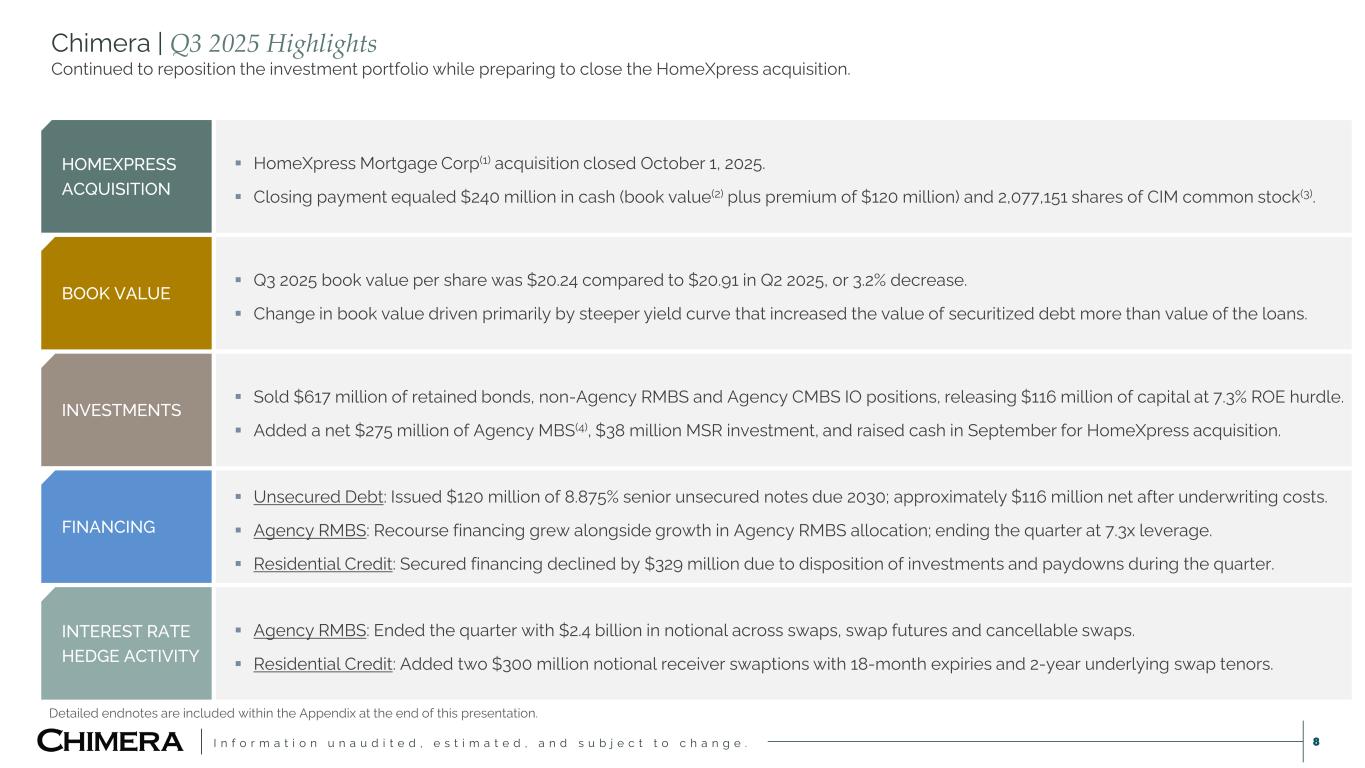
I n f o r m a t i o n u n a u d i t e d , e s t i m a t e d , a n d s u b j e c t t o c h a n g e . 8 Chimera | Q3 2025 Highlights Continued to reposition the investment portfolio while preparing to close the HomeXpress acquisition. HOMEXPRESS ACQUISITION HomeXpress Mortgage Corp(1) acquisition closed October 1, 2025. Closing payment equaled $240 million in cash (book value(2) plus premium of $120 million) and 2,077,151 shares of CIM common stock(3). BOOK VALUE Q3 2025 book value per share was $20.24 compared to $20.91 in Q2 2025, or 3.2% decrease. Change in book value driven primarily by steeper yield curve that increased the value of securitized debt more than value of the loans. INVESTMENTS Sold $617 million of retained bonds, non-Agency RMBS and Agency CMBS IO positions, releasing $116 million of capital at 7.3% ROE hurdle. Added a net $275 million of Agency MBS(4), $38 million MSR investment, and raised cash in September for HomeXpress acquisition. FINANCING Unsecured Debt: Issued $120 million of 8.875% senior unsecured notes due 2030; approximately $116 million net after underwriting costs. Agency RMBS: Recourse financing grew alongside growth in Agency RMBS allocation; ending the quarter at 7.3x leverage. Residential Credit: Secured financing declined by $329 million due to disposition of investments and paydowns during the quarter. INTEREST RATE HEDGE ACTIVITY Agency RMBS: Ended the quarter with $2.4 billion in notional across swaps, swap futures and cancellable swaps. Residential Credit: Added two $300 million notional receiver swaptions with 18-month expiries and 2-year underlying swap tenors. Detailed endnotes are included within the Appendix at the end of this presentation.
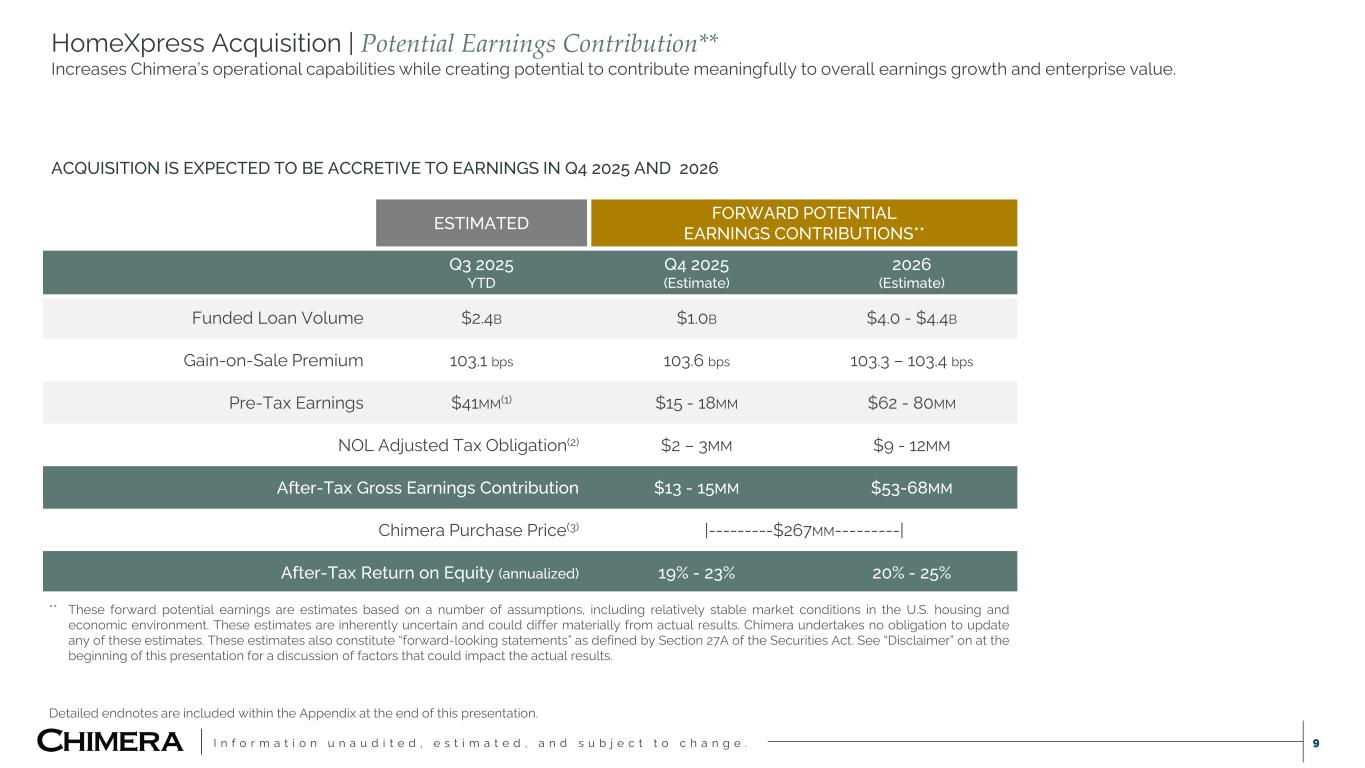
I n f o r m a t i o n u n a u d i t e d , e s t i m a t e d , a n d s u b j e c t t o c h a n g e . 9 HomeXpress Acquisition | Potential Earnings Contribution** Increases Chimera’s operational capabilities while creating potential to contribute meaningfully to overall earnings growth and enterprise value. ESTIMATED FORWARD POTENTIAL EARNINGS CONTRIBUTIONS** Q3 2025 YTD Q4 2025 (Estimate) 2026 (Estimate) Funded Loan Volume $2.4B $1.0B $4.0 - $4.4B Gain-on-Sale Premium 103.1 bps 103.6 bps 103.3 – 103.4 bps Pre-Tax Earnings $41MM(1) $15 - 18MM $62 - 80MM NOL Adjusted Tax Obligation(2) $2 – 3MM $9 - 12MM After-Tax Gross Earnings Contribution $13 - 15MM $53-68MM Chimera Purchase Price(3) |---------$267MM---------| After-Tax Return on Equity (annualized) 19% - 23% 20% - 25% ACQUISITION IS EXPECTED TO BE ACCRETIVE TO EARNINGS IN Q4 2025 AND 2026 ** These forward potential earnings are estimates based on a number of assumptions, including relatively stable market conditions in the U.S. housing and economic environment. These estimates are inherently uncertain and could differ materially from actual results. Chimera undertakes no obligation to update any of these estimates. These estimates also constitute “forward-looking statements” as defined by Section 27A of the Securities Act. See “Disclaimer” on at the beginning of this presentation for a discussion of factors that could impact the actual results. Detailed endnotes are included within the Appendix at the end of this presentation.
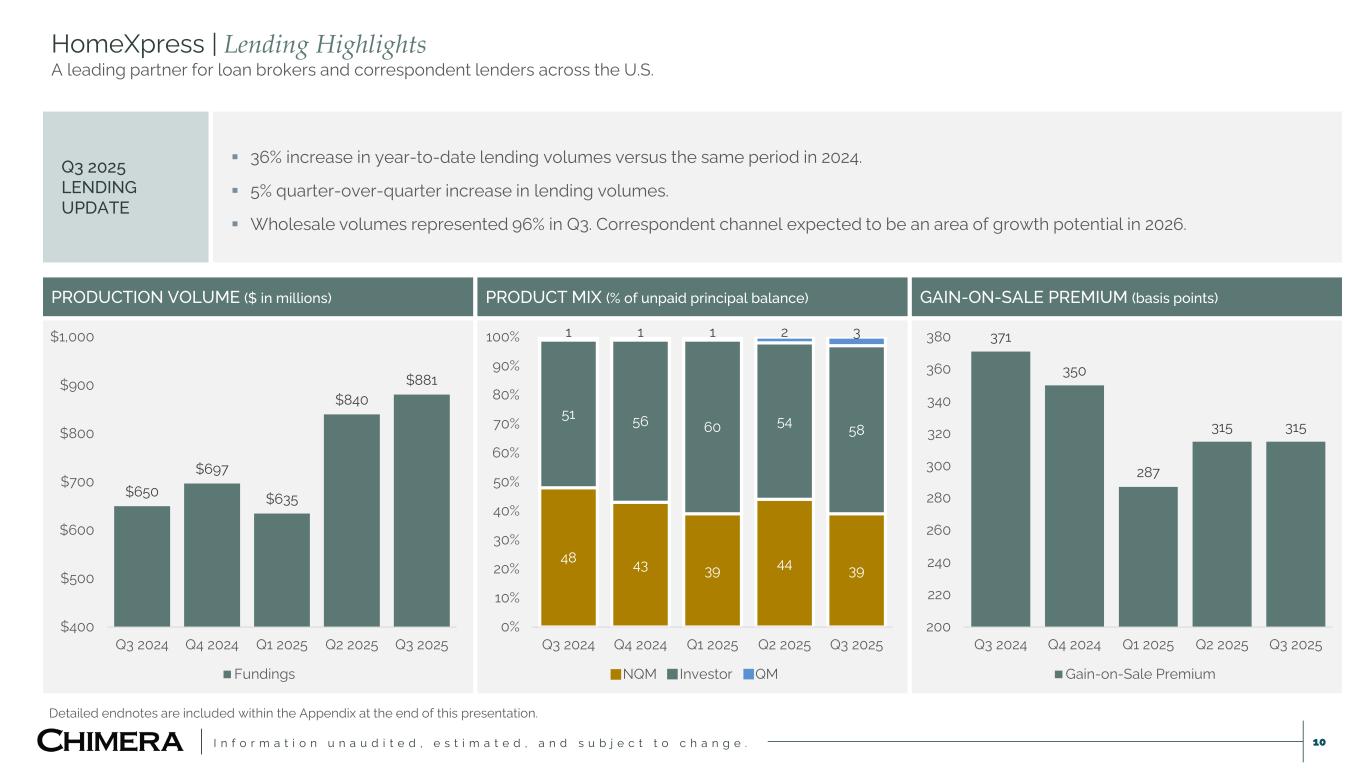
I n f o r m a t i o n u n a u d i t e d , e s t i m a t e d , a n d s u b j e c t t o c h a n g e . 10 HomeXpress | Lending Highlights A leading partner for loan brokers and correspondent lenders across the U.S. Q3 2025 LENDING UPDATE 36% increase in year-to-date lending volumes versus the same period in 2024. 5% quarter-over-quarter increase in lending volumes. Wholesale volumes represented 96% in Q3. Correspondent channel expected to be an area of growth potential in 2026. PRODUCTION VOLUME ($ in millions) PRODUCT MIX (% of unpaid principal balance) GAIN-ON-SALE PREMIUM (basis points) $650 $697 $635 $840 $881 $400 $500 $600 $700 $800 $900 $1,000 Q3 2024 Q4 2024 Q1 2025 Q2 2025 Q3 2025 Fundings 48 43 39 44 39 51 56 60 54 58 1 1 1 2 3 0% 10% 20% 30% 40% 50% 60% 70% 80% 90% 100% Q3 2024 Q4 2024 Q1 2025 Q2 2025 Q3 2025 NQM Investor QM 371 350 287 315 315 200 220 240 260 280 300 320 340 360 380 Q3 2024 Q4 2024 Q1 2025 Q2 2025 Q3 2025 Gain-on-Sale Premium Detailed endnotes are included within the Appendix at the end of this presentation.
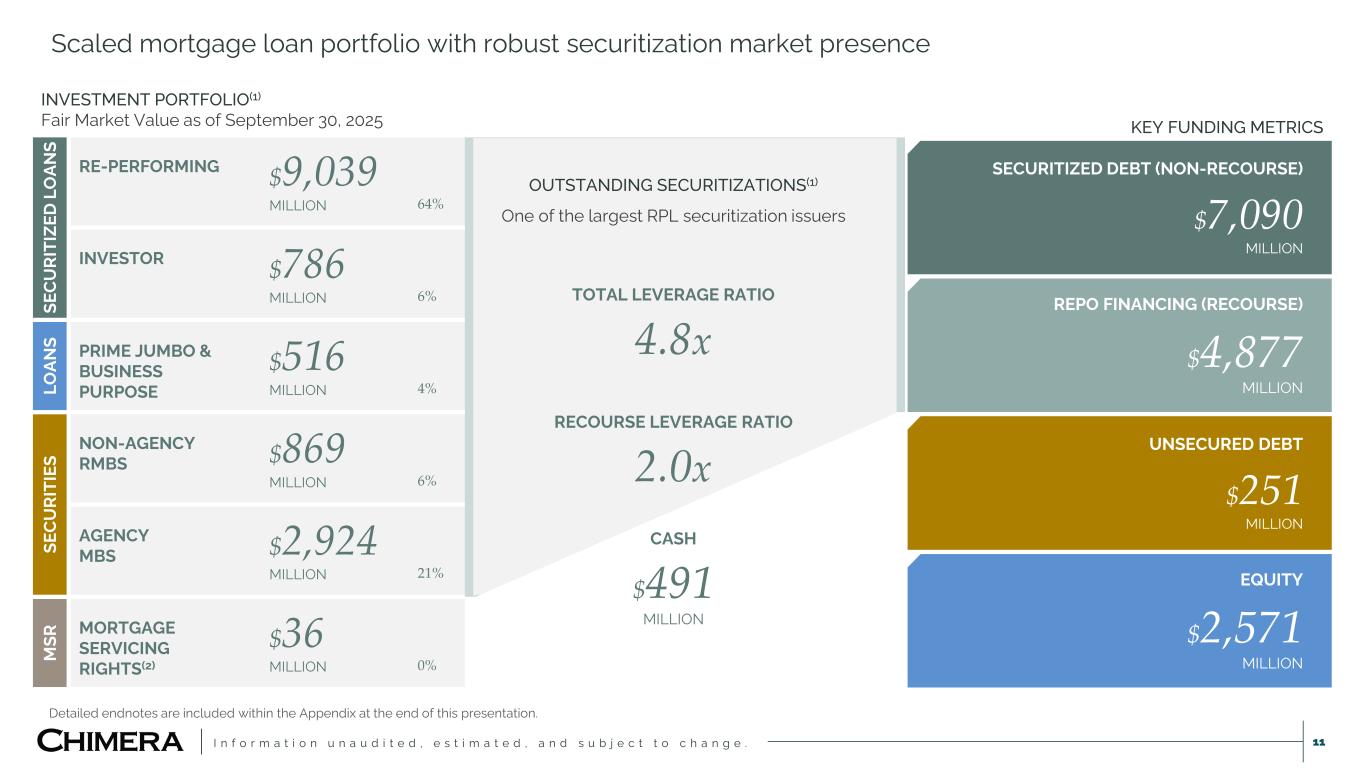
I n f o r m a t i o n u n a u d i t e d , e s t i m a t e d , a n d s u b j e c t t o c h a n g e . 11 Scaled mortgage loan portfolio with robust securitization market presence Detailed endnotes are included within the Appendix at the end of this presentation. SECURITIZED DEBT (NON-RECOURSE) $7,090 MILLION REPO FINANCING (RECOURSE) $4,877 MILLION UNSECURED DEBT $251 MILLION EQUITY $2,571 MILLION KEY FUNDING METRICS INVESTMENT PORTFOLIO(1) Fair Market Value as of September 30, 2025 SE C U RI TI ZE D L O AN S RE-PERFORMING $9,039 MILLION 64% INVESTOR $786 MILLION 6% LO AN S PRIME JUMBO & BUSINESS PURPOSE $516 MILLION 4% SE C U RI TI ES NON-AGENCY RMBS $869 MILLION 6% AGENCY MBS $2,924 MILLION 21% M SR MORTGAGE SERVICING RIGHTS(2) $36 MILLION 0% OUTSTANDING SECURITIZATIONS(1) One of the largest RPL securitization issuers TOTAL LEVERAGE RATIO 4.8x RECOURSE LEVERAGE RATIO 2.0x CASH $491 MILLION
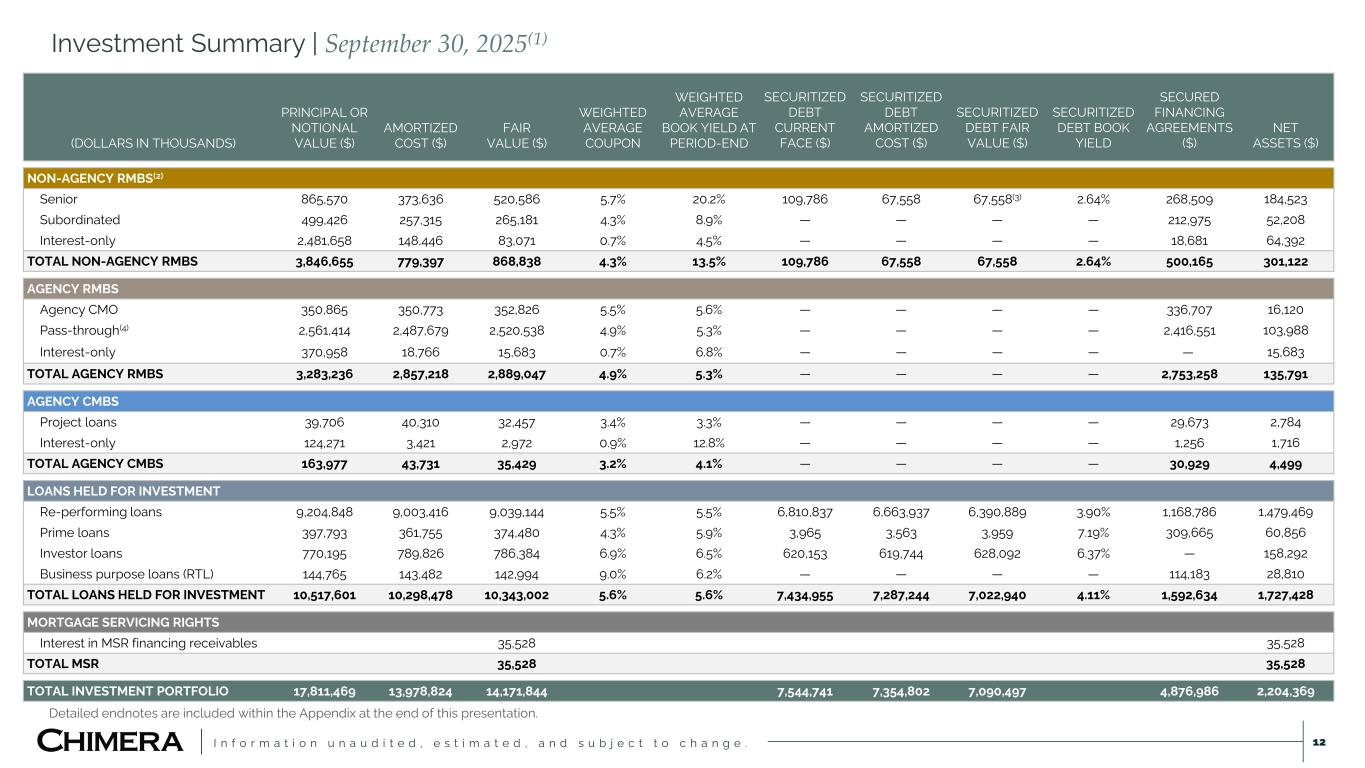
I n f o r m a t i o n u n a u d i t e d , e s t i m a t e d , a n d s u b j e c t t o c h a n g e . Investment Summary | September 30, 2025(1) 12 Detailed endnotes are included within the Appendix at the end of this presentation. (DOLLARS IN THOUSANDS) PRINCIPAL OR NOTIONAL VALUE ($) AMORTIZED COST ($) FAIR VALUE ($) WEIGHTED AVERAGE COUPON WEIGHTED AVERAGE BOOK YIELD AT PERIOD-END SECURITIZED DEBT CURRENT FACE ($) SECURITIZED DEBT AMORTIZED COST ($) SECURITIZED DEBT FAIR VALUE ($) SECURITIZED DEBT BOOK YIELD SECURED FINANCING AGREEMENTS ($) NET ASSETS ($) NON-AGENCY RMBS(2) Senior 865,570 373,636 520,586 5.7% 20.2% 109,786 67,558 67,558(3) 2.64% 268,509 184,523 Subordinated 499,426 257,315 265,181 4.3% 8.9% — — — — 212,975 52,208 Interest-only 2,481,658 148,446 83,071 0.7% 4.5% — — — — 18,681 64,392 TOTAL NON-AGENCY RMBS 3,846,655 779,397 868,838 4.3% 13.5% 109,786 67,558 67,558 2.64% 500,165 301,122 AGENCY RMBS Agency CMO 350,865 350,773 352,826 5.5% 5.6% — — — — 336,707 16,120 Pass-through(4) 2,561,414 2,487,679 2,520,538 4.9% 5.3% — — — — 2,416,551 103,988 Interest-only 370,958 18,766 15,683 0.7% 6.8% — — — — — 15,683 TOTAL AGENCY RMBS 3,283,236 2,857,218 2,889,047 4.9% 5.3% — — — — 2,753,258 135,791 AGENCY CMBS Project loans 39,706 40,310 32,457 3.4% 3.3% — — — — 29,673 2,784 Interest-only 124,271 3,421 2,972 0.9% 12.8% — — — — 1,256 1,716 TOTAL AGENCY CMBS 163,977 43,731 35,429 3.2% 4.1% — — — — 30,929 4,499 LOANS HELD FOR INVESTMENT Re-performing loans 9,204,848 9,003,416 9,039,144 5.5% 5.5% 6,810,837 6,663,937 6,390,889 3.90% 1,168,786 1,479,469 Prime loans 397,793 361,755 374,480 4.3% 5.9% 3,965 3,563 3,959 7.19% 309,665 60,856 Investor loans 770,195 789,826 786,384 6.9% 6.5% 620,153 619,744 628,092 6.37% — 158,292 Business purpose loans (RTL) 144,765 143,482 142,994 9.0% 6.2% — — — — 114,183 28,810 TOTAL LOANS HELD FOR INVESTMENT 10,517,601 10,298,478 10,343,002 5.6% 5.6% 7,434,955 7,287,244 7,022,940 4.11% 1,592,634 1,727,428 MORTGAGE SERVICING RIGHTS Interest in MSR financing receivables 35,528 35,528 TOTAL MSR 35,528 35,528 TOTAL INVESTMENT PORTFOLIO 17,811,469 13,978,824 14,171,844 7,544,741 7,354,802 7,090,497 4,876,986 2,204,369
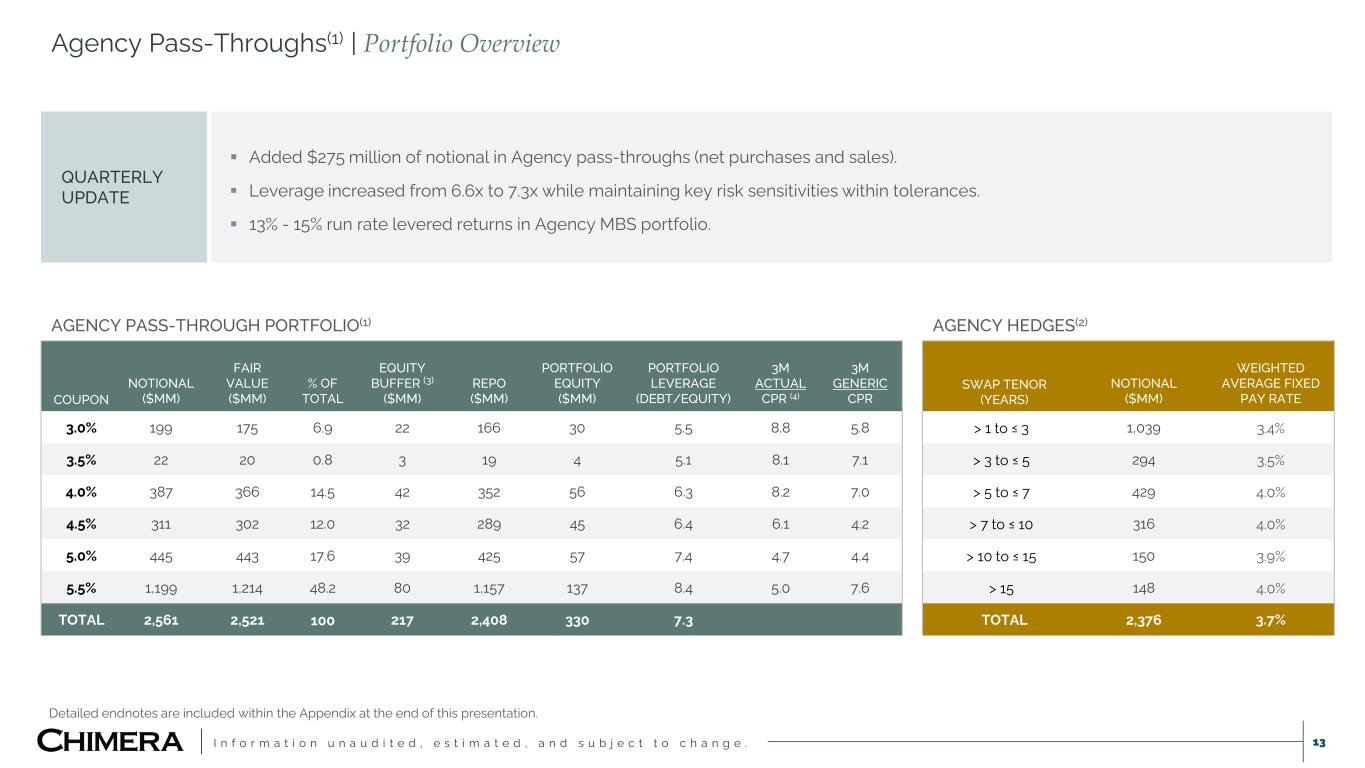
I n f o r m a t i o n u n a u d i t e d , e s t i m a t e d , a n d s u b j e c t t o c h a n g e . 13 Agency Pass-Throughs(1) | Portfolio Overview QUARTERLY UPDATE Added $275 million of notional in Agency pass-throughs (net purchases and sales). Leverage increased from 6.6x to 7.3x while maintaining key risk sensitivities within tolerances. 13% - 15% run rate levered returns in Agency MBS portfolio. COUPON NOTIONAL ($MM) FAIR VALUE ($MM) % OF TOTAL EQUITY BUFFER (3) ($MM) REPO ($MM) PORTFOLIO EQUITY ($MM) PORTFOLIO LEVERAGE (DEBT/EQUITY) 3M ACTUAL CPR (4) 3M GENERIC CPR 3.0% 199 175 6.9 22 166 30 5.5 8.8 5.8 3.5% 22 20 0.8 3 19 4 5.1 8.1 7.1 4.0% 387 366 14.5 42 352 56 6.3 8.2 7.0 4.5% 311 302 12.0 32 289 45 6.4 6.1 4.2 5.0% 445 443 17.6 39 425 57 7.4 4.7 4.4 5.5% 1,199 1,214 48.2 80 1,157 137 8.4 5.0 7.6 TOTAL 2,561 2,521 100 217 2,408 330 7.3 AGENCY PASS-THROUGH PORTFOLIO(1) SWAP TENOR (YEARS) NOTIONAL ($MM) WEIGHTED AVERAGE FIXED PAY RATE > 1 to ≤ 3 1,039 3.4% > 3 to ≤ 5 294 3.5% > 5 to ≤ 7 429 4.0% > 7 to ≤ 10 316 4.0% > 10 to ≤ 15 150 3.9% > 15 148 4.0% TOTAL 2,376 3.7% AGENCY HEDGES(2) Detailed endnotes are included within the Appendix at the end of this presentation.
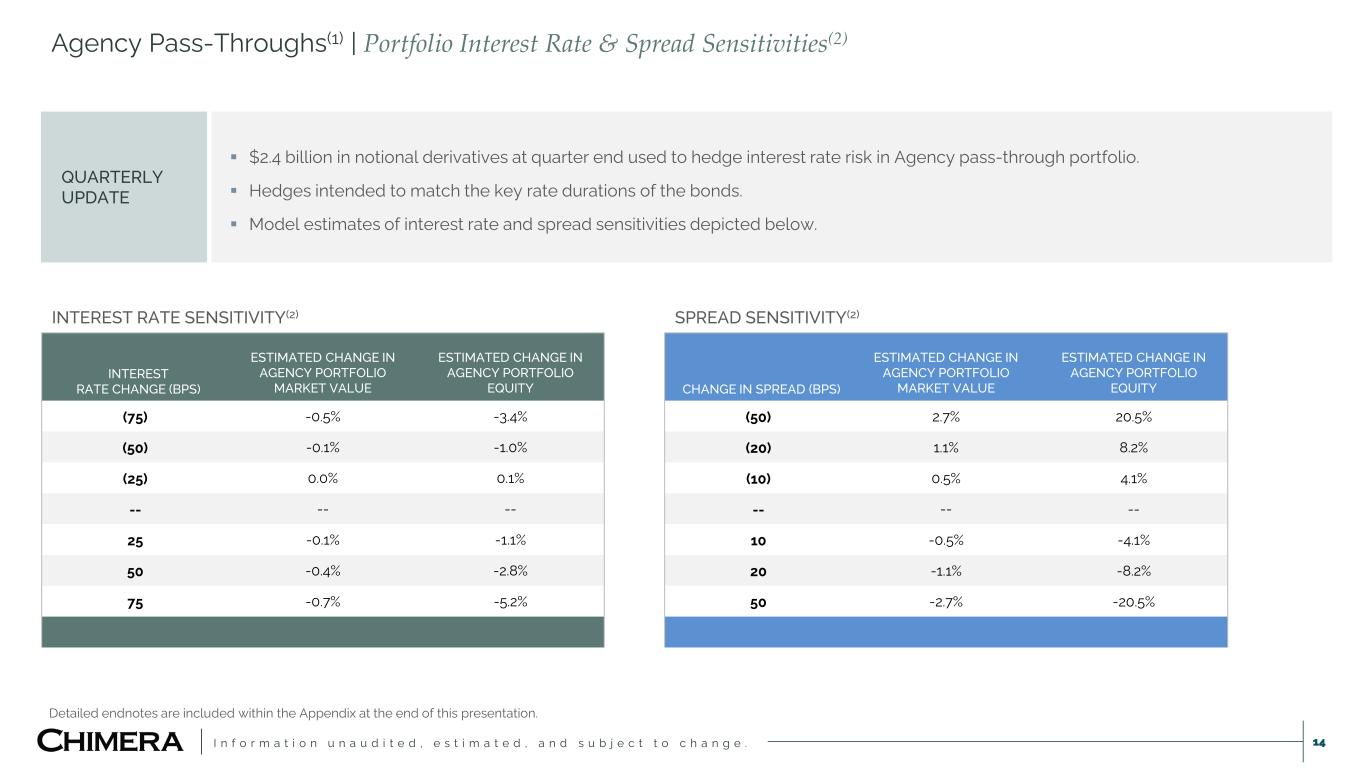
I n f o r m a t i o n u n a u d i t e d , e s t i m a t e d , a n d s u b j e c t t o c h a n g e . 14 Agency Pass-Throughs(1) | Portfolio Interest Rate & Spread Sensitivities(2) QUARTERLY UPDATE $2.4 billion in notional derivatives at quarter end used to hedge interest rate risk in Agency pass-through portfolio. Hedges intended to match the key rate durations of the bonds. Model estimates of interest rate and spread sensitivities depicted below. INTEREST RATE CHANGE (BPS) ESTIMATED CHANGE IN AGENCY PORTFOLIO MARKET VALUE ESTIMATED CHANGE IN AGENCY PORTFOLIO EQUITY (75) -0.5% -3.4% (50) -0.1% -1.0% (25) 0.0% 0.1% -- -- -- 25 -0.1% -1.1% 50 -0.4% -2.8% 75 -0.7% -5.2% INTEREST RATE SENSITIVITY(2) CHANGE IN SPREAD (BPS) ESTIMATED CHANGE IN AGENCY PORTFOLIO MARKET VALUE ESTIMATED CHANGE IN AGENCY PORTFOLIO EQUITY (50) 2.7% 20.5% (20) 1.1% 8.2% (10) 0.5% 4.1% -- -- -- 10 -0.5% -4.1% 20 -1.1% -8.2% 50 -2.7% -20.5% SPREAD SENSITIVITY(2) Detailed endnotes are included within the Appendix at the end of this presentation.
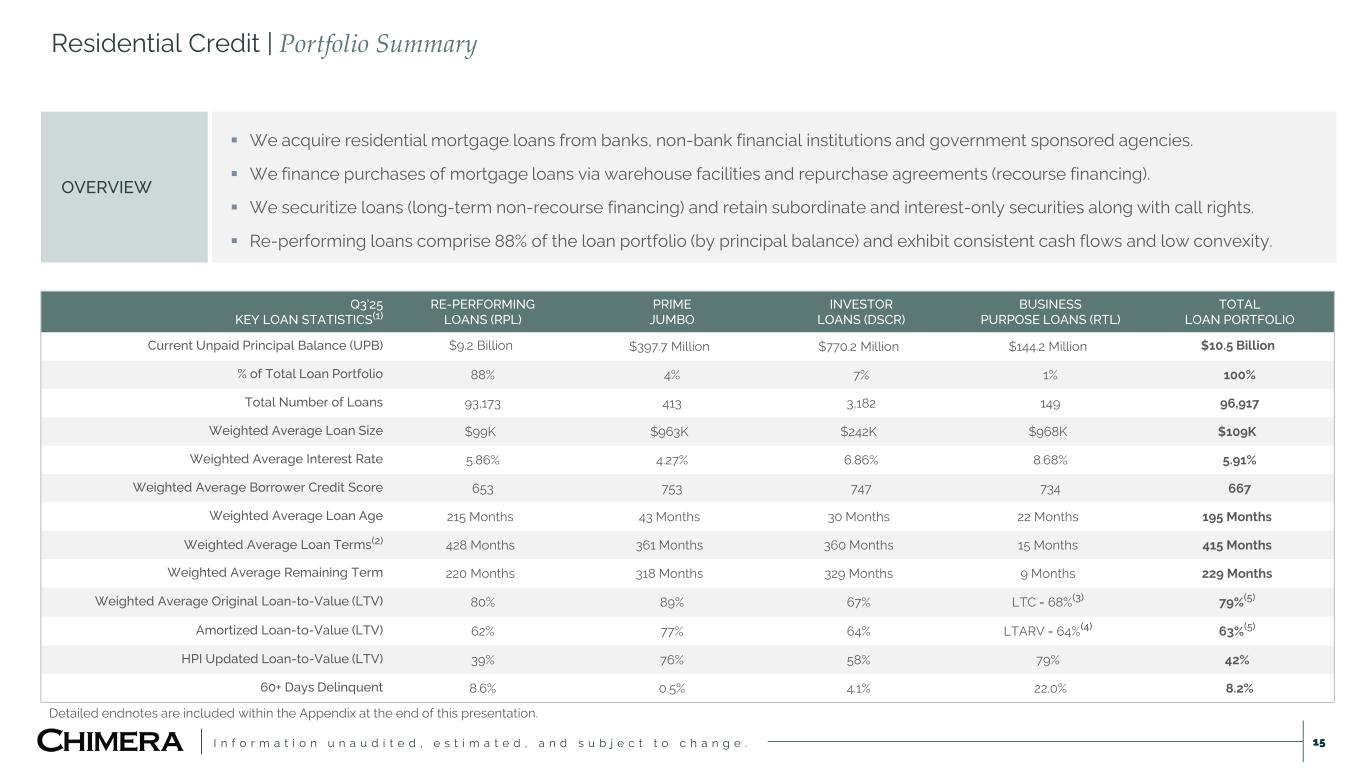
I n f o r m a t i o n u n a u d i t e d , e s t i m a t e d , a n d s u b j e c t t o c h a n g e . Residential Credit | Portfolio Summary 15 OVERVIEW We acquire residential mortgage loans from banks, non-bank financial institutions and government sponsored agencies. We finance purchases of mortgage loans via warehouse facilities and repurchase agreements (recourse financing). We securitize loans (long-term non-recourse financing) and retain subordinate and interest-only securities along with call rights. Re-performing loans comprise 88% of the loan portfolio (by principal balance) and exhibit consistent cash flows and low convexity. Q3’25 KEY LOAN STATISTICS(1) RE-PERFORMING LOANS (RPL) PRIME JUMBO INVESTOR LOANS (DSCR) BUSINESS PURPOSE LOANS (RTL) TOTAL LOAN PORTFOLIO Current Unpaid Principal Balance (UPB) $9.2 Billion $397.7 Million $770.2 Million $144.2 Million $10.5 Billion % of Total Loan Portfolio 88% 4% 7% 1% 100% Total Number of Loans 93,173 413 3,182 149 96,917 Weighted Average Loan Size $99K $963K $242K $968K $109K Weighted Average Interest Rate 5.86% 4.27% 6.86% 8.68% 5.91% Weighted Average Borrower Credit Score 653 753 747 734 667 Weighted Average Loan Age 215 Months 43 Months 30 Months 22 Months 195 Months Weighted Average Loan Terms(2) 428 Months 361 Months 360 Months 15 Months 415 Months Weighted Average Remaining Term 220 Months 318 Months 329 Months 9 Months 229 Months Weighted Average Original Loan-to-Value (LTV) 80% 89% 67% LTC = 68%(3) 79%(5) Amortized Loan-to-Value (LTV) 62% 77% 64% LTARV = 64%(4) 63%(5) HPI Updated Loan-to-Value (LTV) 39% 76% 58% 79% 42% 60+ Days Delinquent 8.6% 0.5% 4.1% 22.0% 8.2% Detailed endnotes are included within the Appendix at the end of this presentation.
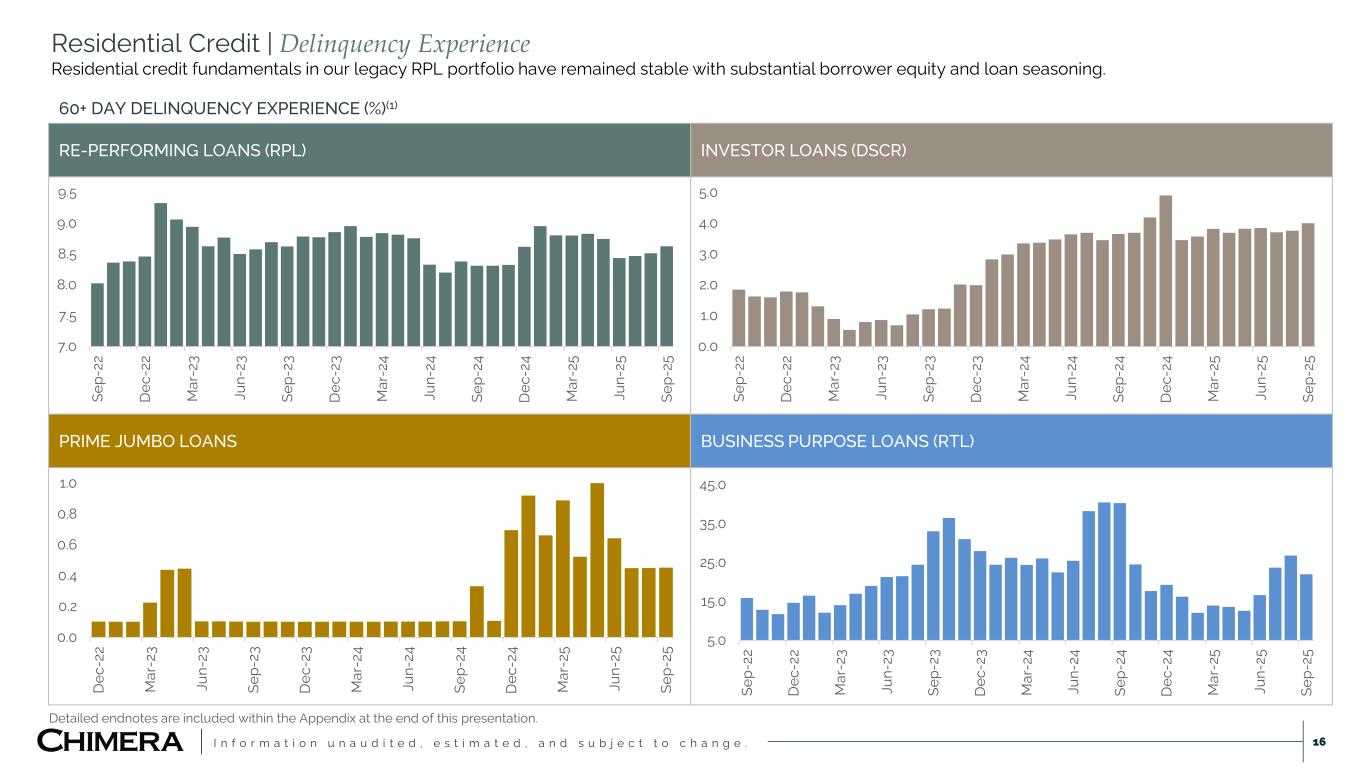
I n f o r m a t i o n u n a u d i t e d , e s t i m a t e d , a n d s u b j e c t t o c h a n g e . 16 RE-PERFORMING LOANS (RPL) INVESTOR LOANS (DSCR) PRIME JUMBO LOANS BUSINESS PURPOSE LOANS (RTL) 5.0 15.0 25.0 35.0 45.0 Se p- 22 D ec -2 2 M ar -2 3 Ju n- 23 Se p- 23 D ec -2 3 M ar -2 4 Ju n- 24 Se p- 24 D ec -2 4 M ar -2 5 Ju n- 25 Se p- 25 Residential Credit | Delinquency Experience Residential credit fundamentals in our legacy RPL portfolio have remained stable with substantial borrower equity and loan seasoning. 60+ DAY DELINQUENCY EXPERIENCE (%)(1) 0.0 1.0 2.0 3.0 4.0 5.0 Se p- 22 D ec -2 2 M ar -2 3 Ju n- 23 Se p- 23 D ec -2 3 M ar -2 4 Ju n- 24 Se p- 24 D ec -2 4 M ar -2 5 Ju n- 25 Se p- 25 7.0 7.5 8.0 8.5 9.0 9.5 Se p- 22 D ec -2 2 M ar -2 3 Ju n- 23 Se p- 23 D ec -2 3 M ar -2 4 Ju n- 24 Se p- 24 D ec -2 4 M ar -2 5 Ju n- 25 Se p- 25 0.0 0.2 0.4 0.6 0.8 1.0 D ec -2 2 M ar -2 3 Ju n- 23 Se p- 23 D ec -2 3 M ar -2 4 Ju n- 24 Se p- 24 D ec -2 4 M ar -2 5 Ju n- 25 Se p- 25 Detailed endnotes are included within the Appendix at the end of this presentation.
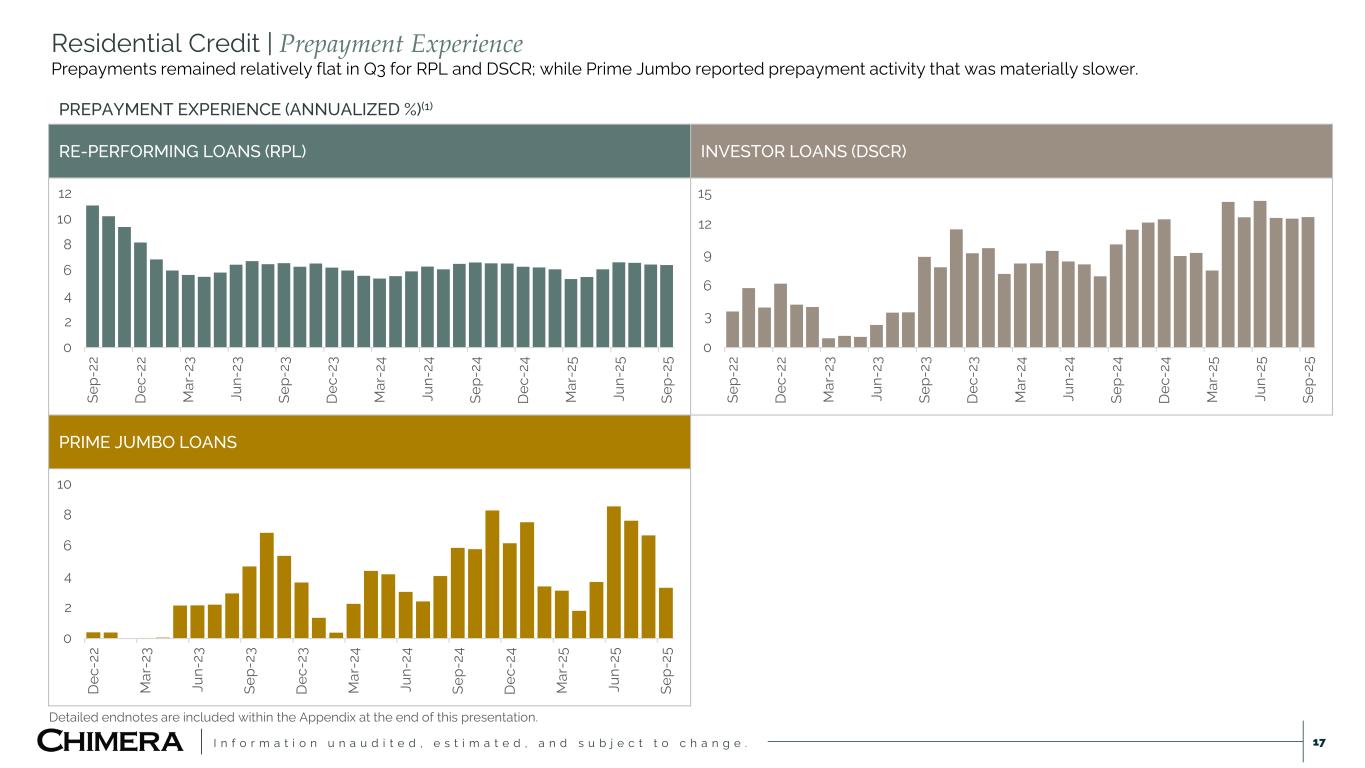
I n f o r m a t i o n u n a u d i t e d , e s t i m a t e d , a n d s u b j e c t t o c h a n g e . 17 Residential Credit | Prepayment Experience Prepayments remained relatively flat in Q3 for RPL and DSCR; while Prime Jumbo reported prepayment activity that was materially slower. RE-PERFORMING LOANS (RPL) INVESTOR LOANS (DSCR) PRIME JUMBO LOANS 0 2 4 6 8 10 12 Se p- 22 D ec -2 2 M ar -2 3 Ju n- 23 Se p- 23 D ec -2 3 M ar -2 4 Ju n- 24 Se p- 24 D ec -2 4 M ar -2 5 Ju n- 25 Se p- 25 0 2 4 6 8 10 D ec -2 2 M ar -2 3 Ju n- 23 Se p- 23 D ec -2 3 M ar -2 4 Ju n- 24 Se p- 24 D ec -2 4 M ar -2 5 Ju n- 25 Se p- 25 PREPAYMENT EXPERIENCE (ANNUALIZED %)(1) 0 3 6 9 12 15 Se p- 22 D ec -2 2 M ar -2 3 Ju n- 23 Se p- 23 D ec -2 3 M ar -2 4 Ju n- 24 Se p- 24 D ec -2 4 M ar -2 5 Ju n- 25 Se p- 25 Detailed endnotes are included within the Appendix at the end of this presentation.
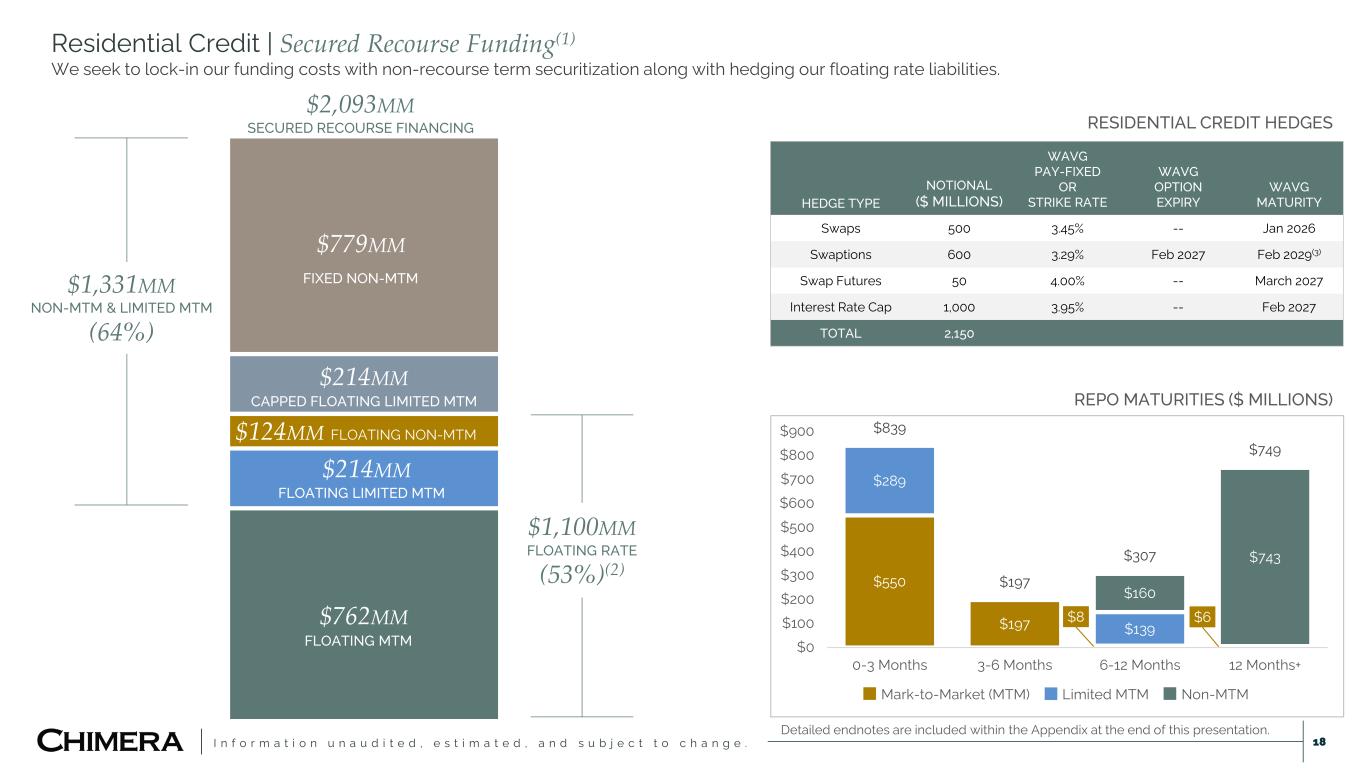
I n f o r m a t i o n u n a u d i t e d , e s t i m a t e d , a n d s u b j e c t t o c h a n g e . Residential Credit | Secured Recourse Funding(1) We seek to lock-in our funding costs with non-recourse term securitization along with hedging our floating rate liabilities. 18 $762MM $214MM $124MM FLOATING NON-MTM $214MM CAPPED FLOATING LIMITED MTM $779MM FLOATING MTM FLOATING LIMITED MTM FIXED NON-MTM $2,093MM SECURED RECOURSE FINANCING Q1 2025 EXPECTED REPO MATURITIES ($ MILLIONS) HEDGE TYPE NOTIONAL ($ MILLIONS) WAVG PAY-FIXED OR STRIKE RATE WAVG OPTION EXPIRY WAVG MATURITY Swaps 500 3.45% -- Jan 2026 Swaptions 600 3.29% Feb 2027 Feb 2029(3) Swap Futures 50 4.00% -- March 2027 Interest Rate Cap 1,000 3.95% -- Feb 2027 TOTAL 2,150 RESIDENTIAL CREDIT HEDGES REPO MATURITIES ($ MILLIONS) $1,331MM NON-MTM & LIMITED MTM (64%) $1,100MM FLOATING RATE (53%)(2) Detailed endnotes are included within the Appendix at the end of this presentation. $550 $197 $8 $6 $289 $139 $160 $743 $839 $197 $307 $749 $0 $100 $200 $300 $400 $500 $600 $700 $800 $900 0-3 Months 3-6 Months 6-12 Months 12 Months+ Mark-to-Market (MTM) Limited MTM Non-MTM
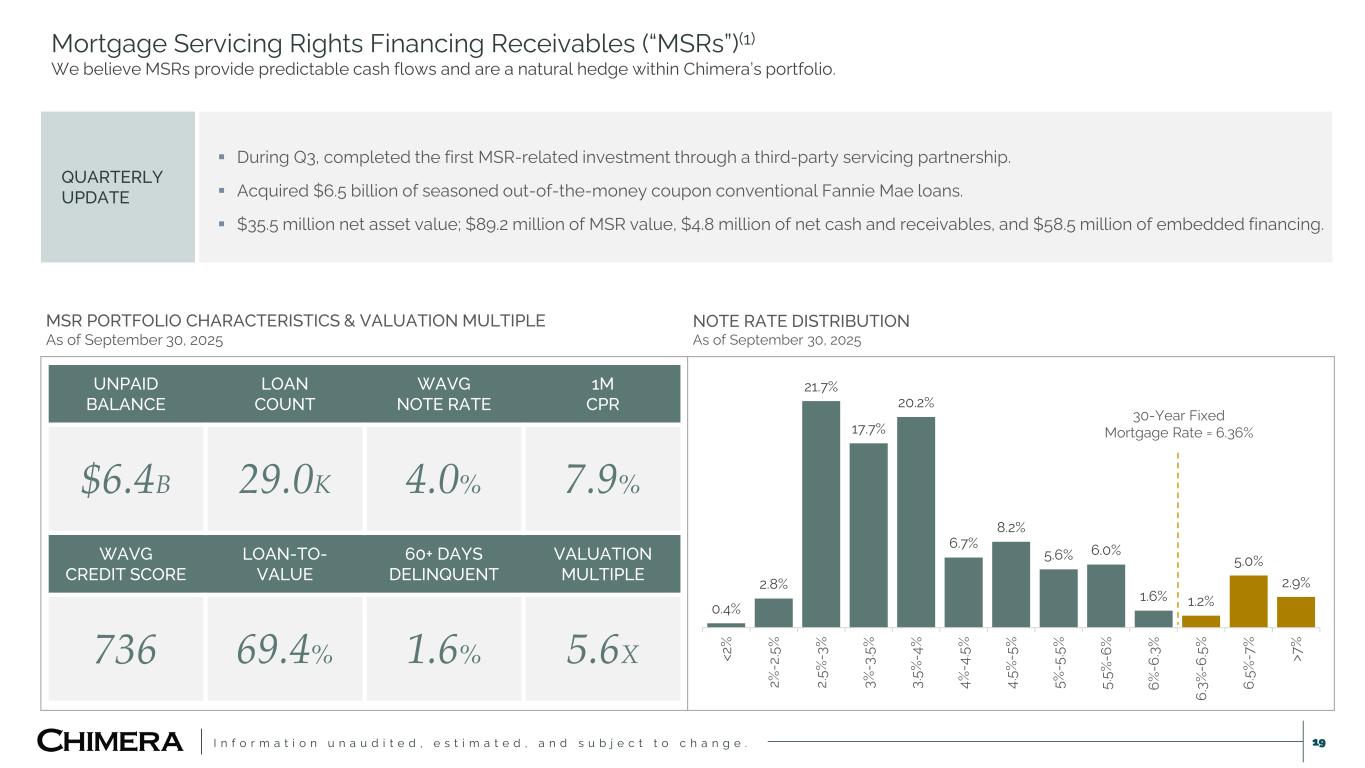
I n f o r m a t i o n u n a u d i t e d , e s t i m a t e d , a n d s u b j e c t t o c h a n g e . 19 Mortgage Servicing Rights Financing Receivables (“MSRs”)(1) We believe MSRs provide predictable cash flows and are a natural hedge within Chimera’s portfolio. MSR PORTFOLIO CHARACTERISTICS & VALUATION MULTIPLE As of September 30, 2025 QUARTERLY UPDATE During Q3, completed the first MSR-related investment through a third-party servicing partnership. Acquired $6.5 billion of seasoned out-of-the-money coupon conventional Fannie Mae loans. $35.5 million net asset value; $89.2 million of MSR value, $4.8 million of net cash and receivables, and $58.5 million of embedded financing. UNPAID BALANCE LOAN COUNT WAVG NOTE RATE 1M CPR $6.4B 29.0K 4.0% 7.9% WAVG CREDIT SCORE LOAN-TO- VALUE 60+ DAYS DELINQUENT VALUATION MULTIPLE 736 69.4% 1.6% 5.6X 0.4% 2.8% 21.7% 17.7% 20.2% 6.7% 8.2% 5.6% 6.0% 1.6% 1.2% 5.0% 2.9% <2 % 2% -2 .5 % 2. 5% -3 % 3% -3 .5 % 3. 5% -4 % 4% -4 .5 % 4. 5% -5 % 5% -5 .5 % 5. 5% -6 % 6% -6 .3 % 6. 3% -6 .5 % 6. 5% -7 % >7 % NOTE RATE DISTRIBUTION As of September 30, 2025 30-Year Fixed Mortgage Rate = 6.36%
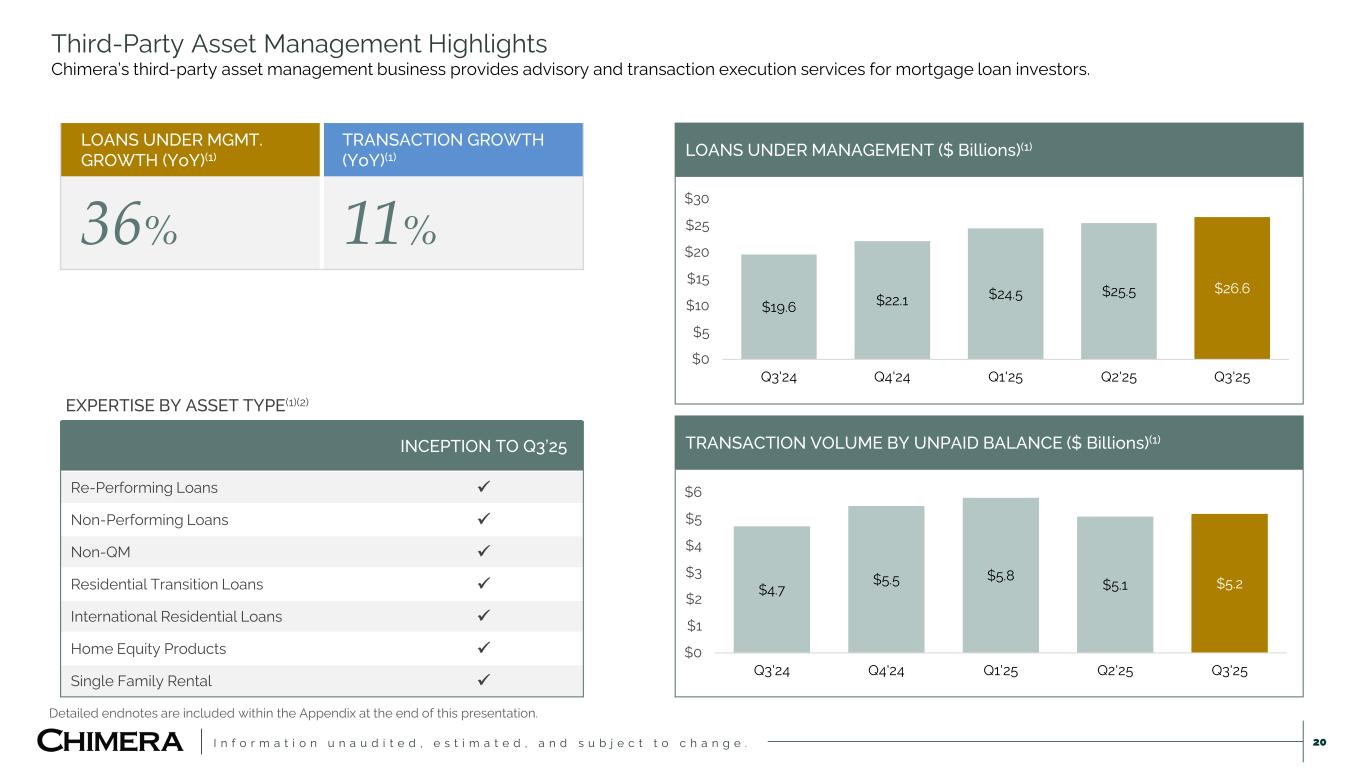
I n f o r m a t i o n u n a u d i t e d , e s t i m a t e d , a n d s u b j e c t t o c h a n g e . Third-Party Asset Management Highlights Chimera’s third-party asset management business provides advisory and transaction execution services for mortgage loan investors. 20 LOANS UNDER MGMT. GROWTH (YoY)(1) TRANSACTION GROWTH (YoY)(1) 36% 11% LOANS UNDER MANAGEMENT ($ Billions)(1) TRANSACTION VOLUME BY UNPAID BALANCE ($ Billions)(1) EXPERTISE BY ASSET TYPE(1)(2) INCEPTION TO Q3’25 Re-Performing Loans Non-Performing Loans Non-QM Residential Transition Loans International Residential Loans Home Equity Products Single Family Rental $19.6 $22.1 $24.5 $25.5 $26.6 $0 $5 $10 $15 $20 $25 $30 Q3'24 Q4'24 Q1'25 Q2'25 Q3'25 $4.7 $5.5 $5.8 $5.1 $5.2 $0 $1 $2 $3 $4 $5 $6 Q3'24 Q4'24 Q1'25 Q2'25 Q3'25 Detailed endnotes are included within the Appendix at the end of this presentation.

Appendix
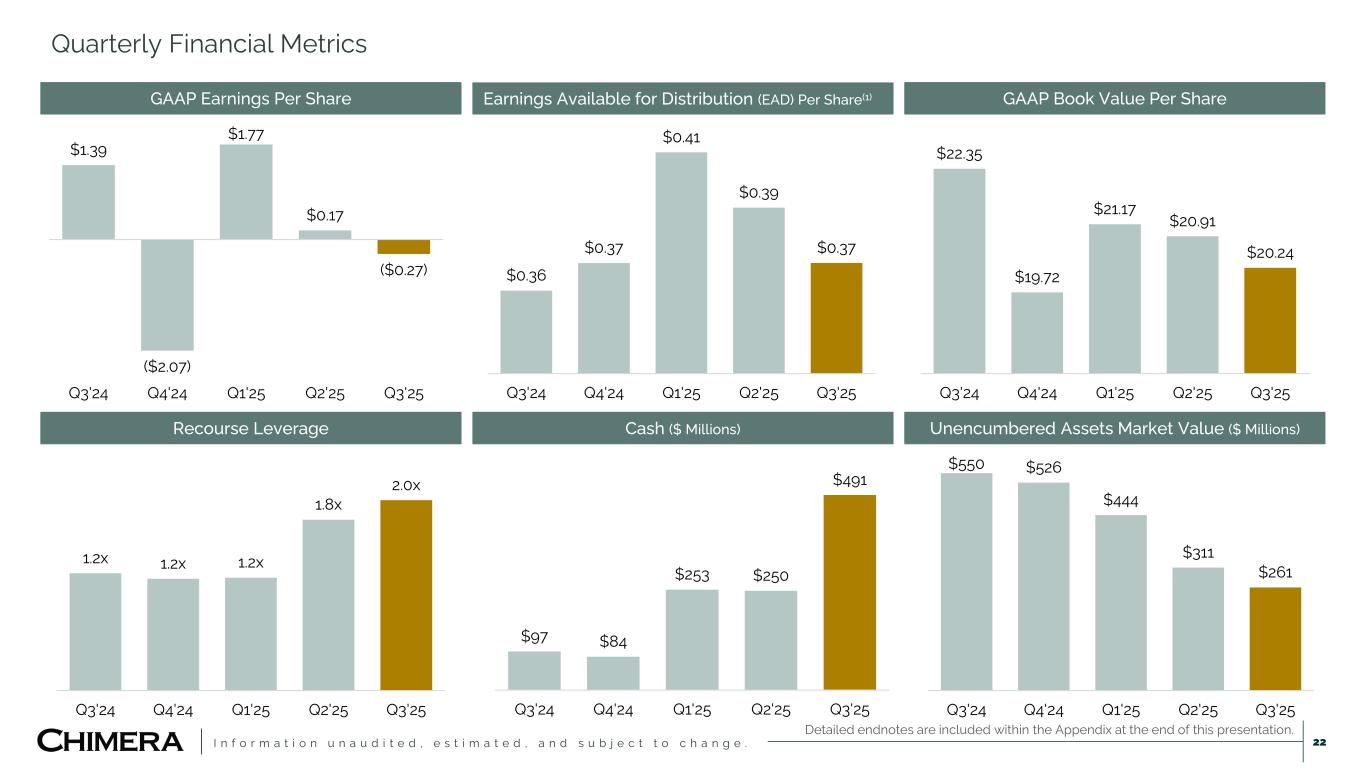
I n f o r m a t i o n u n a u d i t e d , e s t i m a t e d , a n d s u b j e c t t o c h a n g e . Quarterly Financial Metrics 22 $1.39 ($2.07) $1.77 $0.17 ($0.27) Q3'24 Q4'24 Q1'25 Q2'25 Q3'25 $0.36 $0.37 $0.41 $0.39 $0.37 Q3'24 Q4'24 Q1'25 Q2'25 Q3'25 $22.35 $19.72 $21.17 $20.91 $20.24 Q3'24 Q4'24 Q1'25 Q2'25 Q3'25 1.2x 1.2x 1.2x 1.8x 2.0x Q3'24 Q4'24 Q1'25 Q2'25 Q3'25 $97 $84 $253 $250 $491 Q3'24 Q4'24 Q1'25 Q2'25 Q3'25 $550 $526 $444 $311 $261 Q3'24 Q4'24 Q1'25 Q2'25 Q3'25 GAAP Earnings Per Share Earnings Available for Distribution (EAD) Per Share(1) GAAP Book Value Per Share Recourse Leverage Cash ($ Millions) Unencumbered Assets Market Value ($ Millions) Detailed endnotes are included within the Appendix at the end of this presentation.
I n f o r m a t i o n u n a u d i t e d , e s t i m a t e d , a n d s u b j e c t t o c h a n g e . Earnings available for distribution is a non-GAAP measure and is defined as GAAP net income excluding (i) unrealized gains or losses on financial instruments carried at fair value with changes in fair value recorded in earnings, (ii) realized gains or losses on the sales of investments, (iii) gains or losses on the extinguishment of debt, (iv) changes in the provision for credit losses, (v) unrealized gains or losses on derivatives, (vi) realized gains or losses on derivatives, (vii) transaction expenses, (viii) stock compensation expenses for retirement eligible awards, (ix) amortization of intangibles and depreciation expenses, (x) non-cash imputed compensation expense related to business acquisitions, and (xi) other gains and losses on equity investments. Non-cash imputed compensation expense reflects the portion of the consideration paid in the Palisades Acquisition that pursuant to the seller’s contractual arrangements is distributable to the seller’s legacy employees (who are now our employees) and that for GAAP purposes is recorded as non-cash imputed compensation expense with an offsetting entry recorded as non-cash contribution from a related party to our shareholder’s equity. The excluded amounts do not include any normal, recurring compensation paid to our employees. Transaction expenses are primarily comprised of costs only incurred at the time of execution of our securitizations, certain structured secured financing agreements, and business combination transactions and include costs such as underwriting fees, legal fees, diligence fees, accounting fees, bank fees and other similar transaction-related expenses. These costs are all incurred prior to or at the execution of the transaction and do not recur. Recurring expenses, such as servicing fees, custodial fees, trustee fees and other similar ongoing fees are not excluded from earnings available for distribution. We believe that excluding these costs is useful to investors as it is generally consistent with our peer group’s treatment of these costs in their non-GAAP measures presentation, mitigates period to period comparability issues tied to the timing of securitization and structured finance transactions, and is consistent with the accounting for the deferral of debt issue costs prior to the fair value election option made by us. In addition, we believe it is important for investors to review this metric which is consistent with how management internally evaluates the performance of the Company. Stock compensation expense charges incurred on awards to retirement eligible employees is reflected as an expense over a vesting period (generally 36 months) rather than reported as an immediate expense. We view Earnings available for distribution as one measure of our investment portfolio's ability to generate income for distribution to common stockholders. Earnings available for distribution is one of the metrics, but not the exclusive metric, that our Board of Directors uses to determine the amount, if any, of dividends on our common stock. Other metrics that our Board of Directors may consider when determining the amount, if any, of dividends on our common stock include, among others, REIT taxable income, dividend yield, book value, cash generated from the portfolio, reinvestment opportunities and other cash needs. To maintain our qualification as a REIT, U.S. federal income tax law generally requires that we distribute at least 90% of our REIT taxable income (subject to certain adjustments) annually. Earnings available for distribution, however, is different than REIT taxable income. For example, differences between Earnings available for distribution and REIT taxable income generally may result from whether the REIT uses mark-to- market accounting for GAAP purposes, accretion of market discount or OID and amortization of premium, and differences in the treatment of securitizations for GAAP and tax purposes, among other items. Further, REIT taxable income generally does not include earnings of our domestic TRSs unless such income is distributed from current or accumulated earnings and profits. The determination of whether we have met the requirement to distribute at least 90% of our annual REIT taxable income is not based on Earnings available for distribution and Earnings available for distribution should not be considered as an indication of our REIT taxable income, a guaranty of our ability to pay dividends, or as a proxy for the amount of dividends we may pay. We believe Earnings available for distribution helps us and investors evaluate our financial performance period over period without the impact of certain non-recurring transactions. Therefore, Earnings available for distribution should not be viewed in isolation and is not a substitute for or superior to net income or net income per basic share computed in accordance with GAAP. In addition, our methodology for calculating Earnings available for distribution may differ from the methodologies employed by other REITs to calculate the same or similar supplemental performance measures, and accordingly, our Earnings available for distribution may not be comparable to the Earnings available for distribution reported by other REITs. Earnings Available for Distribution 23
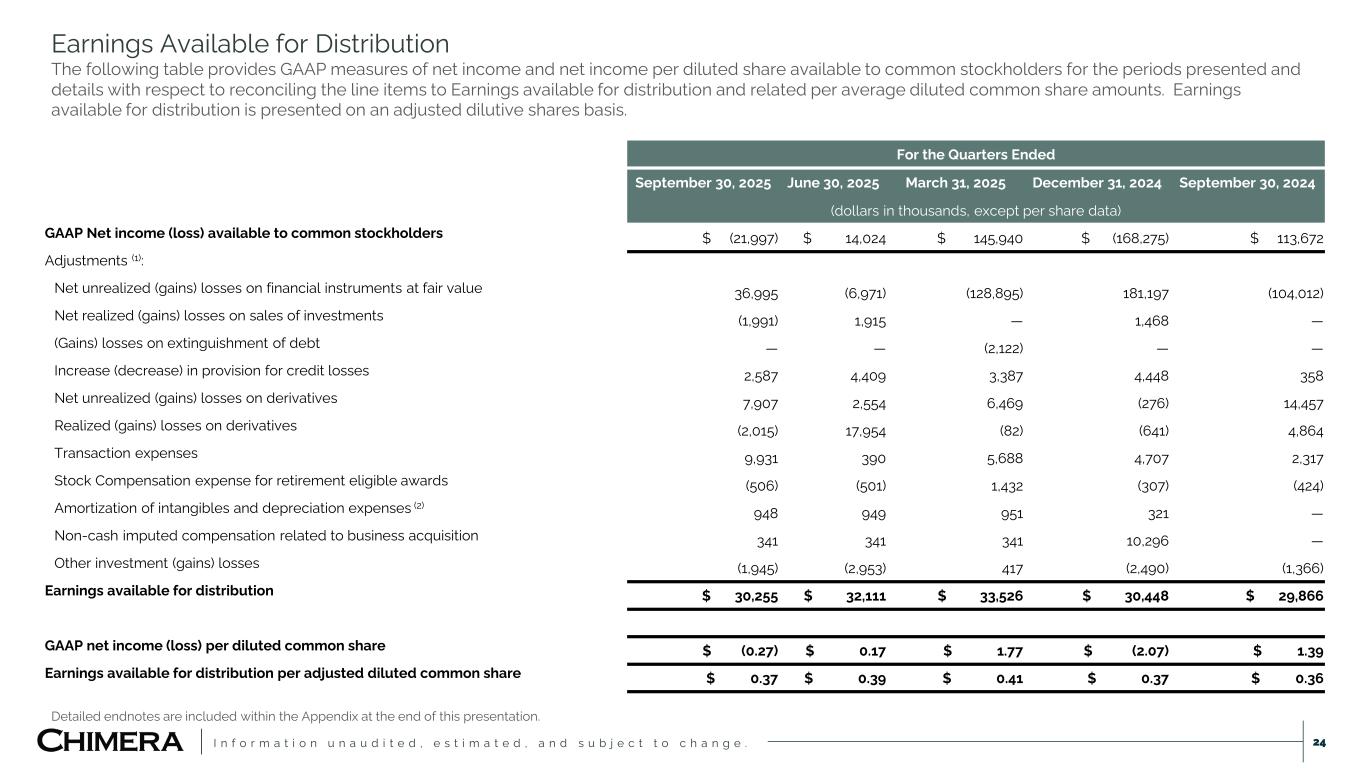
I n f o r m a t i o n u n a u d i t e d , e s t i m a t e d , a n d s u b j e c t t o c h a n g e . Earnings Available for Distribution The following table provides GAAP measures of net income and net income per diluted share available to common stockholders for the periods presented and details with respect to reconciling the line items to Earnings available for distribution and related per average diluted common share amounts. Earnings available for distribution is presented on an adjusted dilutive shares basis. 24 Detailed endnotes are included within the Appendix at the end of this presentation. For the Quarters Ended September 30, 2025 June 30, 2025 March 31, 2025 December 31, 2024 September 30, 2024 (dollars in thousands, except per share data) GAAP Net income (loss) available to common stockholders $ (21,997) $ 14,024 $ 145,940 $ (168,275) $ 113,672 Adjustments (1): Net unrealized (gains) losses on financial instruments at fair value 36,995 (6,971) (128,895) 181,197 (104,012) Net realized (gains) losses on sales of investments (1,991) 1,915 — 1,468 — (Gains) losses on extinguishment of debt — — (2,122) — — Increase (decrease) in provision for credit losses 2,587 4,409 3,387 4,448 358 Net unrealized (gains) losses on derivatives 7,907 2,554 6,469 (276) 14,457 Realized (gains) losses on derivatives (2,015) 17,954 (82) (641) 4,864 Transaction expenses 9,931 390 5,688 4,707 2,317 Stock Compensation expense for retirement eligible awards (506) (501) 1,432 (307) (424) Amortization of intangibles and depreciation expenses (2) 948 949 951 321 — Non-cash imputed compensation related to business acquisition 341 341 341 10,296 — Other investment (gains) losses (1,945) (2,953) 417 (2,490) (1,366) Earnings available for distribution $ 30,255 $ 32,111 $ 33,526 $ 30,448 $ 29,866 GAAP net income (loss) per diluted common share $ (0.27) $ 0.17 $ 1.77 $ (2.07) $ 1.39 Earnings available for distribution per adjusted diluted common share $ 0.37 $ 0.39 $ 0.41 $ 0.37 $ 0.36
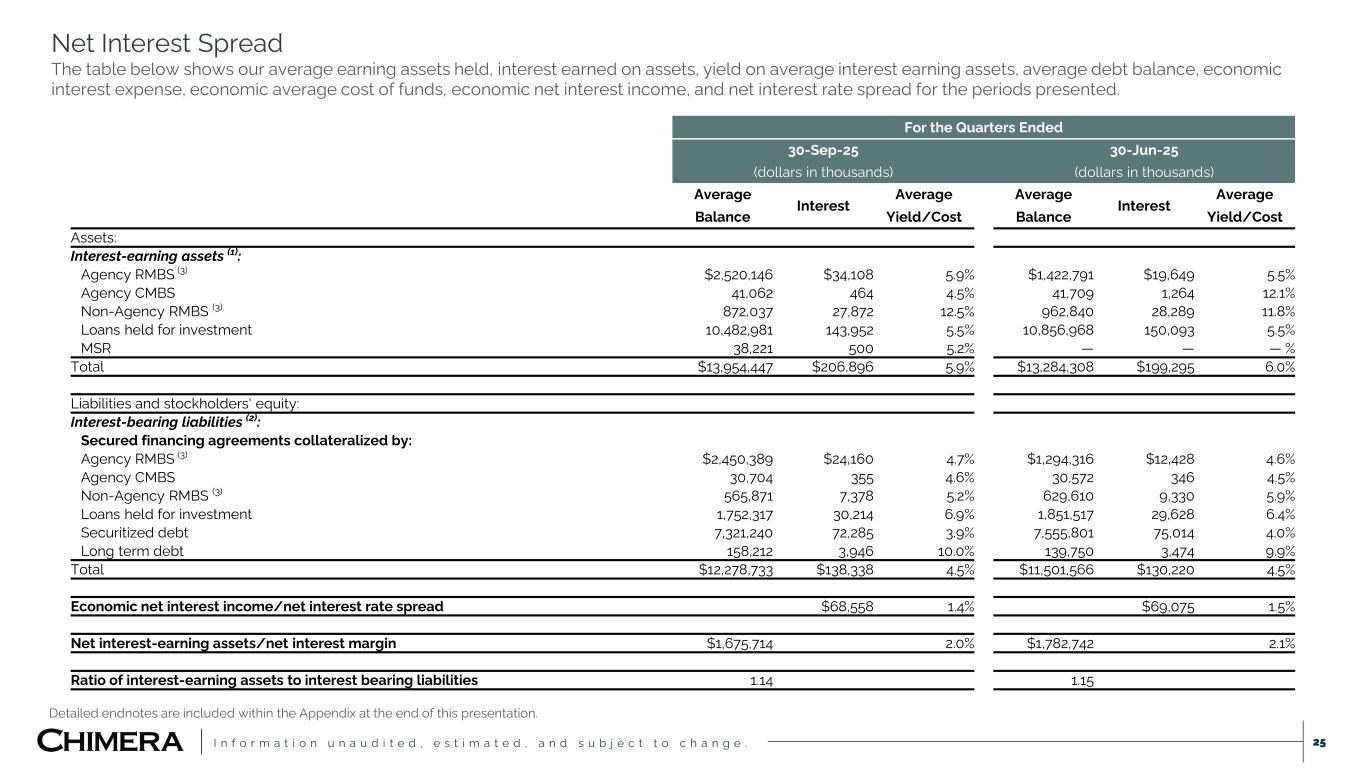
I n f o r m a t i o n u n a u d i t e d , e s t i m a t e d , a n d s u b j e c t t o c h a n g e . 25 Net Interest Spread The table below shows our average earning assets held, interest earned on assets, yield on average interest earning assets, average debt balance, economic interest expense, economic average cost of funds, economic net interest income, and net interest rate spread for the periods presented. Detailed endnotes are included within the Appendix at the end of this presentation. For the Quarters Ended 30-Sep-25 30-Jun-25 (dollars in thousands) (dollars in thousands) Average Interest Average Average Interest Average Balance Yield/Cost Balance Yield/Cost Assets: Interest-earning assets (1): Agency RMBS (3) $2,520,146 $34,108 5.9% $1,422,791 $19,649 5.5% Agency CMBS 41,062 464 4.5% 41,709 1,264 12.1% Non-Agency RMBS (3) 872,037 27,872 12.5% 962,840 28,289 11.8% Loans held for investment 10,482,981 143,952 5.5% 10,856,968 150,093 5.5% MSR 38,221 500 5.2% — — — % Total $13,954,447 $206,896 5.9% $13,284,308 $199,295 6.0% Liabilities and stockholders' equity: Interest-bearing liabilities (2): Secured financing agreements collateralized by: Agency RMBS (3) $2,450,389 $24,160 4.7% $1,294,316 $12,428 4.6% Agency CMBS 30,704 355 4.6% 30,572 346 4.5% Non-Agency RMBS (3) 565,871 7,378 5.2% 629,610 9,330 5.9% Loans held for investment 1,752,317 30,214 6.9% 1,851,517 29,628 6.4% Securitized debt 7,321,240 72,285 3.9% 7,555,801 75,014 4.0% Long term debt 158,212 3,946 10.0% 139,750 3,474 9.9% Total $12,278,733 $138,338 4.5% $11,501,566 $130,220 4.5% Economic net interest income/net interest rate spread $68,558 1.4% $69,075 1.5% Net interest-earning assets/net interest margin $1,675,714 2.0% $1,782,742 2.1% Ratio of interest-earning assets to interest bearing liabilities 1.14 1.15
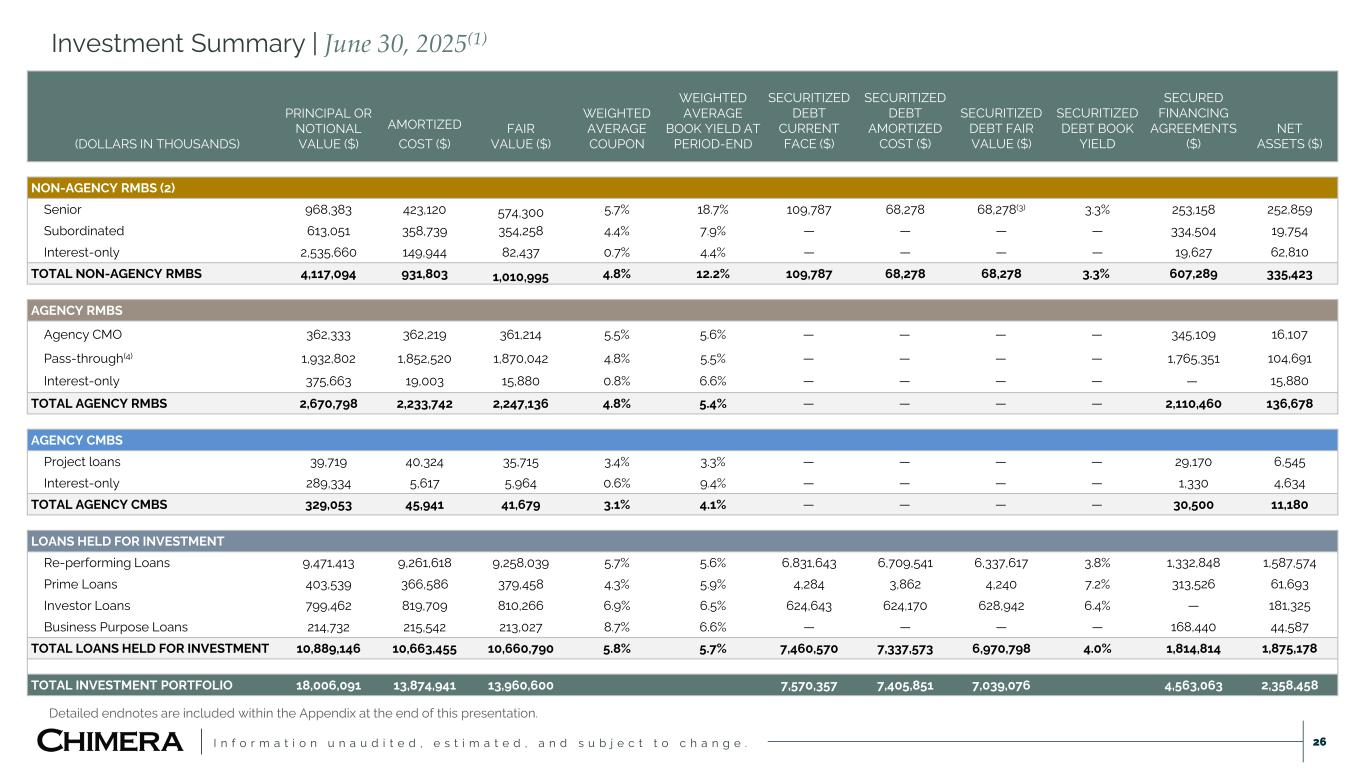
I n f o r m a t i o n u n a u d i t e d , e s t i m a t e d , a n d s u b j e c t t o c h a n g e . Investment Summary | June 30, 2025(1) 26 Detailed endnotes are included within the Appendix at the end of this presentation. (DOLLARS IN THOUSANDS) PRINCIPAL OR NOTIONAL VALUE ($) AMORTIZED COST ($) FAIR VALUE ($) WEIGHTED AVERAGE COUPON WEIGHTED AVERAGE BOOK YIELD AT PERIOD-END SECURITIZED DEBT CURRENT FACE ($) SECURITIZED DEBT AMORTIZED COST ($) SECURITIZED DEBT FAIR VALUE ($) SECURITIZED DEBT BOOK YIELD SECURED FINANCING AGREEMENTS ($) NET ASSETS ($) NON-AGENCY RMBS (2) Senior 968,383 423,120 574,300 5.7% 18.7% 109,787 68,278 68,278(3) 3.3% 253,158 252,859 Subordinated 613,051 358,739 354,258 4.4% 7.9% — — — — 334,504 19,754 Interest-only 2,535,660 149,944 82,437 0.7% 4.4% — — — — 19,627 62,810 TOTAL NON-AGENCY RMBS 4,117,094 931,803 1,010,995 4.8% 12.2% 109,787 68,278 68,278 3.3% 607,289 335,423 AGENCY RMBS Agency CMO 362,333 362,219 361,214 5.5% 5.6% — — — — 345,109 16,107 Pass-through(4) 1,932,802 1,852,520 1,870,042 4.8% 5.5% — — — — 1,765,351 104,691 Interest-only 375,663 19,003 15,880 0.8% 6.6% — — — — — 15,880 TOTAL AGENCY RMBS 2,670,798 2,233,742 2,247,136 4.8% 5.4% — — — — 2,110,460 136,678 AGENCY CMBS Project loans 39,719 40,324 35,715 3.4% 3.3% — — — — 29,170 6,545 Interest-only 289,334 5,617 5,964 0.6% 9.4% — — — — 1,330 4,634 TOTAL AGENCY CMBS 329,053 45,941 41,679 3.1% 4.1% — — — — 30,500 11,180 LOANS HELD FOR INVESTMENT Re-performing Loans 9,471,413 9,261,618 9,258,039 5.7% 5.6% 6,831,643 6,709,541 6,337,617 3.8% 1,332,848 1,587,574 Prime Loans 403,539 366,586 379,458 4.3% 5.9% 4,284 3,862 4,240 7.2% 313,526 61,693 Investor Loans 799,462 819,709 810,266 6.9% 6.5% 624,643 624,170 628,942 6.4% — 181,325 Business Purpose Loans 214,732 215,542 213,027 8.7% 6.6% — — — — 168,440 44,587 TOTAL LOANS HELD FOR INVESTMENT 10,889,146 10,663,455 10,660,790 5.8% 5.7% 7,460,570 7,337,573 6,970,798 4.0% 1,814,814 1,875,178 TOTAL INVESTMENT PORTFOLIO 18,006,091 13,874,941 13,960,600 7,570,357 7,405,851 7,039,076 4,563,063 2,358,458
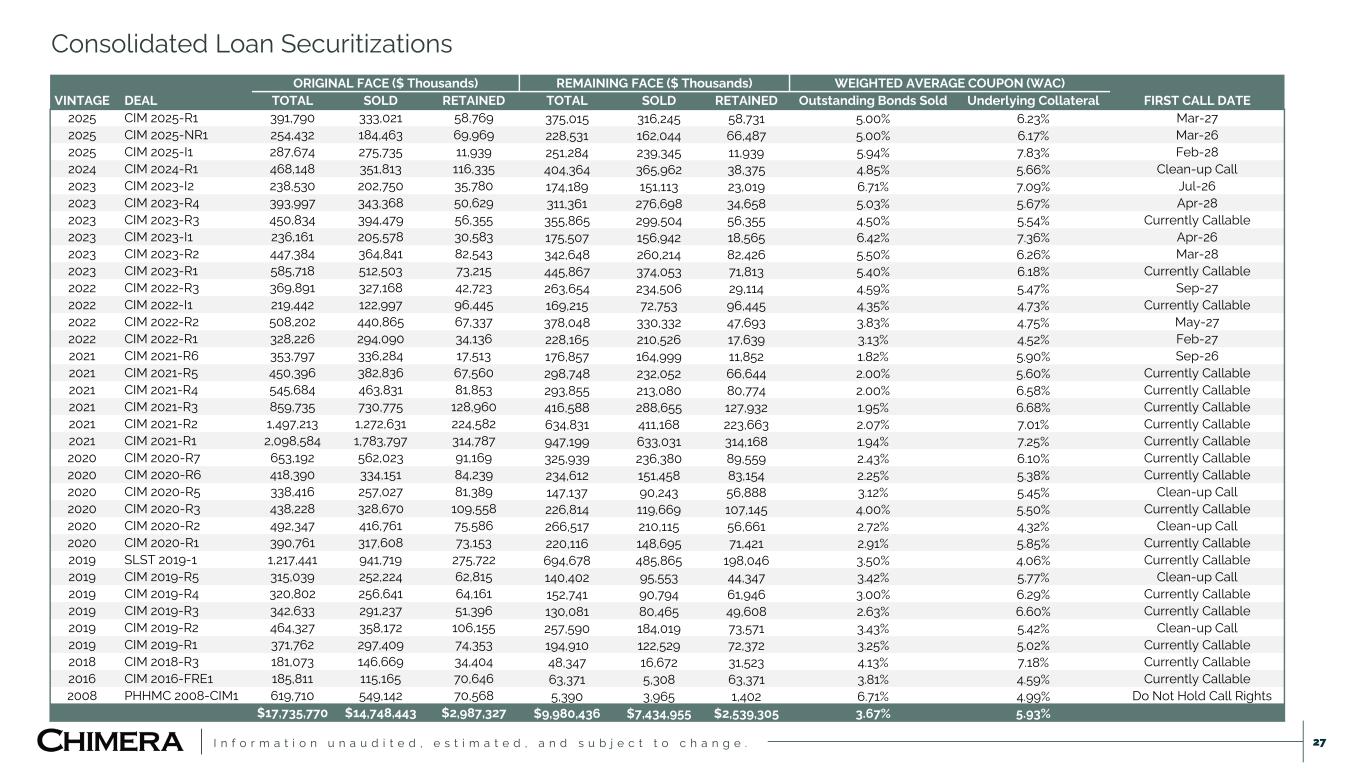
I n f o r m a t i o n u n a u d i t e d , e s t i m a t e d , a n d s u b j e c t t o c h a n g e . Consolidated Loan Securitizations 27 ORIGINAL FACE ($ Thousands) REMAINING FACE ($ Thousands) WEIGHTED AVERAGE COUPON (WAC) VINTAGE DEAL TOTAL SOLD RETAINED TOTAL SOLD RETAINED Outstanding Bonds Sold Underlying Collateral FIRST CALL DATE 2025 CIM 2025-R1 391,790 333,021 58,769 375,015 316,245 58,731 5.00% 6.23% Mar-27 2025 CIM 2025-NR1 254,432 184,463 69,969 228,531 162,044 66,487 5.00% 6.17% Mar-26 2025 CIM 2025-I1 287,674 275,735 11,939 251,284 239,345 11,939 5.94% 7.83% Feb-28 2024 CIM 2024-R1 468,148 351,813 116,335 404,364 365,962 38,375 4.85% 5.66% Clean-up Call 2023 CIM 2023-I2 238,530 202,750 35,780 174,189 151,113 23,019 6.71% 7.09% Jul-26 2023 CIM 2023-R4 393,997 343,368 50,629 311,361 276,698 34,658 5.03% 5.67% Apr-28 2023 CIM 2023-R3 450,834 394,479 56,355 355,865 299,504 56,355 4.50% 5.54% Currently Callable 2023 CIM 2023-I1 236,161 205,578 30,583 175,507 156,942 18,565 6.42% 7.36% Apr-26 2023 CIM 2023-R2 447,384 364,841 82,543 342,648 260,214 82,426 5.50% 6.26% Mar-28 2023 CIM 2023-R1 585,718 512,503 73,215 445,867 374,053 71,813 5.40% 6.18% Currently Callable 2022 CIM 2022-R3 369,891 327,168 42,723 263,654 234,506 29,114 4.59% 5.47% Sep-27 2022 CIM 2022-I1 219,442 122,997 96,445 169,215 72,753 96,445 4.35% 4.73% Currently Callable 2022 CIM 2022-R2 508,202 440,865 67,337 378,048 330,332 47,693 3.83% 4.75% May-27 2022 CIM 2022-R1 328,226 294,090 34,136 228,165 210,526 17,639 3.13% 4.52% Feb-27 2021 CIM 2021-R6 353,797 336,284 17,513 176,857 164,999 11,852 1.82% 5.90% Sep-26 2021 CIM 2021-R5 450,396 382,836 67,560 298,748 232,052 66,644 2.00% 5.60% Currently Callable 2021 CIM 2021-R4 545,684 463,831 81,853 293,855 213,080 80,774 2.00% 6.58% Currently Callable 2021 CIM 2021-R3 859,735 730,775 128,960 416,588 288,655 127,932 1.95% 6.68% Currently Callable 2021 CIM 2021-R2 1,497,213 1,272,631 224,582 634,831 411,168 223,663 2.07% 7.01% Currently Callable 2021 CIM 2021-R1 2,098,584 1,783,797 314,787 947,199 633,031 314,168 1.94% 7.25% Currently Callable 2020 CIM 2020-R7 653,192 562,023 91,169 325,939 236,380 89,559 2.43% 6.10% Currently Callable 2020 CIM 2020-R6 418,390 334,151 84,239 234,612 151,458 83,154 2.25% 5.38% Currently Callable 2020 CIM 2020-R5 338,416 257,027 81,389 147,137 90,243 56,888 3.12% 5.45% Clean-up Call 2020 CIM 2020-R3 438,228 328,670 109,558 226,814 119,669 107,145 4.00% 5.50% Currently Callable 2020 CIM 2020-R2 492,347 416,761 75,586 266,517 210,115 56,661 2.72% 4.32% Clean-up Call 2020 CIM 2020-R1 390,761 317,608 73,153 220,116 148,695 71,421 2.91% 5.85% Currently Callable 2019 SLST 2019-1 1,217,441 941,719 275,722 694,678 485,865 198,046 3.50% 4.06% Currently Callable 2019 CIM 2019-R5 315,039 252,224 62,815 140,402 95,553 44,347 3.42% 5.77% Clean-up Call 2019 CIM 2019-R4 320,802 256,641 64,161 152,741 90,794 61,946 3.00% 6.29% Currently Callable 2019 CIM 2019-R3 342,633 291,237 51,396 130,081 80,465 49,608 2.63% 6.60% Currently Callable 2019 CIM 2019-R2 464,327 358,172 106,155 257,590 184,019 73,571 3.43% 5.42% Clean-up Call 2019 CIM 2019-R1 371,762 297,409 74,353 194,910 122,529 72,372 3.25% 5.02% Currently Callable 2018 CIM 2018-R3 181,073 146,669 34,404 48,347 16,672 31,523 4.13% 7.18% Currently Callable 2016 CIM 2016-FRE1 185,811 115,165 70,646 63,371 5,308 63,371 3.81% 4.59% Currently Callable 2008 PHHMC 2008-CIM1 619,710 549,142 70,568 5,390 3,965 1,402 6.71% 4.99% Do Not Hold Call Rights $17,735,770 $14,748,443 $2,987,327 $9,980,436 $7,434,955 $2,539,305 3.67% 5.93%
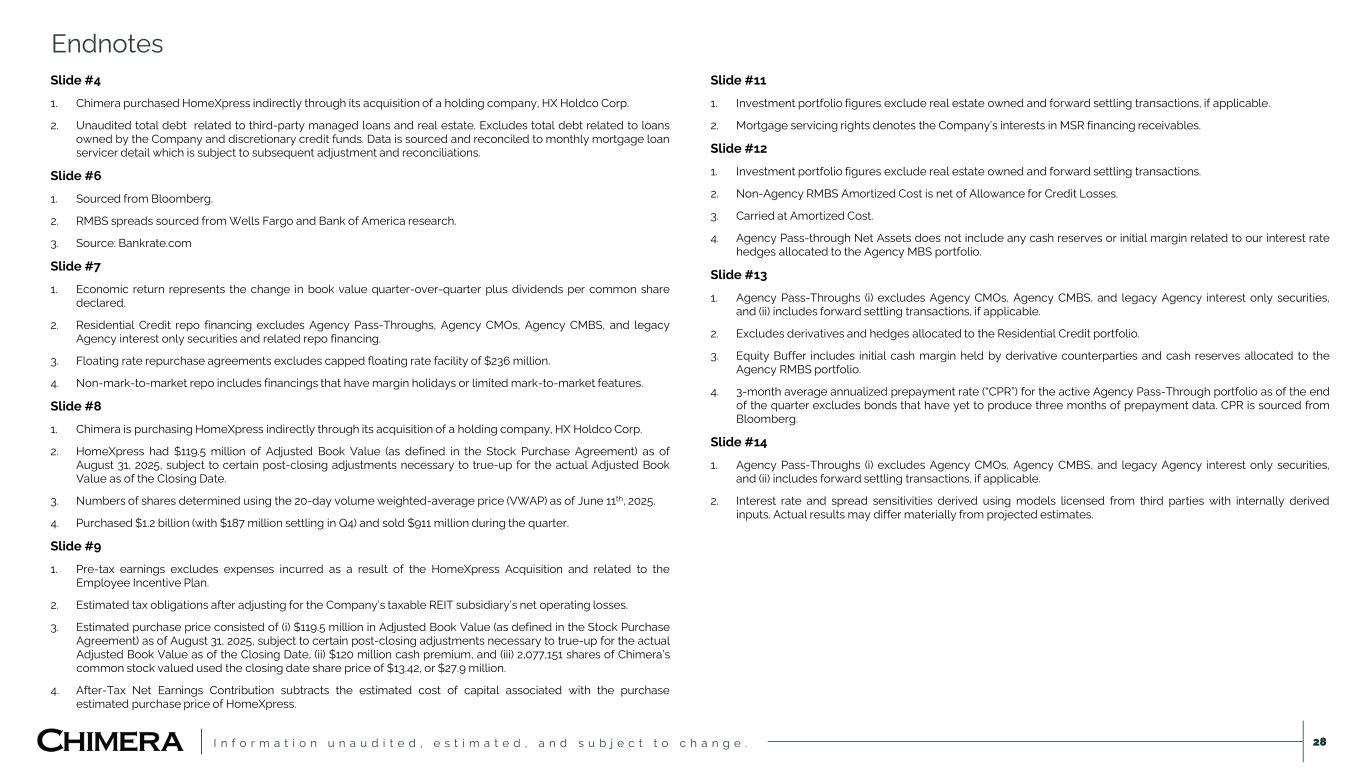
I n f o r m a t i o n u n a u d i t e d , e s t i m a t e d , a n d s u b j e c t t o c h a n g e . Slide #4 1. Chimera purchased HomeXpress indirectly through its acquisition of a holding company, HX Holdco Corp. 2. Unaudited total debt related to third-party managed loans and real estate. Excludes total debt related to loans owned by the Company and discretionary credit funds. Data is sourced and reconciled to monthly mortgage loan servicer detail which is subject to subsequent adjustment and reconciliations. Slide #6 1. Sourced from Bloomberg. 2. RMBS spreads sourced from Wells Fargo and Bank of America research. 3. Source: Bankrate.com Slide #7 1. Economic return represents the change in book value quarter-over-quarter plus dividends per common share declared. 2. Residential Credit repo financing excludes Agency Pass-Throughs, Agency CMOs, Agency CMBS, and legacy Agency interest only securities and related repo financing. 3. Floating rate repurchase agreements excludes capped floating rate facility of $236 million. 4. Non-mark-to-market repo includes financings that have margin holidays or limited mark-to-market features. Slide #8 1. Chimera is purchasing HomeXpress indirectly through its acquisition of a holding company, HX Holdco Corp. 2. HomeXpress had $119.5 million of Adjusted Book Value (as defined in the Stock Purchase Agreement) as of August 31, 2025, subject to certain post-closing adjustments necessary to true-up for the actual Adjusted Book Value as of the Closing Date. 3. Numbers of shares determined using the 20-day volume weighted-average price (VWAP) as of June 11th, 2025. 4. Purchased $1.2 billion (with $187 million settling in Q4) and sold $911 million during the quarter. Slide #9 1. Pre-tax earnings excludes expenses incurred as a result of the HomeXpress Acquisition and related to the Employee Incentive Plan. 2. Estimated tax obligations after adjusting for the Company’s taxable REIT subsidiary’s net operating losses. 3. Estimated purchase price consisted of (i) $119.5 million in Adjusted Book Value (as defined in the Stock Purchase Agreement) as of August 31, 2025, subject to certain post-closing adjustments necessary to true-up for the actual Adjusted Book Value as of the Closing Date, (ii) $120 million cash premium, and (iii) 2,077,151 shares of Chimera’s common stock valued used the closing date share price of $13.42, or $27.9 million. 4. After-Tax Net Earnings Contribution subtracts the estimated cost of capital associated with the purchase estimated purchase price of HomeXpress. Slide #11 1. Investment portfolio figures exclude real estate owned and forward settling transactions, if applicable. 2. Mortgage servicing rights denotes the Company’s interests in MSR financing receivables. Slide #12 1. Investment portfolio figures exclude real estate owned and forward settling transactions. 2. Non-Agency RMBS Amortized Cost is net of Allowance for Credit Losses. 3. Carried at Amortized Cost. 4. Agency Pass-through Net Assets does not include any cash reserves or initial margin related to our interest rate hedges allocated to the Agency MBS portfolio. Slide #13 1. Agency Pass-Throughs (i) excludes Agency CMOs, Agency CMBS, and legacy Agency interest only securities, and (ii) includes forward settling transactions, if applicable. 2. Excludes derivatives and hedges allocated to the Residential Credit portfolio. 3. Equity Buffer includes initial cash margin held by derivative counterparties and cash reserves allocated to the Agency RMBS portfolio. 4. 3-month average annualized prepayment rate (“CPR”) for the active Agency Pass-Through portfolio as of the end of the quarter excludes bonds that have yet to produce three months of prepayment data. CPR is sourced from Bloomberg. Slide #14 1. Agency Pass-Throughs (i) excludes Agency CMOs, Agency CMBS, and legacy Agency interest only securities, and (ii) includes forward settling transactions, if applicable. 2. Interest rate and spread sensitivities derived using models licensed from third parties with internally derived inputs. Actual results may differ materially from projected estimates. Endnotes 28
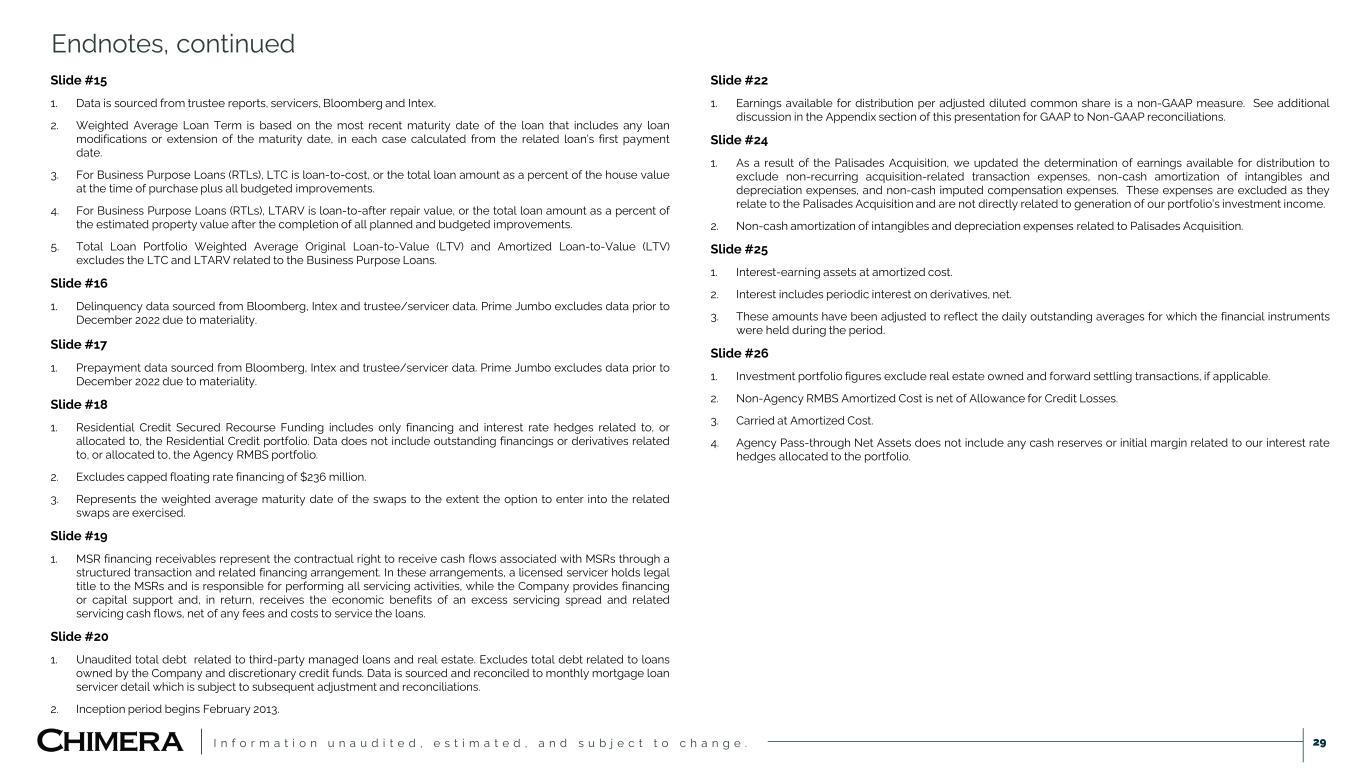
I n f o r m a t i o n u n a u d i t e d , e s t i m a t e d , a n d s u b j e c t t o c h a n g e . Slide #15 1. Data is sourced from trustee reports, servicers, Bloomberg and Intex. 2. Weighted Average Loan Term is based on the most recent maturity date of the loan that includes any loan modifications or extension of the maturity date, in each case calculated from the related loan’s first payment date. 3. For Business Purpose Loans (RTLs), LTC is loan-to-cost, or the total loan amount as a percent of the house value at the time of purchase plus all budgeted improvements. 4. For Business Purpose Loans (RTLs), LTARV is loan-to-after repair value, or the total loan amount as a percent of the estimated property value after the completion of all planned and budgeted improvements. 5. Total Loan Portfolio Weighted Average Original Loan-to-Value (LTV) and Amortized Loan-to-Value (LTV) excludes the LTC and LTARV related to the Business Purpose Loans. Slide #16 1. Delinquency data sourced from Bloomberg, Intex and trustee/servicer data. Prime Jumbo excludes data prior to December 2022 due to materiality. Slide #17 1. Prepayment data sourced from Bloomberg, Intex and trustee/servicer data. Prime Jumbo excludes data prior to December 2022 due to materiality. Slide #18 1. Residential Credit Secured Recourse Funding includes only financing and interest rate hedges related to, or allocated to, the Residential Credit portfolio. Data does not include outstanding financings or derivatives related to, or allocated to, the Agency RMBS portfolio. 2. Excludes capped floating rate financing of $236 million. 3. Represents the weighted average maturity date of the swaps to the extent the option to enter into the related swaps are exercised. Slide #19 1. MSR financing receivables represent the contractual right to receive cash flows associated with MSRs through a structured transaction and related financing arrangement. In these arrangements, a licensed servicer holds legal title to the MSRs and is responsible for performing all servicing activities, while the Company provides financing or capital support and, in return, receives the economic benefits of an excess servicing spread and related servicing cash flows, net of any fees and costs to service the loans. Slide #20 1. Unaudited total debt related to third-party managed loans and real estate. Excludes total debt related to loans owned by the Company and discretionary credit funds. Data is sourced and reconciled to monthly mortgage loan servicer detail which is subject to subsequent adjustment and reconciliations. 2. Inception period begins February 2013. Slide #22 1. Earnings available for distribution per adjusted diluted common share is a non-GAAP measure. See additional discussion in the Appendix section of this presentation for GAAP to Non-GAAP reconciliations. Slide #24 1. As a result of the Palisades Acquisition, we updated the determination of earnings available for distribution to exclude non-recurring acquisition-related transaction expenses, non-cash amortization of intangibles and depreciation expenses, and non-cash imputed compensation expenses. These expenses are excluded as they relate to the Palisades Acquisition and are not directly related to generation of our portfolio’s investment income. 2. Non-cash amortization of intangibles and depreciation expenses related to Palisades Acquisition. Slide #25 1. Interest-earning assets at amortized cost. 2. Interest includes periodic interest on derivatives, net. 3. These amounts have been adjusted to reflect the daily outstanding averages for which the financial instruments were held during the period. Slide #26 1. Investment portfolio figures exclude real estate owned and forward settling transactions, if applicable. 2. Non-Agency RMBS Amortized Cost is net of Allowance for Credit Losses. 3. Carried at Amortized Cost. 4. Agency Pass-through Net Assets does not include any cash reserves or initial margin related to our interest rate hedges allocated to the portfolio. Endnotes, continued 29

I n f o r m a t i o n u n a u d i t e d , e s t i m a t e d , a n d s u b j e c t t o c h a n g e .