10-K: Annual report [Section 13 and 15(d), not S-K Item 405]
Published on February 18, 2026
UNITED STATES
SECURITIES AND EXCHANGE COMMISSION
WASHINGTON, D.C. 20549
FORM 10-K
FOR THE FISCAL YEAR ENDED: December 31 , 2025
OR
FOR THE TRANSITION PERIOD FROM TO
COMMISSION FILE NUMBER: 1-33796
(Exact Name of Registrant as Specified in its Charter)
| (State or other jurisdiction of incorporation of organization) | (I.R.S. Employer Identification Number) | |||||||
| (Address of Principal Executive Offices) | (Zip Code) | |||||||
(888 ) 895-6557
(Registrant’s telephone number, including area code)
Securities registered pursuant to Section 12(b) of the Act:
| Title of Each Class | Trading Symbol(s) | Name of Each Exchange on Which Registered | ||||||
Securities registered pursuant to Section 12(g) of the Act: None
Indicate by check mark if the Registrant is a well-known seasoned issuer, as defined in Rule 405 of the Securities Act.
Indicate by check mark if the Registrant is not required to file reports pursuant to Section 13 or Section 15(d) of the Act.
Yes o No þ
Indicate by check mark whether the Registrant (1) has filed all reports required to be filed by Section 13 or 15(d) of the Securities Exchange Act of 1934 during the preceding 12 months (or for such shorter period that the Registrant was required to file such reports), and (2) has been subject to such filing requirements for the past 90 days:
Indicate by check mark whether the Registrant has submitted electronically every Interactive Data File required to be submitted pursuant to Rule 405 of Regulation S-T (§ 232.405 of this chapter) during the preceding 12 months (or for such shorter period that the registrant was required to submit and files).
Indicate by check mark whether the Registrant is a large accelerated filer, an accelerated filer, a non-accelerated filer, a smaller reporting company, or an emerging growth company. See definition of “large accelerated filer,” “accelerated filer,” “smaller reporting company” and “emerging growth company” in Rule 12b-2 of the Exchange Act.
Emerging growth company ☐
If an emerging growth company, indicate by check mark if the Registrant has elected not to use the extended transition period for complying with any new or revised financial accounting standards provided pursuant to Section 13(a) of the Exchange Act.
o
Indicate by check mark whether the Registrant has filed a report on and attestation to its management's assessment of the effectiveness of its internal control over financial reporting under Section 404(b) of the Sarbanes-Oxley Act (15 U.S.C. 7262(b)) by the registered public accounting firm that prepared or issued its audit report. þ
If securities are registered pursuant to Section 12(b) of the Act, indicate by check mark whether the financial statements
of the Registrant included in the filing reflect the correction of an error to previously issued financial statements. o
Indicate by check mark whether any of those error corrections are restatements that required a recovery analysis of incentive-
based compensation received by any of the Registrant’s executive officers during the relevant recovery period pursuant
to §240.10D-1(b). o
Indicate by check mark whether the Registrant is a shell company (as defined in Rule 12b-2 of the Exchange Act).
Yes ☐ No þ
At June 30, 2025, the aggregate market value of the voting stock held by non-affiliates of the Registrant was 1,107,087,713
based on the closing sale price on the New York Stock Exchange on that date.
The number of shares of the Registrant’s Common Stock outstanding on January 31, 2026 was 83,402,526 .
DOCUMENTS INCORPORATED BY REFERENCE
Portions of the registrant’s definitive Proxy Statement for the 2026 Annual Meeting of Stockholders, which will be filed with the Securities and Exchange Commission under Regulation 14A within 120 days after the end of registrant’s fiscal year covered by this Annual Report, are incorporated by reference into Part III.
CHIMERA INVESTMENT CORPORATION
FORM 10-K
TABLE OF CONTENTS
ITEM 1. | ||||||||
ITEM 1A. | ||||||||
ITEM 1B. | ||||||||
| ITEM 1C. | ||||||||
| ITEM 2. | ||||||||
ITEM 3. | ||||||||
ITEM 4. | ||||||||
PART II | ||||||||
ITEM 5. | ||||||||
ITEM 6. | ||||||||
ITEM 7. | ||||||||
ITEM 7A. | ||||||||
ITEM 8. | ||||||||
ITEM 9. | ||||||||
ITEM 9A. | ||||||||
ITEM 9B. | ||||||||
ITEM 9C. | ||||||||
PART III | ||||||||
ITEM 10. | ||||||||
ITEM 11. | ||||||||
ITEM 12. | ||||||||
ITEM 13. | ||||||||
ITEM 14. | ||||||||
PART IV | ||||||||
ITEM 15. | ||||||||
| ITEM 16. | ||||||||
1
In this Annual Report on Form 10-K, references to “we,” “us,” “our,” “Chimera” or “the Company” refer to Chimera Investment Corporation and its subsidiaries unless specifically stated otherwise or the context otherwise indicates. The following defines certain of the commonly used terms in this Annual Report on Form 10-K:
•Agency refers to a federally chartered corporation, such as the Federal National Mortgage Association (“Fannie Mae”) or the Federal Home Loan Mortgage Corporation (“Freddie Mac”), or an agency of the U.S. Government, such as the Government National Mortgage Association (“Ginnie Mae”);
•GSE refers to a government-sponsored enterprise, such as Fannie Mae, Freddie Mac and Ginnie Mae;
•FHFA refers to the Federal Housing Financing Agency;
•CFPB refers to the Consumer Financial Protection Bureau;
•VA refers to the U.S. Department of Veterans Affairs;
•HUD refers to the United States Department of Housing and Urban Development;
•FHA refers to the Federal Housing Administration;
•MBS refers to mortgage-backed securities secured by pools of residential or commercial mortgage loans;
•Agency MBS refers to MBS that are issued or guaranteed by an Agency and includes Agency RMBS and Agency CMBS collectively;
•RMBS refers to mortgage-backed securities secured by pools of residential mortgage loans;
•Pass-through refers to Agency-issued pass-through RMBS collateralized primarily by pools of fixed-rate single-family mortgage loans;
•CMBS refers to mortgage-backed securities secured by pools of commercial mortgage loans;
•Agency RMBS and Agency CMBS refer to MBS that are secured by pools of residential and commercial mortgage loans, respectively, and are issued or guaranteed by an Agency;
•Agency CMO refers to collateralized mortgage obligations guaranteed by an Agency and are included in Agency RMBS;
•Non-Agency RMBS refers to residential MBS that are not guaranteed by any agency of the U.S. Government or any Agency;
•Non-MTM refers to non-mark-to-market facilities, which are financial arrangements that do not require the regular revaluation of assets based on current market prices, often used for loans or securities where the value is assessed based on other criteria;
•Limited-MTM refers to limited mark-to-market facilities (meaning, the market value of the collateral must drop below a threshold before a lender can issue a margin call or some other limitation such as magnitude of rate move or other financial variables);
•RTLs refer to residential transition loans;
•HELOCs refer to home equity lines of credit;
•ABS refers to asset-backed securities;
•RPLs refer to re-performing loans;
•IOs refers to interest-only securities;
•MSRs refer to mortgage servicing rights;
•QM refers to qualified mortgages that are designed for borrowers who meet traditional lending criteria and comply with regulatory standards for safety and affordability;
•Non-QM refers to consumer non-qualified mortgages that are designed for borrowers who do not meet traditional qualified mortgage standards;
•FICO refers to Fair Isaac Corporation;
•LTV refers to loan-to-value;
•CDO refers to collateralized debt obligation;
•LHFS refers to loans held-for-sale;
•IRLC refers to interest rate lock commitments; and
•REO refers to real estate owned.
2
SPECIAL NOTE REGARDING FORWARD-LOOKING STATEMENTS
We make forward-looking statements in this report that are subject to risks and uncertainties. These forward-looking statements include information about, among other things, possible or assumed future results of our business, financial condition, liquidity, results of operations, plans and objectives. When we use the words “goal,” “target,” “assume,” ‘‘believe,’’ ‘‘expect,’’ ‘‘anticipate,’’ ‘‘estimate,’’ “project,” “budget,” “forecast,” “predict,” “potential,” ‘‘plan,’’ ‘‘continue,’’ ‘‘intend,’’ ‘‘should,’’ ‘‘may,’’ “could,” ‘‘would,’’ ‘‘will’’ or similar expressions, we intend to identify forward-looking statements. Statements regarding the following subjects, among others, are forward-looking by their nature:
•our ability to obtain funding on favorable terms and access the capital markets;
•our ability to achieve optimal levels of leverage and effectively manage our liquidity;
•changes in inflation, the yield curve, interest rates and mortgage prepayment rates;
•our ability to manage credit risk related to our investments and comply with the Dodd-Frank act and related laws and regulations relating to credit risk retention for securitizations;
•rates of default, delinquencies, forbearance, deferred payments or decreased recovery rates on our investments;
•the concentration of properties securing our securities and residential loans in a small number of geographic areas;
•our ability to execute on our business and investment strategy;
•our ability to determine accurately the fair market value of our assets;
•changes in our industry, the general economy or geopolitical conditions;
•our ability to successfully integrate and realize the anticipated benefits of any acquisitions, including the acquisition of HomeXpress;
•our ability to originate or acquire quality and profitable loans at an appropriate and consistent cost;
•our ability to sell the loans that we originate or acquire;
•our ability to refinance or obtain additional liquidity for borrowing;
•our ability to manage, maintain and expand our relationships with our clients, the independent mortgage brokers and bankers;
•our ability to operate our investment management and advisory services and manage any regulatory rules and conflicts of interest;
•the degree to which our hedging strategies may or may not be effective;
•our ability to effect our strategy to securitize residential mortgage loans;
•our ability to compete with competitors and source target assets at attractive prices;
•the ability of servicers and other third parties to perform their services at a high level and comply with applicable law and expanding regulations;
•our dependence on information technology and its susceptibility to cyber-attacks;
•the development, proliferation and use of artificial intelligence;
•our ability to find and retain qualified executive officers and key personnel;
•our ability to comply with extensive government regulation, including, but not limited to, federal and state consumer lending regulations;
•the impact of and changes in governmental regulations, tax law and rates, accounting guidance, refinancing or borrowing guidelines and similar matters;
•our ability to maintain our exemption from registration under the Investment Company Act of 1940, as amended (the “1940 Act”);
•our ability to maintain our classification as a real estate investment trust (“REIT”) for U.S. federal income tax purposes;
•the volatility of the market price and trading volume of our shares; and
•our ability to make distributions to our stockholders in the future.
Forward-looking statements are based on our beliefs, assumptions and expectations of our future performance, taking into account all information currently available to us. You should not place undue reliance on these forward-looking statements. These beliefs, assumptions and expectations can change as a result of many possible events or factors, not all of which are known to us. If a change occurs, our business, financial condition, liquidity, results of operations and prospects may vary materially from those expressed in our forward-looking statements. Any forward-looking statement speaks only as of the date on which it is made. New risks and uncertainties arise from time to time, and it is impossible for us to predict those events or how they may affect us. Except as required by law, we are not obligated to, and do not intend to, update or revise any forward-looking statements, whether as a result of new information, future events or otherwise.
3
PART I
Item 1. Business
The Company
We are a diversified real estate company that invests in, originates, and manages primarily residential real estate assets. The assets we may invest in and manage for others, through our wholly-owned subsidiary Palisades Advisory Services LLC (“PAS”), include residential mortgage loans, Non-Agency RMBS, Agency RMBS, business purpose loans (including RTLs) and investor loans, MSRs and other real estate-related assets such as Agency CMBS, junior liens and HELOCs, equity appreciation rights, and reverse mortgages. Also, through our wholly-owned subsidiary, HomeXpress Mortgage Corp. (“HomeXpress”), we originate consumer Non-QM and investor business purpose residential mortgage loans as well as QM residential mortgage loans. Chimera Investment Corporation was incorporated in Maryland on June 1, 2007 and started trading on the NYSE in November 2007, and is structured as an internally managed real estate investment trust (REIT) for U.S. federal income tax purposes.
Acquisition of HomeXpress Mortgage Corp.
On October 1, 2025, the Company completed the acquisition of HomeXpress (the “HomeXpress Acquisition”) for total consideration of $272 million, which consisted of (i) cash of $124 million, representing the Adjusted Book Value of HomeXpress as of September 30, 2025, (ii) cash premium of $120 million, and (iii) issuance of 2,077,151 shares of the Company's common stock. As a result of the HomeXpress Acquisition, the Company began originating consumer Non-QM, investor business purpose, and other mortgage loan products through its subsidiary, HomeXpress during the fourth quarter.
In 2025, the Company reevaluated its composition and the number of our reportable segments based on changes in the significance of certain business activities, including the HomeXpress Acquisition. As a result of this reevaluation, the Company reports as two reportable segments: (i) Investment Portfolio, and (ii) Residential Origination. The Investment Portfolio segment consists of the Company’s investments and third-party advisory services activities. The Residential Origination segment consists of the stand-alone mortgage origination business of HomeXpress that originates consumer Non-QM, investor business purpose, and other Non-Agency and Agency mortgage loan products.
Our Business Strategy
Our principal business objectives are to provide attractive risk-adjusted returns and distributable income through investment performance linked to mortgage credit fundamentals and to grow our enterprise value of time. Through our mortgage lending, investment management, and advisory services platforms, we operate as a fully integrated mortgage business that originates, manages, and invests in a diversified range of mortgage assets. We invest, directly or indirectly, generally on a levered basis across a spectrum of mortgage assets, including residential mortgage loans, Non-Agency RMBS, Agency RMBS, Agency CMBS, MSRs, business purpose and investor loans, including RTLs, and other real estate-related assets. Net interest income from our investment portfolio is the interest income we earn on investments less the interest expense we incur on borrowed funds. In addition, we generate income from our third-party investment management and advisory services. Currently, the primary sources of such income are the fees we receive from institutions for our non-discretionary investment management and advisory services less the cost of providing such services. In the future, an additional source of fees and incentive based income may be from our investment management and advisory services provided on a discretionary basis through investment funds that we manage (the “Discretionary Funds”). Through our subsidiary, HomeXpress, we originate consumer Non-QM, investor business purpose, and other Non-Agency and Agency mortgage loan products. HomeXpress primarily generates income from the origination and sale of its mortgage loan products and, to a lesser degree, the interest on its loans held for sale.
We plan to execute our business strategy through a combination of organic and external growth, depending on opportunities and market conditions. In addition to our strategy of building a durable portfolio of residential mortgage assets, we intend to continue to grow our fee income and enterprise value by growing our existing operational platforms as well as looking for opportunities to acquire additional operating platforms, including entities that originate or service mortgage loans, and other businesses, partnerships or investments that could enhance our business activities and returns to our shareholders through diversification of revenue and growth of our enterprise value. Additional loan origination growth for HomeXpress is expected to be realized primarily from further development of its existing wholesale origination network but also from the growth in its recent implementation of a non-delegated correspondent channel for consumer Non-QM and investor business purpose loans and expansion of its FHA, VA and conventional agency-conforming lending. We also plan to source additional assets for investment in the Chimera portfolio to our managed portfolios as well as adding gains on the origination and sale of the loans that HomeXpress originates. We believe that our strategy of generating income from our portfolio along with fees and incentive-based income from our third-party investment management and advisory services and loan origination business, while remaining open to opportunities to enhance these activities, will provide us an opportunity to pay dividends throughout changing market cycles and grow our share price over time through increasing our enterprise value.
4
Our Investment Strategy
We selectively invest in residential mortgage assets with a focus on credit analysis and risk management. Our risk management approach emphasizes asset-level credit performance, prepayment and interest rate sensitivity. We make investment decisions based on various factors, including expected cash yield, relative value, risk-adjusted returns, credit fundamentals, macroeconomic considerations, supply and demand dynamics, credit and market risk concentration limits, liquidity, cost of financing and financing availability. Our investment strategy is intended to take advantage of opportunities in the current interest rate and credit environment. We adjust our strategy in response to changing market conditions by shifting our asset allocations across various asset classes as interest rate and credit cycles change over time. Subject to maintaining our REIT status and exemption from registration under the 1940 Act, we do not have any limitations on the amounts we may invest in any of our targeted asset classes for our own account. Investments made on behalf of the Discretionary Funds are subject to any investment limitations and guidelines set forth in the related constituent documentation, including the offering documents and the limited partnership agreements of the Discretionary Funds.
We use leverage to increase potential returns from our investments. Our income is generated primarily by the difference, or net spread, between the income we earn on our assets and the cost of our borrowings. We expect to finance our investments using a variety of financing sources, including securitizations, secured borrowings through the use of warehouse facilities and repurchase agreements, and the issuance of debt and equity capital. We may seek to manage our debt and interest rate risk by utilizing interest rate hedges, such as interest rate swaps, caps, options and futures to reduce the effect of interest rate fluctuations related to our financing sources.
During 2025, we focused on diversifying the portfolio and repositioning the Company as a diversified, vertically integrated residential real estate platform. To execute on these objectives, we exercised redemption rights with respect to several securitized transactions and raised capital organically through re-securitizations of the underlying mortgage loans and loan sales to third parties. We also raised capital through monetizing certain fully valued assets as well as through the issuance of senior unsecured debt. These activities provided the capital necessary as we expanded our platform and mortgage lending capabilities through the acquisition of HomeXpress, increased our allocation to liquid Agency RMBS, made our first investment in MSRs, and began to reshape our allocation of capital, investment mix, and sources of income and earnings.
In 2026, we intend to continue our investment focus on active portfolio management, capital allocation discipline, and risk management in light of ongoing market uncertainty. This includes seeking to position the portfolio with a focus on liquidity, financing flexibility, and moderate leverage levels to maintain the capacity to provide capital and liquidity opportunistically across market conditions. We also remain attentive to potential business acquisition opportunities that align with our strategy.
We plan to monetize assets that we believe are fully valued or where relative value has diminished, and to redeploy capital toward investments that we believe offer more attractive risk-adjusted returns consistent with our long-term portfolio objectives. Subject to capital availability, we may seek to further diversify the portfolio, including maintaining and, where appropriate, increasing our allocation to liquid Agency MBS, selectively adding to our MSR investments to offset interest rate exposure in other portfolio segments, and pursuing investments that align with our long-term return and risk parameters.
In addition, we also intend to seek to add direct partnerships with lenders as a means to source investments, and we will continue to work closely with our mortgage lending platform, HomeXpress, which serves as an important component of our investment and capital allocation strategy. The platform provides loan production capabilities, market insight, and asset sourcing channels that support loan sale activity, portfolio investment and earnings diversification objectives. We believe this integrated approach enhances our ability to evaluate relative value across origination and secondary markets, manage capital deployment, and respond to changing market conditions.
We expect to continue financing our investments using a variety of sources, and as part of our overall strategy, may continue to finance a portion of our loan portfolio with long-term secured facilities.
When we securitize mortgage loans, we typically retain the most subordinate classes of securities, which means we are the first-loss security holder. Losses on any residential mortgage loan securing our RMBS will be borne first by the owner of the property (i.e., the owner will first lose any equity invested in the property) and, thereafter, by us as the first-loss security holder, and then by holders of more senior securities. In addition, most of these subordinate securities are subject to the Dodd-Frank Act and related laws and regulations relating to credit risk retention for securitizations, (the “Risk Retention Rules”) which significantly limits the liquidity of these securities. See “ Risk Factors - Risks Associated with Our Investments - A significant portion of our investments are in Non-Agency RMBS that are the most subordinate securities in securitizations, making us the first-loss security holder, which means these securities are subject to significant credit risk, are illiquid, and are difficult to value.” discussion in Item 1A “Risk Factors” section for more details. We generally finance these subordinate securities with
5
secured financing agreements. The securities we do not retain are typically sold through securities underwriters. Other than the Risk Retention Rules, there is no limit on the amount we may retain of these below-investment-grade subordinate certificates.
Our Securitization Programs
We currently have the following five securitization programs:
•Our “R” program securitizes seasoned RPLs, whether newly acquired from a third party or upon the exercise of our redemption rights, in a Real Estate Mortgage Investment Conduit (“REMIC”) transaction;
•Our “NR” program securitizes seasoned residential mortgage loans that are not eligible to be securitized in REMIC, transactions;
•Our “I” program securitizes Non-Agency eligible investor mortgage loans;
•Our “J” program securitizes jumbo prime residential mortgage loans; and
•Our “INV” program securitizes Agency-eligible investor mortgage loans.
We did not sponsor any securitizations under our “J” and “INV” programs during the year ended December 31, 2025.
“R” and “NR” Non-Rated Programs. The securities issued in our “R” and “NR” securitizations are generally not rated and are subject to the Risk Retention Rules. In these programs, we typically sell the senior securities to an unrelated third party and retain the subordinate securities, which include the first-loss securities which are subject to the Risk Retention Rules, and the IOs. During 2025, we sponsored one “R” securitization and one “NR” securitization. We are generally required under GAAP to consolidate the assets and liabilities of the “NR” and “R” securitization entities for financial reporting purposes. Each of the consolidated entities is independent of us and of each other, and the assets and liabilities of these entities are not owned by us or legal obligations of ours, respectively, although we are exposed to certain financial risks associated with any role we carry out for these entities (e.g., as sponsor, depositor or asset manager) and, to the extent we hold securities issued by, or other investments in, these entities, we are exposed to the performance of these entities and the assets they hold. PAS, our wholly-owned asset management capability, served as asset manager on each of these two securitizations.
“I” Programs. The securities issued in our “I” securitizations are rated by one or more nationally recognized statistical ratings organizations and are subject to the Risk Retention Rules. In these programs, we typically sell the senior securities to an unrelated third party and retain the subordinate securities, which include the first-loss securities which are subject to the Risk Retention Rules, and the IOs. We are generally required under GAAP to consolidate the assets and liabilities of the “I” securitization entities for financial reporting purposes. During 2025, we sponsored one “I” securitization.
The table below sets forth certain information about our “R”, “NR”, and “I” securitizations we completed during the year ended December 31, 2025.
DEAL (1) | TOTAL ORIGINAL FACE | ORIGINAL FACE OF TRANCHES SOLD (2) | ORIGINAL FACE OF TRANCHES RETAINED (2) | TOTAL REMAINING FACE | REMAINING FACE OF TRANCHES SOLD | REMAINING FACE OF TRANCHES RETAINED | |||||||||||||||||||||||||||||||||||||||||||||||
| (dollars in thousands) | |||||||||||||||||||||||||||||||||||||||||||||||||||||
| CIM 2025-I1 | $ | 287,673 | $ | 275,735 | $ | 11,938 | $ | 232,747 | $ | 220,617 | $ | 11,938 | |||||||||||||||||||||||||||||||||||||||||
| CIM 2025-R1 | 391,790 | 333,021 | 58,769 | 366,344 | 307,576 | 58,731 | |||||||||||||||||||||||||||||||||||||||||||||||
| CIM 2025-NR1 | 254,432 | 184,463 | 69,969 | 174,726 | 154,491 | 63,818 | |||||||||||||||||||||||||||||||||||||||||||||||
(1) For certain of the above securitization deals, we retained certain IO and/or excess servicing classes.
(2) At the time of issuance.
Our Investment Portfolio Segment
As of December 31, 2025, based on the fair value of our interest earning assets, approximately 65% of our investment portfolio was allocated to residential mortgage loans, 23% to Agency MBS, 5% to Non-Agency RMBS and less than 1% to interests in MSR financing receivables (excluding loans held for sale by HomeXpress). As of December 31, 2025, based on the fair value of our interest earning assets approximately 6% of our portfolio capital was allocated to loans held for sale. As of December 31, 2024, based on the fair value of our interest earning assets, approximately 88% of our investment portfolio was allocated to residential mortgage loans, 4% to Agency RMBS, and 8% to Non-Agency RMBS.
6
The following briefly discusses the principal types of investments that we have made and may in the future make:
Residential Mortgage Loans
We invest in residential mortgage loans through secondary market purchases from banks, non-bank financial institutions, lenders, originators, and the Agencies, and we may choose to retain loans originated by HomeXpress, our wholly owned lending subsidiary acquired in 2025. These loans may include reperforming mortgage loans, RTLs, investor loans, prime jumbo loans, Non-QM loans, junior lien loans and other types of loans secured by residential real property.
As of December 31, 2025, our residential mortgage loan portfolio is comprised primarily of seasoned reperforming residential mortgage loans, along with investments in jumbo prime loans, investor loans and business purpose loans (including RTLs).
Our seasoned reperforming loans are loans that have been previously delinquent or in default and returned to performing status as a result of sustained borrower payment performance, typically following a loan modification, repayment plan, or other foreclosure prevention activity. The majority of our seasoned reperforming loan portfolio consists of loans that were originated prior to 2010.
Our business purpose loans, or RTLs, are loans to businesses that are secured by real property where the proceeds are generally used by the borrower to acquire and renovate the property. Upon completion of the renovation, the borrower will typically either (i) sell the property, or (ii) refinance and retain the property as a portfolio rental. Most, but not all, of the properties securing our RTLs are residential, and a portion of the loan is used to cover renovation costs. Our RTLs are included as a part of our loans held for investment portfolio and are carried at fair value. Our RTLs tend to be short duration, often less than one year, and generally the coupon rate is higher than other traditional residential mortgage loan products, which we believe are good asset traits in times of rate volatility. Currently, we do not use term securitization to finance RTLs, but we may evaluate term securitization in the future as a means of financing the portfolio.
Our investor loans are made to individuals securing non-primary residences as well as to individuals or businesses who rent the residential properties secured by such loans. We invest in loans that are eligible for sale to one or more of the Agencies as well as loans that are not eligible for sale to either of the Agencies. In both cases, with respect to our investment portfolio, we securitize the investor loans as part of our loan securitization program.
Our jumbo prime loans are residential mortgage loans made to creditworthy borrowers that exceed the conforming loan limits established by the FHFA and therefore are not eligible for purchase or guarantee by Fannie Mae or Freddie Mac. These loans are generally underwritten to traditional prime credit standards, including strong borrower credit profiles, documented income and assets, and conservative LTV ratios, but are classified as non-conforming due solely to their loan size.
Our recently acquired mortgage origination unit, HomeXpress, primary originates consumer Non-QM and investor business purpose loans. Non-QM loans are residential mortgage loans that may not meet the standards required for classification as qualified mortgages under the CFPB’s Ability-to-Repay Rule which requires a creditor to make a reasonable, good faith determination of a consumer’s ability to repay a residential mortgage loan according to its terms. These loans may feature alternative income documentation, higher debt-to-income ratios, or other non-traditional underwriting characteristics, while generally remaining in compliance with applicable consumer protection and disclosure requirements. We may evaluate from time to time opportunities to retain consumer Non-QM and investor business purpose loans originated by HomeXpress and securitize those loans in Company sponsored securitization transactions.
We primarily use securitization to finance our investments in residential mortgage loans. However, in certain instances we may retain them in our portfolio as loans held for investment. Until we securitize our residential mortgage loans, we finance our residential mortgage loan portfolio through warehouse facilities and repurchase agreements, as discussed under “Our Financing Strategy” below.
Third-party servicers service the mortgage loans in our portfolio. We conduct a due diligence review of each servicer before the servicer is retained and periodically thereafter. The duties of servicers are generally required to be performed in accordance with industry-accepted servicing practices and the terms of the relevant servicing agreement, mortgage note and applicable law. In the future, however, subject to obtaining the requisite licenses and approvals, we may elect to service mortgage loans and other types of assets.
We engage third parties to perform independent reviews of the mortgage files to assess the credit underwriting and adherence to compliance at origination with respect to the mortgage loans, as well as our ability to enforce the lien on the related mortgaged
7
properties. We typically review all of the loans we acquire. However, in certain circumstances we may select loans for diligence review utilizing risk-based sampling criteria such as property location, loan size, LTV ratio, borrower’s credit score, delinquency status and history and other criteria we believe to be important indicators of credit risk. We typically obtain representations and warranties with respect to the mortgage loans from each seller, including with respect to the origination and servicing of the mortgage loans as well as the enforceability of the lien on the related mortgaged properties. If any of the representations and warranties with respect to a mortgage loan we acquire are breached, the related seller may be obligated to repurchase the loan from us.
Residential Mortgage-Backed Securities
We invest in mortgage pass-through certificates issued or guaranteed by Ginnie Mae, Fannie Mae or Freddie Mac, which are securities representing interests in “pools” of mortgage loans secured by residential real properties where payments of both interest and principal, plus pre-paid principal, on the securities are made monthly to holders of the security, in effect passing through monthly payments made by the individual borrowers on the mortgage loans that underlie the securities, net of fees paid to the issuer/guarantor and servicers of the securities. We may also invest in Agency CMOs. Agency CMOs consist of multiple classes of securities, with each class bearing different stated maturity dates.
Monthly payments of principal, including prepayments, are first returned to investors holding the shortest maturity class; investors holding the longer maturity classes receive principal only after the first class has been retired.
We also invest in investment grade, non-investment grade and non-rated Non-Agency RMBS, which are typically certificates created by the securitization of a pool of mortgage loans that are collateralized by residential real estate properties. The respective bond class sizes are determined based on the review of the underlying collateral, the security’s cash flow priorities and credit enhancement. The payments received from the underlying loans are used to make the payments on the RMBS. Based on the payment priorities, the risk of nonpayment for the most senior, or investment grade, RMBS is lower than the risk of nonpayment for the most junior, or non-investment grade, bonds. Accordingly, the investment grade class is typically sold at a lower yield compared to the non-investment grade or unrated classes which are sold at higher yields. In addition to the Non-Agency RMBS structure and cash flow priorities, we evaluate numerous credit characteristics of the underlying mortgage loans, including, but not limited to, loan balance distribution, geographic concentration, property type, occupancy, adjustable interest rate periodic and lifetime caps, LTV characteristics and FICO score distributions. Qualifying securities are then analyzed using base line expectations of expected voluntary prepayments, involuntary defaults, and loss severities based on the collateral characteristics along with expectations surrounding the current state of credit markets and the broader economy in general. Defaults, losses and prepayments are stressed simultaneously based on a credit risk-based model. Securities in this portfolio are monitored for variance from expected prepayments, defaults, loss severities, losses and cash flow. The due diligence process is particularly important and costly with respect to newly formed originators or issuers because there may be little or no information publicly available about these entities and investments. We may also invest in Agency RMBS and Non-Agency RMBS. These IO RMBS represent the right to receive a specified proportion of the contractual interest cash flows of the underlying mortgage loans.
Other Real Estate-Related Assets
We may invest in MSRs, which are the rights to service a pool of residential mortgage loans in exchange for a portion of the interest payments on such loans. We may invest in MSRs either through excess servicing rights or the entire MSR. In an excess servicing rights transaction, we would purchase from a servicer a portion of the servicing fee that exceeds the amount needed by the servicer to provide the servicer an acceptable return. Such transactions are similar to acquiring a senior IO from a securitization trust. We may also acquire the entire MSR from a servicer, which would require that we obtain certain mortgage servicing licenses which we currently do not have. In addition, if we do obtain such licenses in the future and acquire MSRs, we may choose to perform the servicing ourselves or retain third-party servicers to service the loans for us. We believe that acquiring MSRs, whether excess or the entirety, provides a hedge for our mortgage loan portfolio and thus helps stabilize our book value through various interest rate environments.
We may invest in commercial mortgage loans consisting of first or second lien loans secured by multifamily properties, which are residential rental properties consisting of five or more dwelling units, or by mixed residential or other commercial properties, retail properties, office properties or industrial properties. These loans may or may not conform to the Agency guidelines.
We may invest in securities issued in various CDO, offerings to gain exposure to bank loans, corporate bonds, asset-backed securities, mortgages, RMBS, CMBS, and other instruments. We may also invest in other mortgage and real estate-related products, such as junior lien loans, home equity lines of credit, home equity option or shared appreciation contracts, reverse
8
mortgage loans, single-family rental properties, credit risk transfer securities, home improvement loans, and/or manufactured housing loans. These investments may complement our primary investment strategies by diversifying our portfolio and potentially enhancing risk-adjusted returns.
We may invest in Non-Agency CMBS, which are secured by, or evidence ownership interests in, a single commercial mortgage loan or a pool of mortgage loans secured by commercial properties. These securities may be senior, subordinated, investment grade or non-investment grade. We may, and in the past we did, invest in Agency CMBS. The Agency CMBS we have acquired are Ginnie Mae Construction Loan Certificates (“CLCs”) and the resulting project loan certificates, when the construction project is complete. Each CLC is backed by a single multifamily property or health care facility.
We have an investment in a limited partnership managed by a third-party registered investment advisor. The limited partnership invests in REIT eligible assets, primarily residential assets. We may make other similar investments as well as invest in operational platforms, including but not limited to entities that originate or service mortgage loans.
Investment Guidelines
We have adopted a set of investment guidelines that set out the asset classes, risk tolerance levels, diversification requirements and other criteria used to evaluate the merits of specific investments as well as the overall portfolio composition. Our investment committee periodically reviews the appropriateness of our investment guidelines and related compliance. Our Board of Directors and its committees also review our investment portfolio and related compliance with our investment policies and procedures and investment guidelines at regularly scheduled meetings.
Our Board of Directors and its committees have adopted guidelines for our investments and borrowings, including the following:
•No investment shall be made that would cause us to fail to qualify as a REIT for U.S. federal income tax purposes;
•No investment shall be made that would cause us to be required to register as an investment company under the 1940 Act;
•No investment or hedging activity shall be made that would require us to register as a commodity pool or commodity pool operator under the Commodity Act;
•With the exception of real estate and real estate related assets, no single industry shall represent greater than 20% of the securities or aggregate risk exposure in our portfolio; and
•Investments in non-rated or deeply subordinated MBS or other securities that are non-qualifying assets for purposes of the 75% REIT asset test will be limited to an amount not to exceed 50% of our stockholders’ equity.
Our Residential Origination Segment
Business Strategy
HomeXpress is a specialty mortgage lender focused primarily on providing consumer Non-QM loans and investor business purpose solutions to the residential housing market on a national basis through mortgage brokers and bankers. These loans are designed for borrowers who do not meet traditional qualified mortgage standards and documentation requirements and typically carry higher interest rates and offer more flexible solutions for potential borrowers. HomeXpress originates these residential mortgage loans primarily on a wholesale basis through independent mortgage brokers. HomeXpress currently sells all the loans it originates on a servicing-released basis to third-party institutional investors for cash premiums. Warehouse financing is used by HomeXpress to fund these loans from origination through sale. HomeXpress originated and acquired approximately $3.4 billion and $2.5 billion in total mortgage loans in 2025 and 2024, respectively. Substantially all these loans were consumer Non-QM and investor business purpose loans with approximately 2.5% of the 2025 total loan production being FHA, VA and conventional agency-conforming loans.
HomeXpress’ loan origination strategy is focused on providing consistent high-quality service to its network of independent mortgage brokers and bankers and having an agile and responsive approach to shifts in market demand for its loan products, institutional investor appetite and regulatory environments. We expect continued growth in loan originations and acquisitions to come from further penetration of HomeXpress’ existing independent mortgage brokers network and the development of new relationships with them and non-delegated correspondent lenders. Our business strategy is also focused on driving loan origination process and operational efficiencies through our customized technology and risk assessment framework so that we can control and enhance the cost of originating our loans.
9
Capital Markets Strategy
Our capital markets and treasury functions emphasize maximizing loan sale profitability and liquidity while at the same time minimizing operational, interest rate, and market risks. We seek to manage the interest rate risk for the business with interest rate lock management policies and treasury procedures, hedging the loan origination pipeline, managing warehouse facilities and the associated facility utilization, and maintaining appropriate cash balances. We aggregate our loan production into pools that are sold outright to investors in the secondary mortgage market on a servicing-released basis. The goal of our capital markets activity is to protect margin at origination, and to maximize execution at sale. This includes the operational objective of quickly aggregating and selling pools of the loans we originate to make efficient use of our capital and warehouse facilities.
Our Financing Strategy on Investment Portfolio and Residential Origination
We use leverage to fund investments, manage liquidity, improve capital efficiency, support the implementation of our investment strategies, and increase potential returns to our stockholders. At December 31, 2025 and 2024, our ratio of debt-to-equity was 5.1:1 and 4.0:1, respectively, reflecting the increased allocation to liquid Agency RMBS. For purposes of calculating this ratio, our equity is equal to the total stockholders’ equity on our Consolidated Statements of Financial Condition, and our debt consists of securitized debt, long-term debt, and secured financing agreements.
Investment Portfolio
Our Investment Portfolio segment is not required to maintain any specific debt-to-equity ratio as we believe the appropriate leverage for the particular assets our Investment Portfolio segment is financing depends on the credit quality and risk of those assets. Subject to maintaining our qualification as a REIT, we may use a variety of sources to finance our investments, including the following primary sources:
•Securitization. A significant element of our financing strategy is to acquire or retain residential mortgage loans for our portfolio with the intention of securitizing them. In our securitizations, we generally create subordinate certificates, providing a specified amount of credit enhancement, which we intend or are required under the Risk Retention Rules to retain in our portfolio. However, we may also choose to sponsor securitizations where we retain a portion of the issued securities, known as vertical risk retention. We have acquired and may in the future acquire Non-Agency RMBS for our portfolio with the intention of exercising the call rights and re-securitizing the underlying mortgage loans and retaining a portion of the re-securitized Non-Agency RMBS in our portfolio, typically the subordinate certificates.
•Secured Financing Agreements. Secured financing agreements include all non-securitization financing arrangements and are generally, but not always, for shorter terms. Our secured financing agreements are primarily comprised of repurchase agreements.
•Warehouse Facilities. We have utilized and may in the future utilize credit facilities for capital needed to fund our assets. We seek to maintain formal relationships with multiple counterparties to maintain warehouse lines on favorable terms.
•Repurchase Agreements. We have financed certain of our assets through repurchase agreements. We anticipate that repurchase agreements will be one of the sources we will use to achieve our desired amount of leverage for our investments. We seek to maintain formal relationships with many counterparties with the intent to obtain financing on the most favorable terms available while diversifying counterparty credit risk.
We maintain a portion of our financing in non-MTM facilities and limited MTM to finance a portion of our Non-Agency RMBS, including risk retention securities. The percentage of our financing allocated to such facilities will vary depending on market conditions. We believe that non-MTM facilities will continue to be a material portion of our financing strategy. We may also seek financing through capital markets offerings when appropriate.
Residential Origination
With respect to HomeXpress, we use warehouse facilities to fund newly originated loans. HomeXpress has a total of seven warehouse facilities, three of which are non-MTM, with a borrowing capacity of $1.4 billion. As of December 31, 2025, there was an outstanding balance of $802 million. The financing agreements include requirements to maintain specific debt-to-equity,
10
liquidity levels, and other financial ratios. As of December 31, 2025, HomeXpress was in compliance will all terms and conditions associated with its warehouse facilities.
Our Interest Rate Hedging and Risk Management Strategy
Investment Portfolio Segment
We use derivative financial instruments to hedge a portion of the interest rate risk associated with our borrowings. Under the U.S. federal income tax laws applicable to REITs, we generally enter certain transactions to hedge indebtedness that we incur, or plan to incur, with respect to acquiring or carrying real estate assets.
We may engage in a variety of interest rate management techniques that seek to mitigate changes in interest rates or other potential influences on the values of our assets. Our interest rate management techniques may include:
•interest rate caps, swaps and swaptions;
•puts and calls on securities or indices of securities;
•Swap futures contracts and options on such contracts;
•U.S. Treasury futures, forward contracts, other derivative contracts and options on U.S. Treasury securities; and
•other similar transactions.
We may attempt to reduce interest rate risks and to minimize exposure to interest rate fluctuations through term securitization financing structures, when appropriate. Term securitizations generally do not expose our portfolio to margin call or liquidity risk and tend to create a more durable portfolio. However, the duration of the securitized debt is typically less than the duration of the underlying mortgage loan assets, and the securitization may contain economic incentives for us to exercise our call rights at some point in the future. The duration mismatch may cause refinancing risk and we may seek to hedge this risk as part of our interest rate hedge strategy.
Residential Origination
HomeXpress operates a daily hedging program that utilizes financial instruments (2-year and 5-year U.S. Treasury futures) in an effort to protect its operational results from interest rate risk. The program covers loans from the day the IRLC is issued through the day a loan is committed for sale to an investor. As of December 31, 2025, HomeXpress had hedging instruments with a notional amount of $173 million.
Operational and Regulatory Structure
REIT Qualification
We have elected to be treated as a REIT for U.S. federal income tax purposes. In order to maintain our qualification as a REIT, we must comply with the requirements under federal tax law, including the requirement that we distribute at least 90% of our annual REIT taxable income (subject to certain adjustments) to our stockholders. As a REIT, we generally are not subject to U.S. federal income tax on our taxable income that is distributed to our stockholders. To ensure we qualify as a REIT, no person may own more than 9.8%, in value or number of shares, whichever is more restrictive, of the outstanding shares of any class or series of our capital stock, which includes our common stock and preferred stock, unless our Board of Directors waives this limitation. We have granted waivers to two mutual funds to own certain classes of our preferred stock above the 9.8% limitation. Also, we have elected to treat certain of our subsidiaries as taxable REIT subsidiaries (“TRS”). In general, a TRS may hold assets and engage in activities that a REIT or qualified REIT subsidiary (“QRS”) cannot hold or engage in directly and generally may engage in any real estate or non-real estate related business. A TRS is subject to U.S. federal income tax.
1940 Act Exclusion
We continue to conduct our operations so that neither we nor any of our subsidiaries are required to register as an investment company under the 1940 Act. Section 3(a)(1)(A) of the 1940 Act defines an investment company as any issuer that is or holds itself out as being engaged primarily in the business of investing, reinvesting or trading in securities. Section 3(a)(1)(C) of the 1940 Act defines an investment company as any issuer that is engaged or proposes to engage in the business of investing, reinvesting, owning, holding or trading in securities and owns or proposes to acquire investment securities having a value exceeding 40% of the value of the issuer’s total assets (exclusive of U.S. Government securities and cash items) on an unconsolidated basis (the “40% test”). Excluded from the term “investment securities,” among other things, are U.S.
11
Government securities and securities issued by majority owned subsidiaries that are not themselves investment companies and are not relying on the exclusion from the definition of investment company for private funds set forth in Section 3(c)(1) or Section 3(c)(7) of the 1940 Act.
If the value of securities issued by our subsidiaries that are excluded from the definition of “investment company” by Section 3(c)(1) or 3(c)(7) of the 1940 Act, together with any other investment securities we own, exceeds the 40% test under Section 3(a)(1)(C) of the 1940 Act, or if one or more of such subsidiaries fail to maintain an exclusion or exception from the 1940 Act, we could, among other things, be required either (a) to substantially change the manner in which we conduct our operations to avoid being required to register as an investment company or (b) to register as an investment company under the 1940 Act, either of which could have an adverse effect on us and the market price of our securities. If we were required to register as an investment company under the 1940 Act, we could, among other things, be required either to (a) change the manner in which we conduct our operations to avoid being required to register as an investment company, (b) effect sales of our assets in a manner that, or at a time when, we would not otherwise choose to do so, or (c) register as an investment company, any of which could negatively affect the value of our common stock, the sustainability of our business model, and our ability to make distributions. See “Risk Factors - Risks Related to Regulatory, Accounting and Our 1940 Exemption - Loss of our 1940 Act exemption would adversely affect us and negatively affect the market price of shares of our capital stock and our ability to distribute dividends.”
Investment Advisers Act of 1940
The Palisades Group, LLC (“TPG”) is registered with the SEC as an investment adviser under the Advisers Act of 1940 (the “Advisers Act”), and PAS is a relying adviser with respect to TPG’s investment adviser registration. The Advisers Act imposes numerous obligations on registered investment advisers, including fiduciary duties, disclosure obligations, recordkeeping and reporting requirements, marketing restrictions and general anti-fraud prohibitions. The failure to comply with the Advisers Act and other securities laws and regulations could cause the SEC to institute proceedings and impose sanctions for violations, including censure or terminating our registered investment adviser’s SEC registration, and could also result in litigation or reputational harm. See “Risk Factors – Risks Related to Our Investment Management and Advisory Services – Two of our subsidiaries are currently required to be registered as an investment adviser or a relying adviser, subjecting us to extensive regulation and examination by the SEC that could adversely affect our ability to manage our business.”
Licenses to Purchase and Sell Residential Mortgage Loans
While we are not required to obtain licenses to purchase MBS, the purchase and sale of residential mortgage loans in the secondary market may, in some circumstances, require us, or the entities, including securitization trusts, we use to conduct our business, to maintain various state licenses. Acquiring the right to service residential mortgage loans may also, in some circumstances, require us to maintain various state licenses even though we currently do not directly engage in loan servicing ourselves and do not expect to do so. Our failure to obtain or maintain required licenses or exemption statuses or our failure to comply with regulatory requirements that are applicable to our business of acquiring residential mortgage loans may restrict our business and investment options and could harm our business and expose us to penalties or other claims. In one or more states, in lieu of relying on such licenses, we may contribute our acquired residential mortgage loans to one or more trusts in which we or our subsidiaries hold beneficial interests; title to these residential mortgage loans may be held by one or more federally-charted banks as trustee, which may be exempt from state licensing requirements. There can be no assurance that the use of the trusts will satisfy an exemption from licensing requirements because regulatory agencies may adopt different interpretations of applicable laws.
Licenses to Originate and Acquire Mortgage Loans
Because we, through HomeXpress, originate and acquire mortgage loans in 46 states and the District of Columbia, HomeXpress must be licensed in all relevant jurisdictions that require licensure, and HomeXpress is required to comply with each such jurisdiction’s respective laws and regulations, as well as with judicial and administrative decisions applicable to it. Our failure to obtain or maintain required licenses or our failure to comply with regulatory requirements that are applicable to our business of originating and acquiring residential mortgage loans may restrict our business and investment options and could harm our business and expose us to penalties or other claims.
Mortgage Loan Origination Regulations
HomeXpress’ business is subject to extensive oversight and regulation by federal, state and local government authorities. HomeXpress’ loan origination channel is primarily regulated at the state level by state financial services authorities and
12
administrative agencies, and at the federal level by the CFPB. The CFPB has federal regulatory, supervisory and enforcement authority over the consumer residential mortgage loan origination industry that includes residential mortgage lenders such as HomeXpress. Specifically, the CFPB has rulemaking authority with respect to the federal consumer financial services laws applicable to mortgage lenders. These laws include (i) the Truth-In-Lending Act (“TILA”), (ii) the Homeowners Protection Act (“HPA”), (iii) the Real Estate Settlement Procedures Act, (iv) the Home Mortgage Disclosure Act (“HMDA”) and its implementing regulation, Regulation C. The CFPB’s enforcement jurisdiction is broad, and it can initiate or refer investigations and enforcement actions against mortgage lenders and servicers for violations of applicable consumer financial services laws, including, but not limited to, the Dodd-Frank Act’s prohibitions on unfair, deceptive or abusive acts and practices. As part of its enforcement authority, the CFPB can order, among other things, rescission or reformation of contracts, monetary refunds or the return of real property, restitution, disgorgement or compensation for unjust enrichment, the payment of damages or other monetary relief, public notifications regarding violations, remediation of practices, external compliance monitoring and civil money penalties. Since its inception in 2011, the CFPB has exercised its enforcement jurisdiction aggressively with respect to mortgage industry participants, initiating investigations, entering consent orders with significant monetary and injunctive relief, and initiating litigation. Often these matters have involved differing theories and interpretations of long-existing laws without first issuing industry guidance or rules. In addition, the CFPB shares jurisdiction with the FTC with respect to (i) the Equal Credit Opportunity Act (“ECOA”) and its implementing regulation, Regulation B, promulgated by the CFPB pursuant to ECOA, (ii) the Fair Housing Act and (iii) the Gramm-Leach-Bliley Act (“GLBA”). In addition to the CFPB, we are subject to a variety of regulatory and contractual obligations imposed by credit owners, insurers and guarantors of the mortgages we originate including, but not limited to, Freddie Mac, FHA and Veterans Affairs. Although we have compliance management systems and procedures to comply with these legal and regulatory requirements, we cannot be assured that more restrictive laws and regulations will not be adopted in the future, or that governmental bodies or courts will not interpret existing laws or regulations in a more restrictive manner, which could render our current business practices non-compliant or which could make compliance more difficult or expensive. If we are deemed to have violated applicable statutes or regulations, it could result in regulatory investigations, state or federal governmental actions or private civil claims, including class actions, being brought against us. Such litigation would cause us to incur costs, fines and legal expenses in connection with these matters, regardless of any eventual ruling in our favor, and could also harm the reputation of our brand, any of which could have a material adverse effect on our business, financial condition or results of operations. See “Risk Factors - Risks Related to Our Recent Acquisition and Loan Origination and Acquisition Business - We operate in a heavily regulated industry, and our mortgage loan origination activities as a result of our acquisition of HomeXpress expose us to risks of noncompliance with an increasing and inconsistent body of complex laws and regulations, including federal and state consumer lending regulations.”
Human Capital
At December 31, 2025, we had 423 full-time employees, including 332 employees of our consolidated subsidiary, HomeXpress. Our success depends on our ability to attract and retain talent in a diverse workplace. We focus on building an inclusive workplace that fosters varied perspectives to drive innovation. We believe that exceptional people working together is the foundation of our success and enables us to live our mission every day. We also believe that our relationship with our employees is good and none of our employees are unionized or represented under a collective bargaining agreement.
Our human capital objectives include attracting, developing, and retaining key personnel. Our employees are critical to the success of our organization, and we are committed to supporting our employees’ professional development. We believe our management team has the experience necessary to effectively implement our growth strategy and continue to drive shareholder value. We provide competitive compensation and benefits to attract and retain key personnel, while also providing a safe, inclusive and respectful workplace. We offer internal training programs on financial markets, business ethics, government regulatory rules and other topics. We encourage personnel to attend industry sponsored or other conferences and have a tuition reimbursement program to help personnel to further develop their skills and to stay current on evolving trends impacting our industry.
We focus on attracting and retaining employees by providing compensation and benefits packages that are competitive within the applicable market, taking into account the job position’s location and responsibilities. We provide competitive financial benefits such as a 401(k) retirement plan with a company match and offer a comprehensive healthcare benefit plan and other tools to support our employees’ health and well-being. Our employees are also eligible for grant awards of restricted stock units. We have a matching gift program to encourage personnel to be charitable and to support 501(c)(3) organizations.
Competition
Our success depends, in large part, on our ability to acquire and originate target assets on terms consistent with our business model. In acquiring these assets, we expect to compete with other mortgage REITs, investment management firms, specialty finance companies, savings and loan associations, banks, mortgage bankers, institutions offering to make residential mortgage
13
loans, insurance companies, exchange traded funds, mutual funds, institutional investors, investment banking firms, financial institutions, private equity funds, hedge funds, governmental bodies (including the Federal Reserve) and other entities. Many of our competitors are significantly larger than we are, have access to greater capital and other resources, and may have other advantages over us. In addition, some of our competitors may have higher risk tolerances, different risk assessments, or fewer regulatory burdens and restrictions, which could allow them to consider a wider variety of investments and establish more favorable relationships than we can.
The asset management industry is extremely competitive. We compete with other alternative asset and investment management firms, including hedge funds, public and private investment firms, distressed debt funds, business development companies, and other financial institution. We compete for both investors/clients and attractive investment opportunities based on a number of factors, including investment performance, brand recognition, business reputation, pricing, innovation, the quality of services we provide to the investors and clients, the range of products we offer and our ability to attract and retain qualified professionals in all aspects of our business while managing our operating costs. Many of our competitors are significantly larger than we are, have access to greater capital and other resources, and may have other advantages over us. The existence of these entities, as well as the possibility of additional entities forming in the future, may limit our ability to grow fees from our non-discretionary investment management and advisory services or our ability to obtain new third-party non-discretionary accounts.
Through our subsidiary, HomeXpress, we originate consumer Non-QM, investor business purpose, and other mortgage loan products. Competition in the residential mortgage loan origination market is intense. Institutions offering to make residential mortgage loans, regardless of the channel, include regional banks, specialty finance companies, credit unions, mortgage brokers and bankers, brokerage firms, insurance companies, and other financial institutions. Some of our competitors may have more market presence and greater financial and other resources than we have. Other competitors, such as lenders who originate mortgage loans using their own funds, or retail mortgage lenders, may have more operational flexibility in approving and pricing loans, may have advantages in soliciting home loans from their clients or have access to capital through deposits at lower costs than our warehouse facilities. Additionally, we are generally subject to all state and local laws applicable to lenders in each jurisdiction in which we originate loans unlike our federal chartered competitors, such as U.S. federal banks and thrifts and their subsidiaries, who conduct their business under relatively uniform U.S. federal rules and standards due to federal preemption and are generally not subject to the laws of the states in which they do business.
Available Information
Our investor relations website is www.chimerareit.com. We make available on the website under “Filings & Reports,” free of charge, our annual report on Form 10-K, our quarterly reports on Form 10-Q, our current reports and investor presentations on Form 8-K and any other reports that we file with the Securities and Exchange Commission (the “SEC”) (including any amendments to such reports) as soon as reasonably practicable after we electronically file or furnish such materials to the SEC. Information on our website, however, is not part of or incorporated by reference into this Annual Report on Form 10-K. In addition, all our filed reports can be obtained at the SEC’s website at www.sec.gov.
Item 1A. Risk Factors
You should carefully consider the following factors, together with all the other information included in this 2025 Form 10-K, in evaluating our company and our business. If any of the following risks actually occur, our business, financial condition and results of operations could be materially and adversely affected, and the value of our stock could decline. Additional risks and uncertainties not presently known to us or that we currently deem immaterial also may impair our business operations. As such, you should not consider this list to be a complete statement of all potential risks or uncertainties.
Summary Risk Factors
Risks Related to Financing
•Our inability to access funding, our cost of funding or the terms on which such funding is available could have a material adverse effect on our financial condition, liquidity or profitability.
•An increase in our borrowing costs relative to the interest we receive on our assets may materially adversely affect our profitability.
•We may not achieve what we believe to be optimal levels of leverage or we may become overleveraged, which may materially adversely affect our liquidity, results of operations, profitability or financial condition.
•Failure to effectively manage our liquidity could adversely affect our results and financial condition.
14
•Our financing facilities may contain covenants that restrict our business activities.
•We may have difficulty accessing or be unable to access capital markets.
Risks Associated with Our Investments
•Interest rate fluctuations and changes in the yield curve may have various negative effects on us and may lead to reduced earnings, increased volatility in our earnings, and reduction in our book value.
•The impact of inflation and related monetary policy efforts may adversely affect our financial performance.
•The nature of the mortgage loans we acquire and that underlie the RMBS we acquire exposes us to credit risk that could negatively affect the value of those assets and investments.
•A significant portion of our investments are in the most subordinated first-loss position of the capital structure of Non-Agency RMBS, disproportionately exposing us to credit risk.
•A significant portion of the RMBS we acquire through securitization is subject to the Risk Retention Rules.
•We have a significant amount of investments in Non-Agency RMBS collateralized by mortgage loans that do not meet the prime loan underwriting standards and are subject to increased risk of losses.
•Our investments in mortgage loans and MSRs depend on the performance of third-party mortgage servicers.
•Falling rates may accelerate mortgage prepayments, reducing future servicing income and decreasing MSR valuations.
•We may be required to fund servicing advances on delinquent loans with respect to our MSR investments, which could create liquidity demands, particularly during market downturns or periods of increased borrower distress.
•Changes in prepayment rates could negatively affect the value of our investment portfolio, which could result in reduced earnings, book value impairments, and/or negatively affect the cash available for distribution to our stockholders.
•A significant portion of our Non-Agency RMBS and residential loans are secured by properties in a small number of geographic areas and may be disproportionately affected by adverse events in those markets.
•We may change our investment strategy, adjust our asset allocation, or enter other operating businesses or financing plans without stockholder consent.
•Changes in the fair values of our assets, liabilities, and derivatives can reduce earnings, affect liquidity, increase earnings volatility, and create variability in our book value.
•Our calculations of the fair value of the assets we own or consolidate as well as liabilities related to consolidated securitizations are based upon assumptions that are inherently subjective, and the failure to realize such valuations may have a material adverse effect on our financial condition.
•Any deterioration or uncertainty in market conditions for mortgages and mortgage-related assets, as well as in broader U.S. and global economic and geopolitical conditions, could have a material adverse effect on us.
Risks Related to Our Recent Acquisition and Loan Origination and Acquisition Business
•We may fail to realize the expected benefits of the HomeXpress Acquisition.
•Our loan origination and acquisition volume and ability to sell loans are highly dependent on macroeconomic and U.S. residential real estate market conditions.
•A disruption in the secondary home loan market, our ability to sell the loans that we originate or acquire, or loan compliance issues could have a negative effect on our business.
•Our subsidiary, HomeXpress, relies on warehouse facilities, structured as repurchase agreements, to finance loan originations and acquisitions. These facilities are short-term and subject us to various risks.
•Our business is dependent on our ability to maintain and expand our relationships with our clients, the independent mortgage brokers and bankers.
•Our mortgage loans are primarily initiated by third parties, which exposes us to business and other risks.
Risks Related to Our Investment Management and Advisory Services
•Our investment management and advisory services involve certain risks, which could adversely affect our business, financial condition and results of operations.
•Our failure to appropriately manage or address conflicts of interest could damage our reputation.
•Two of our subsidiaries are currently required to be registered as an investment adviser or a relying adviser, subjecting us to extensive regulation and examination by the SEC.
•Our asset management and advisory services business has significant client concentration. Failure to attract, grow, and retain a diverse and balanced client base could adversely affect our asset management and advisory services business.
15
Risks Related to Hedging
•Hedging against interest rate exposure may not be successful in mitigating the risks associated with interest rates and may reduce our cash and adversely affect our financial condition and result of operations.
•We may enter into hedging instruments that could expose us to contingent liabilities in the future, which could materially adversely affect our results of operations.
•The characteristics of hedging instruments present various concerns, including illiquidity, enforceability, and counterparty risks, which could adversely affect our business and results of operations.
Risks Associated with Our Operations
•Through certain of our wholly owned subsidiaries we may from time to time engage in securitization transactions relating to residential mortgage loans, which may expose us to potentially material risks.
•Our ability to profitably execute future securitization transactions may be negatively impacted by adverse market conditions.
•Competition may affect our ability to source our target assets at attractive prices and grow our investment management and advisory services, which may have a material adverse effect on our business, financial condition and results of operations.
•Risks related to servicers and other third parties, including their ability to perform their services at a high level and comply with applicable laws, may have an adverse impact on our business.
•Our use of third-party analytical models and data introduce risks related to model accuracy that may have an adverse effect on our execution of investment activities.
•We are dependent on information technology and systems and their failure, including through cyber-attacks, could significantly disrupt our business.
•The development, proliferation and use of artificial intelligence could give rise to legal and/or regulatory action, damage our reputation or otherwise materially impact our business, financial condition, and liquidity.
•The loss of key employee may materially adversely affect our business.
Risks Related to Regulatory Matters, Accounting, and Our 1940 Act Exemption
•Our business is subject to extensive regulation that may subject us to significant costs and compliance requirements, and there can be no assurance that we will satisfactorily comply with such regulations.
•There is no assurance we will be able to obtain various state licenses to purchase mortgage loans.
•Loss of our 1940 Act exemption would negatively affect our share price, our ability to distribute dividends, and us generally.
U.S. Federal Income Tax Risks and Risk Related to Our REIT Status
•Risks related to compliance with REIT requirements, our qualification as a REIT and our election to qualify as a REIT.
•Distributions or gain on sale may be treated as unrelated business taxable income to tax-exempt investors.
•Classification of our securitizations or financing arrangements as a taxable mortgage pool could subject us or certain of our stockholders to increased taxation.
•Failure to make required distributions would subject us to tax, which would reduce the cash available for distribution to our stockholders.
Risks Related to Our Organization and Structure
•Certain provisions of Maryland Law, of our charter, and of our bylaws may inhibit potential acquisition bids that stockholders may consider favorable and may affect the market price of our capital stock
Risks Related to Financing
Our inability to access funding, our cost of funding or the terms on which such funding is available could have a material adverse effect on our financial condition, liquidity or profitability, particularly during times of severe market disruption in the financial, mortgage, housing or related sectors.
16
Our ability to fund our operations, meet financial obligations and finance target asset acquisitions may be impacted by our ability to secure and maintain our financing arrangements, including repurchase agreements, secured financing trusts and warehouse facilities with our counterparties. Because repurchase agreements and warehouse facilities are often short-term commitments of capital, lenders may respond to market conditions by making it more difficult for us to renew or replace on a continuous basis our maturing short-term borrowings and have and may continue to impose more onerous conditions when rolling such financings. For example, times of significant dislocation in the financial markets may result in lenders being unwilling or unable to provide us with financing, which could force us to sell assets at an inopportune time or negatively affect lenders’ valuation of our target assets which may result in margin calls, requiring a pledge of additional collateral or cash to re-establish the required ratio of borrowing to collateral value under our repurchase agreements. In addition, the regulatory capital requirements imposed on our lenders may change, or our lenders may revise their eligibility requirements for the types of assets they are willing to finance or the terms of such financings, including requiring additional collateral in the form of cash, which may adversely affect our ability to fund our operations. If we are not able to renew our existing facilities or arrange for new financing on terms acceptable to us, or if we default on our covenants or are otherwise unable to access funds under our financing facilities, or if we are required to post more collateral or face larger haircuts or if we otherwise fail to effectively manage and maintain our liquidity resources, we may have to curtail our asset acquisition activities and/or dispose of assets at a loss. In addition, posting additional collateral or cash to support our credit will reduce our liquidity and limit our ability to leverage our assets, which could materially adversely affect our business.
An increase in our borrowing costs relative to the interest income we receive on our assets may materially adversely affect our profitability.
Our earnings are primarily generated from the difference between the interest income we earn on our investment portfolio, less net amortization of purchase premiums and discounts, and the interest expense we pay on our borrowings. During a period of rising or elevated interest rates, our borrowing costs generally will increase at a faster pace than our interest earnings on the leveraged portion of our investment portfolio, which could result in a decline in our net interest spread and net interest margin. We may rely on borrowings under repurchase agreements to finance our investments, which have short-term contractual maturities, or we may use longer-term mark-to-market, non-MTM, and limited MTM financing, which may be more expensive than traditional short-term mark-to-market financing but offers more certainty with respect to funding availability. In general, if the interest expense on our borrowings increases relative to the interest income we earn on our investments, our profitability may be materially adversely affected.
Our business strategy involves the use of leverage. We may not achieve what we believe to be optimal levels of leverage or we may become overleveraged, which may materially adversely affect our liquidity, results of operations, profitability or financial condition.
Our business strategy involves the use of borrowing, or leverage. Pursuant to our leverage strategy, we borrow against a substantial portion of our assets and use the borrowed funds to finance our investment portfolio and the acquisition of additional investment assets. Future increases in the amount by which the collateral value is required to contractually exceed the amount borrowed in such leverage financing transactions, decreases in the market value of our residential mortgage investments, increases in interest rate volatility and changes in the availability of acceptable financing from our existing lenders or alternative sources could cause us to be unable to achieve the amount of leverage we believe to be optimal for achieving our profitability objectives. The return on our assets and cash available for distribution to our stockholders may be reduced to the extent that changes in market conditions prevent us from achieving the desired amount of leverage on our investments or cause the cost of our financing to increase relative to the income earned on our leveraged assets. For certain investments we may evaluate the feasibility of entering into non-MTM financing in order to mitigate liquidity risks related to volatile interest rates and credit market conditions. Non-MTM facilities typically have higher interest rates and deleveraging provisions which reduce the net cash we receive from underlying assets. If the interest income on the investments that we have purchased with borrowed funds fails to cover the interest expense of the related borrowings, we will experience net interest losses and may experience net losses from operations. Such losses could be significant because of our leveraged structure. The risks associated with leverage are more acute during periods of economic slowdown or recession and may further hinder our ability to achieve what we believe to be optimal levels of leverage or increase our risk of becoming overleveraged. The use of leverage to finance our investments involves many other risks, including, among other things, the following:
•If we or a counterparty to our repurchase transactions defaults on its obligation under the repurchase agreement, we could incur losses. When we engage in repurchase transactions, we generally sell assets to the counterparty to the agreement for cash. Because the cash we receive from the counterparty is less than the value of those securities (this difference is referred to as the “haircut”), if the lender defaults on its obligation to transfer the same securities back to us, we would incur a loss on the transaction equal to the amount of the haircut (assuming there was no change in the value of the securities). See Item 7, “Management’s Discussion
17
and Analysis of Financial Condition and Results of Operations” of this 2025 Form 10-K, for further discussion regarding risks related to exposure to financial institution counterparties. Generally, if we default on a repurchase transaction, the counterparty could liquidate the assets and use the proceeds to repay the amounts it is owed. If the amount received from the sale is equal to or less than the amount owed, we will incur a loss equal to the haircut and the counterparty has recourse to us to repay any remaining deficiency. In addition, if we default on a transaction under any one agreement and fail to honor the related guarantee, the counterparties to our other repurchase agreements could also declare a default under their respective repurchase agreements. Any losses we incur on our repurchase transactions could materially adversely affect our earnings and thus our cash available for distribution to our stockholders and could also adversely affect our liquidity.
•Adverse developments involving major financial institutions or involving one of our lenders could result in a rapid reduction in our ability to borrow and materially adversely affect our business, profitability, and liquidity. As of December 31, 2025, we had amounts outstanding under repurchase agreements with 20 separate lenders, including amounts at risk with Nomura Securities International, Inc. (“Nomura”), of 18% of our equity related to the collateral posted on secured financing agreements. A material adverse development involving one or more major financial institutions or the financial markets, in general, could result in us reducing exposure to certain lenders to mitigate credit risk or our lenders reducing our access to funds available under our repurchase agreements or terminating such repurchase agreements altogether. Because substantially all our repurchase agreements are uncommitted and renewable at our lenders’ discretion, our lenders could determine to reduce or terminate our access to future borrowings at virtually any time, which could materially adversely affect our business and profitability. Furthermore, if a few of our lenders became unwilling or unable to continue to provide us with financing, we could be forced to sell assets, including assets in unrealized loss positions, to maintain liquidity. Forced sales, particularly under adverse market conditions, could result in lower sale prices than ordinary market sales made in normal market conditions. If our investments were liquidated at prices below our amortized cost of such assets, we would incur losses, which would adversely affect our earnings.
•Our use of repurchase agreements to borrow money may give our lenders greater rights in the event of bankruptcy. In the event of our insolvency or bankruptcy, certain repurchase agreements may qualify for special treatment under the Bankruptcy Code, the effect of which, among other things, would be to allow the creditor under the agreement to avoid the automatic stay provisions of the Bankruptcy Code and take possession of, and liquidate, the collateral under such repurchase agreements without delay.
•A recharacterization of the repurchase agreements as sales for tax purposes rather than as secured lending transactions would adversely affect our ability to maintain our qualification as a REIT and to maintain our 1940 Act exemption. When we enter into a repurchase agreement, we generally sell assets to our counterparty to the agreement for cash. The counterparty is obligated to resell the assets back to us at the end of the transaction term. We believe that for U.S. federal income tax purposes we will be treated as the owner of the assets that are the subject of repurchase agreements and that the repurchase agreements will be treated as secured lending transactions notwithstanding that such agreement may transfer record ownership of the assets to the counterparty during the term of the agreement. It is possible, however, that the IRS or the SEC could successfully assert that we did not own these assets during the term of the repurchase agreements, in which case we could fail to qualify as a REIT or fail to maintain our 1940 Act exemption, respectively.
•Our financing facilities may contain covenants that restrict our operations. Certain financing facilities we may enter into contain restrictions, covenants, and representations and warranties that, among other things, require us to satisfy specified financial, asset quality, loan eligibility, and loan performance tests. If we fail to meet or satisfy any of these covenants or representations and warranties, we would be in default under these agreements and our lenders could elect to declare all amounts outstanding under the agreements to be immediately due and payable, enforce their respective rights against collateral pledged under such agreements, and restrict our ability to make additional borrowings. Certain financing agreements may contain cross-default provisions by a guarantor so that if a default occurs under any guaranty agreement, the lenders under our other financing agreements could also declare a default under their respective agreements. Further, under our mark-to-market agreements, we are typically required to pledge additional assets to our lenders in the event the estimated fair value of the existing pledged collateral under such agreements declines and such lenders demand additional collateral, which may take the form of additional securities, loans or cash. These
18
restrictions may interfere with our ability to obtain financing or to engage in other business activities, which may have a significant negative impact on our business, financial condition, liquidity and results of operations. A default and resulting repayment acceleration could significantly reduce our liquidity, which could require us to sell our assets to repay amounts due and outstanding whether or not the prices and terms of such sales are favorable to us. A default will also significantly limit our financing alternatives such that we will be unable to pursue our leverage strategy, which could lower our investment returns. This could also significantly harm our business, financial condition, results of operations, and our ability to make distributions, which could cause the value of our stock to decline.
We may have difficulty accessing or be unable to access capital markets.
We may not be able to readily raise capital from external sources in a timely manner or on favorable terms. Many of the same factors that could make the pricing for investments in real estate loans and securities attractive, such as the availability of assets from distressed owners who need to liquidate them at reduced prices, and uncertainty about credit risk, housing, and the economy, may limit investors’ and lenders’ willingness to provide us with additional capital on terms that are favorable to us, if at all. These risks may be more acute during periods of heightened volatility in securities prices in the mortgage sector, making it more difficult to raise capital accretive to our earnings, book value and overall results of operations. There may also be other reasons we are not able to readily raise capital in a timely manner or on favorable terms, and, as a result, may not be able to finance growth in our business and in our portfolio of assets and we could experience other adverse impacts. To the extent we need to raise capital on unfavorable terms, we may experience greater dilution of existing shareholders, higher interest costs, or higher transaction costs.
Risks Associated with Our Investments
Interest rate fluctuations, including as a result of the Federal Reserve's monetary policy, may have various negative effects on us and may reduce the market value of our investments and negatively affect our book value, earnings and cash available for distribution, as well as increasing volatility.
Changes in interest rates, the interrelationships between various rates, interest rate volatility, and the shape of the yield curve, including changes to the Federal Reserve’s interest rate policies in response to inflation, labor market conditions and other economic factors, may have negative effects on our earnings, the fair value of our assets and liabilities, loan prepayment rates, and our access to liquidity. For example, interest rate changes, particularly increases in interest rates, could have one more of the following consequences:
•Some of the loans and securities we own or may acquire have adjustable-rate coupons or may be subordinate securities entitled to cash flow only after the more senior securities have been paid. As such, the cash flows and earnings we receive from these assets may vary as a function of interest rates.
•Changes in interest rates may harm the credit performance of our assets and result in costlier financing, which may affect our earnings results, reduce our ability to securitize, re-securitize, or sell our assets, or reduce our liquidity.
•Higher interest rates could reduce mortgage borrowers’ ability to make interest payments or to refinance their loans, reduce property values, lead to increased credit losses, and reduce mortgage originations, thus reducing our opportunities to acquire or originate new assets.
•Our investment portfolio contains a significant allocation to MBS and residential loans, which are generally sensitive to changes in long-term interest rates. In a rising rate environment, the market value of longer-duration investments typically declines. As interest rates increase, the duration and weighted average life of our target assets may also extend, further magnifying potential declines in value. Decreases in the market value of these investments may reduce our earnings or result in realized losses, which could negatively impact our stockholders by reducing the cash available for distribution and/or book value.
•If both short-term and long-term interest rates rise significantly, we may be subject not only to higher financing costs on our repurchase agreements but also to declining valuations in our portfolio. These combined pressures may reduce our net income, book value, and overall financial performance. If these
19
conditions persist, they may have a material adverse effect on our results of operations and our ability to make distributions to our stockholders.
We may seek to hedge a majority of, but not all interest rate risks. Our hedging may not work effectively or be successful at all, and we may change our hedging strategies or the degree or type of interest rate risk we assume.
Changes in the yield curve may cause differences in timing between interest rate adjustments on our interest-earning assets and our borrowings, adversely affecting our net interest spread, and may impact our assets and liabilities differently, adversely affecting our book value if our assets are negatively impacted or the value of our liabilities increase.
Our earnings depend, in part, on the difference between the interest income on our interest-earning assets and the interest expense on our borrowings. The relationship between short-term and longer-term interest rates is often referred to as the “yield curve.” In a normal yield curve environment, short-term interest rates are lower than longer-term interest rates. If short-term rates rise disproportionately relative to longer-term rates (often called a “flattening” or “inversion” of the yield curve), our borrowing costs generally increase more rapidly than the interest income we earn, compressing our net interest margin. Because our assets, on average, bear interest based on longer-term rates than our borrowings, a flattening or inversion of the yield curve would tend to decrease our net interest margin, net income, book value, and the market value of our net assets. In the event that short-term rates exceed longer-term rates, we could experience negative net interest spread and incur operating losses.
Additionally, when principal from our investments is returned (either through scheduled or unscheduled payments) and must be reinvested in new assets, the spread between the yields on new investments and our available borrowing rates may narrow. This reinvestment dynamic could further reduce our net income. Changes in the yield curve may also affect the pace and profitability of securitization transactions if the market environment becomes less favorable for issuing or pricing securitized products. In addition, changes in the shape of the yield curve may impact our assets and liabilities differently, and when such changes negatively impact the value of our assets, or increase the value of our liabilities, it may adversely affect our book value.
The impact of inflation and related monetary policy efforts may adversely affect our financial performance.
Certain actions taken by the U.S. government, including the Federal Reserve, may impact our results. In response to concerns about inflation, labor market conditions, or other economic factors, the Federal Reserve may adjust monetary policy. Given our reliance on short-term borrowings to generate interest income, if the yield curve were to flatten or even invert, or if the Federal Reserve finds itself falling behind on inflation and more aggressively tightens monetary policy, our results of operations, financial condition and business could be materially adversely impacted.
The nature of the mortgage loans we acquire and that underlie the RMBS and MSRs we acquire exposes us to credit risk that could negatively affect the value of those assets and investments.
We assume credit risk primarily through the ownership of MSRs and securities backed by residential, multi-family, and commercial real estate loans and through direct investments in residential real estate loans. The substantial majority of our investment assets are subject to various credit risks, as discussed below.
No U.S. Government Guarantee. We acquire residential loans including reperforming loans, nonperforming loans, Non-QMs, jumbo prime loans, and RTLs, which are subject to increased risk of loss. Unlike Agency RMBS, Non-Agency RMBS and residential mortgage loans generally are not guaranteed by the U.S. Government or any GSEs such as Fannie Mae and Freddie Mac. Additionally, by directly acquiring residential loans, we do not receive the structural credit enhancements that benefit senior tranches of RMBS. A residential loan is directly exposed to losses resulting from a borrower default. Therefore, the value of the underlying property, the creditworthiness and financial position of the borrower, and the priority and enforceability of the lien will significantly impact the value of such mortgage loan. In the event of a foreclosure, we may assume direct ownership of the underlying real estate. The liquidation proceeds upon sale of such real estate may not be sufficient to recover our cost basis in the loan, and any costs or delays involved in the foreclosure or liquidation process may increase losses. In addition, claims may be assessed against us because of our position as a mortgage holder or property owner, including assignee liability, environmental hazards, and other liabilities. We could also be responsible for property taxes. In some cases, these claims may lead to losses exceeding the purchase price of the related mortgage or property. The occurrence of any of these risks could materially adversely impact our results of operations, financial condition, and business.
Non-QM Loan Risks. In addition, we acquire and may retain Non-QMs that will not have the benefit of enhanced legal protections otherwise available to residential mortgage loans originated to a more restrictive credit standard than just determining a borrower’s ability to repay. The ownership of Non-QMs subjects us to legal, regulatory and other risks, including
20
those arising under federal consumer protection laws and regulations designed to regulate residential mortgage loan underwriting and originators’ lending processes, standards, and disclosures to borrowers. Failure of residential mortgage loan originators or servicers to comply with the CFPB’s Ability-to-Repay Rule could subject us, as an assignee or purchaser of these loans (or as an investor in securities backed by these loans), to monetary penalties assessed by the CFPB through its administrative enforcement authority and by mortgagors through a private right of action against lenders or as a defense to foreclosure, including by recoupment or setoff of finance charges and fees collected, and could result in rescission of the affected residential mortgage loans, which could adversely impact our business and financial results.
Lower Underwriting Standards Risk. A majority of the Non-Agency RMBS we have acquired on the secondary market or retained in our securitizations are backed by collateral pools containing mortgage loans that were originated using underwriting standards that were less strict than those used in underwriting conventional or prime credit quality mortgage loans. These lower standards permitted mortgage loans, often with LTV ratios exceeding 80%, to be made to borrowers having impaired credit histories, lower credit scores, higher debt-to-income ratios or unverified income. Such mortgage loans are likely to experience delinquency, foreclosure, bankruptcy, and other losses at rates that are higher than those experienced by conventional or prime credit quality mortgage loans. Thus, the performance of our Non-Agency RMBS that are backed by these types of loans could be correspondingly worse than those backed by other types of mortgage loan products, especially during times of economic stress, which could materially adversely impact our results of operations, financial condition, and business.
Greater General Credit Risks. In addition, credit losses on residential real estate loans can occur for many reasons (many of which are beyond our control), including, but not limited to: fraud; poor underwriting; poor servicing practices; weak economic conditions; increases in payments required to be made by borrowers; declines in the value of homes; earthquakes, the effects of climate change (including flooding, drought, wildfire and severe weather), and other natural disaster events; uninsured property loss; borrower over-leveraging; costs of remediation of environmental conditions, such as indoor mold; changes in zoning or building codes and the related costs of compliance; acts of war or terrorism; pandemics; changes in legal protections for borrowers and other changes in law or regulation; and personal events affecting borrowers, such as reduction in income and job loss. Additionally, the amount and timing of credit losses could be affected by loan modifications, foreclosure and eviction moratoriums, reductions in mortgage debt by bankruptcy courts, delays in the liquidation process, documentation errors, deficient or missing collateral files, and other actions by servicers. Weakness in the U.S. economy or the housing market could cause our credit losses to increase beyond levels that we currently anticipate.
A significant portion of our investments are in Non-Agency RMBS that are the most subordinate securities in securitizations, making us the first-loss security holder, which means these securities are subject to significant credit risk, are illiquid, and are difficult to value.
A significant portion of our Non-Agency RMBS are subordinate classes we have acquired through securitization of mortgage loans. The mortgage loans we have securitized are generally recorded on our balance sheet as “securitized mortgage loans” for GAAP purposes, but in effect we own these assets in the form of securities. A substantial portion of the mortgage loans that we securitize and the subordinate securities that we retain are not newly originated “prime mortgage loans” but rather seasoned reperforming mortgage loans and Non-QM loans that have less strict underwriting standards and are therefore subject to greater risk of loss.
When we securitize mortgage loans, we sell the most senior and mezzanine securities backed by those loans and retain the most subordinate classes of securities, which means we are the first-loss security holder and the securities we own represent a portion of the “securitized mortgage loans” on our balance sheet. Losses on any residential mortgage loan securing our RMBS will be borne first by the owner of the property (i.e., the owner will first lose any equity invested in the property) and, thereafter, by us as the first-loss security holder, and then by holders of more senior securities. If the losses incurred upon loan default exceed any reserve fund, letter of credit, and classes of securities junior to those we own (if any), we may not be able to recover our investment in such securities. Also, if the underlying properties have been overvalued by the originating appraiser or if the values subsequently decline resulting in less collateral available to satisfy interest and principal payments due on the related security, as the first-loss security holder, we may suffer a total loss of our investment, followed by losses on the more senior securities (or other RMBS that we may own). Losses with respect to these investments, which are subject to significant credit risk, could increase or otherwise be higher than anticipated. For a description of the credit risk we are exposed to, see the Risk Factor above captioned “The nature of the mortgage loans we acquire and that underlie the RMBS and MSRs we acquire exposes us to credit risk that could negatively affect the value of those assets and investments.”
In addition, many of our Non-Agency RMBS securities are first loss and subject to the Risk Retention Rules. Pursuant to the Risk Retention Rules, when we sponsor a residential mortgage loan securitization, we are required to retain at least 5% of the fair value of the MBS issued in the securitization. We can retain either an “eligible vertical interest” (which consists of at least 5% of each class of securities issued in the securitization), an “eligible horizontal residual interest” (which is the most
21
subordinate class of securities with a fair market value of at least 5% of the aggregate credit risk) or a combination of both totaling 5% (the “Required Credit Risk”). We typically own the eligible horizontal residual interest. We are required to hold the Required Credit Risk until the later of (i) the fifth anniversary of the securitization closing date and (ii) the date on which the aggregate unpaid principal balance of the mortgage loans in such securitization has been reduced to 25% of the aggregate unpaid principal balance of the mortgage loans as of the securitization closing date, but no longer than the seventh anniversary of the closing date (the “Sunset Date”). In addition, before the Sunset Date, we may not engage in any hedging transactions if payments on the hedge instrument are materially related to the Required Credit Risk and the hedge position would limit our financial exposure to the Required Credit Risk. Also, we may not pledge our interest in any Required Credit Risk as collateral for any financing unless such financing is full recourse to us. We have financed certain Required Credit Risk positions in full recourse transactions and our ability to refinance the full recourse transactions at maturity on similar or equivalent terms exposes us to certain liquidity and financial risks. Our Required Credit Risk subjects us to the first losses on our securitizations and is illiquid, which may make it more difficult to meet our liquidity needs, each of which may materially and adversely affect our business and financial condition.
The fair value of securities, especially our first loss credit risk retention securities, reperforming mortgage loans (loans that typically were significantly delinquent and subsequently modified), and other investments we make that are not frequently traded may not be readily determinable, and it may be difficult to obtain third-party pricing on such investments. Also, validating third-party pricing for illiquid investments may be more subjective than more liquid investments and may not be reliable. Illiquid investments may also experience greater price volatility because an active market does not exist. We value our investments quarterly based on internally developed processes and valuation models and in accordance with our valuation policy. Because such valuations are inherently uncertain, our fair value determination may differ materially from the values obtained from third parties or the values that would have been used if an active trading market existed for these investments. Our results of operations, financial condition and business could be materially adversely affected if our fair value determinations of the investments were materially different than the values that would exist if a ready market existed for these assets.
The illiquidity of our investments may make it difficult, or impossible for certain assets subject to the Risk Retention Rules, for us to sell these assets. Financing may also be more difficult. Also, if we quickly liquidate all or a portion of our portfolio (for example, to meet a margin call), we may realize significantly less than the value at which we have previously recorded our investments. Thus, our ability to adjust our portfolio in response to changes in economic and other conditions may be relatively limited, which could adversely affect our results of operations, financial condition and the value of our capital stock.
Our interests in MSR financing receivables expose us to risk of loss if the related master servicer is unable to satisfy its obligations to the GSEs and/or to us.
We have interests in MSR financing receivables that expose us to risk of loss. We do not hold the requisite licenses to purchase or hold MSRs directly. Instead, we have entered and, in the future, may enter into purchase agreements with licensed, GSE-approved residential mortgage loan servicers to acquire base and excess servicing compensation rights (known as MSRs) that enable us to garner the economic return of an investment in an MSR purchased by the mortgage servicing counterparty through an MSR financing transaction.
Generally, an MSR financing transaction with a licensed, GSE-approved residential mortgage loan servicer provides that we: (i) purchase an interest in the “excess servicing spread” from such mortgage servicing counterparty, entitling us to monthly distributions of the servicing fees collected by the mortgage servicing counterparty in respect of the underlying MSRs in excess of a base rate (often approximately 12.5 basis points per annum for conventional loans) and (ii) enter into a Reference Spread Agreement for Agency Loans (“RESPA”) with the mortgage loan servicer, or an affiliate thereof, that references the performance of the underlying MSRs. The amount that we pay to enter into a RESPA entitles us to receive an amount generally equivalent to the excess of servicing proceeds (which may include servicing fee revenue, income generated on escrow balances, reimbursements for previously made servicing advances, and proceeds from the sale of the underlying MSRs) over the sum of the excess servicing spread and the actual costs of servicing (including amounts paid for servicing advances, master and subservicing fees, and other costs and expenses). Interests in MSR financing receivables also generally entitle us to distributions of corresponding proceeds upon a sale of the underlying MSRs.
We rely on the mortgage loan servicer to maintain the state licenses required to hold and manage the underlying MSRs, and, when the underlying MSRs related to mortgage loans are guaranteed by a GSE, to maintain the required GSE approvals. If the mortgage loan servicer were to default under its servicing or other obligations to a GSE, such GSE could transfer the related servicing rights to another servicer, in which case we could realize a significant loss on our interests in MSR financing
22
receivables, which could materially adversely affect our business, financial condition and results of operations, and our ability to pay dividends to our stockholders.
While our interests in MSR financing receivables involving GSE-guaranteed loans are often subject to an “acknowledgement agreement” with the GSE, which gives us some rights in the event of a mortgage loan servicer default, such rights are not absolute and the underlying MSRs remain subject and subordinate in all respects to the interests of the related GSE.
In addition to being subject to regulations by the GSEs, mortgage servicers are also subject to extensive federal, state and local laws, regulations and administrative decisions. As mortgage servicers, their failures to comply with these laws, regulations and administrative decisions can expose the mortgage loan servicing counterparty to fines, damages and losses. Mortgage loan servicers operate in a highly litigious industry that also subject them to potential lawsuits related to billing and collections practices, modification protocols or foreclosure practices. Furthermore, mortgage loan servicers can often be held responsible for the actions of any subservicers they employ.
Finally, if a mortgage loan servicer becomes insolvent, we may become a general unsecured creditor of such mortgage loan servicer with respect to the related interests in MSR financing receivables, which could materially adversely affect our business, financial condition and results of operations, and our ability to pay dividends to our stockholders.
Our interests in MSR financing receivables may expose us to additional financing-related risks, and we may be reliant on acknowledgement agreements with the GSEs and a master servicer's cooperation with its financing sources and its compliance with covenants in its MSR financing facility.
For our current investments in MSR financing receivables, we allow the mortgage loan servicer to apply leverage to the underlying MSRs by pledging them under an MSR financing facility, in which case the lender would have a secured interest in the pledged underlying MSRs. Under a typical MSR financing facility, if the fair value of the pledged underlying MSRs declines and the lender demands additional collateral from the mortgage loan servicer through a margin call, we would be required to provide the mortgage loan servicer with additional funds or other assets to meet such margin call; if we were unable to satisfy such margin call, the lender could declare an event of default. MSR financing facilities typically require the mortgage loan servicer to satisfy various covenants, conditions and tests, the failure of which could lead to an amortization event and/or an event of default, and the satisfaction of which is out of our control. An event of default under an MSR financing facility could result in the liquidation by the lender of the pledged underlying MSRs to satisfy the loan obligation, which could result in a material loss on our interests in MSR financing receivables and materially adversely affect our business, financial condition and results of operations, and our ability to pay dividends to our stockholders.
Further, our MSR financing facility may also cross-collateralize MSR financing facilities of other investors of the related mortgage loan servicer, whose MSR-related investments (that may or may not be similar to our interests in MSR financing receivables) secure such other investor’s MSR financing facility. Each MSR financing facility requires each of the servicer borrower and the investor borrower to be jointly and severally liable for the obligations of other borrower. Through the servicer borrower, as a common co-borrower on every investor MSR financing facility, each investor borrower may be jointly and severally liable with every other investor borrower. As a result, we may have liability not only for our own obligations under our MSR financing facility, but our MSR financing receivables may also cross-collateralize another investor’s MSR financing facility. In a scenario where those other MSR-related investments decline in value and trigger margin calls under the other investor’s MSR financing facility, if the applicable borrower does not provide funds or additional assets to meet such margin calls, the MSR financing lender could declare a default under the other investor’s MSR financing facility. If that were to occur, we could be required to repay all outstanding obligations under our MSR financing facility on short notice in order to preserve the value of our own investments and avoid an amortization event and/or an event of default under our MSR financing facility. In addition, any inability to repay all outstanding obligations under our MSR financing facility within the required repayment period, including repayments required due to margin calls made because of declines in the value of the MSRs, could lead to impairments to the extent our interests in MSR financing receivables were to be applied to satisfy outstanding obligations of the other investor’s MSR financing facility before satisfying our outstanding obligations under our MSR financing facility.
In addition, the borrowing capacity under any MSR financing is limited, and if the mortgage loan servicer is not successful in upsizing an MSR financing facility or finding a larger replacement facility, we may not be able to achieve our projected leveraged economic returns on our interests in MSR financing receivables. In addition, any new MSR financing facility entered into by a mortgage loan servicer would be subject to approval by the relevant GSE. If the mortgage loan servicer cannot obtain such GSE approval, it may not be able to obtain financing for us on favorable terms or at all.
23
We may have to fund amounts equal to the servicing advances due under our interests in MSR financing receivables, which could adversely impact our business, financial condition and results of operations, and our ability to pay dividends to our stockholders.
Pursuant to certain RESPA contracts, to the extent that costs of servicing exceed servicing proceeds, we may be obligated to pay the equivalent of such excess to cover such “servicing advances,” which can include the payment of unpaid principal and interest due to the third-party owners of the loans, property taxes and insurance premiums, legal expenses and other protective advances that have not yet been received from the individual borrowers. Subject to the terms of the relevant servicing agreements, the mortgage loan servicer is generally entitled to reimbursement for servicing advances that are not subsequently collected from the underlying borrowers, and under the RESPA we would in turn be reimbursed by the RESPA counterparty for any servicing advances that we had funded. Our right to such reimbursement is unsecured.
During periods of economic disruption, there is a greater possibility that mortgage loan borrowers could fail to pay principal and interest payments, request forbearance of their monthly mortgage payments altogether, or otherwise miss scheduled payments including property taxes and insurance premium escrows, which could greatly increase the amount of servicing advances we would be required to indirectly fund, which could materially adversely affect our business, financial condition and results of operations, and our ability to pay dividends to our stockholders.
Our interests in MSR financing receivables may involve complex or novel structures.
Our interests in MSR financing receivables may involve complex or novel structures. Accordingly, the risks associated with the transactions and structures are not fully known. In the case of interests in MSR financing receivables that reference mortgages guaranteed by GSEs, the GSEs may require that we submit to costly or burdensome conditions as a prerequisite to their consent to an investment in, or our financing of, those MSRs. These conditions, which could include large capital requirements, may greatly reduce the potential returns available from these investments.
It is possible that a GSE’s views on whether any such acquisition structure is appropriate or acceptable may not be known to us when we make an investment and may change from time to time for any reason, even with respect to a completed investment. A GSE could even impose new conditions on our existing interests in MSR financing receivables, including rights with respect to such MSRs. Such new conditions may be costly or burdensome and could require us to dispose of the interests in MSR financing receivables at an inopportune time.
Moreover, complying with such new conditions could require us or our co-investment counterparties to agree to material structural or economic changes, as well as agree to indemnification or other terms that expose us to risks to which we have not previously been exposed, all of which could negatively affect the returns from our investments.
In addition, the novelty and/or complexity of such structures may limit our ability to transfer such interests, including as a result of required GSE consents and/or the unsecured nature of our interest, and the market for investors willing to invest in an asset with such a novel and complex structure may be limited or may not exist at all, which could materially adversely affect our business, financial condition and results of operations, and our ability to pay dividends to our stockholders.
We do not have legal title to the underlying MSRs.
The licensed residential mortgage loan servicer, rather than us, owns legal title to the MSRs and is responsible for performing all servicing activities. While we do purchase the excess servicing spread from the mortgage loan servicer, we do not purchase an interest in the underlying MSRs, and instead rely on the RESPA and True Excess Spread Agreement for FNMA Loans, which entitles us to payments based on the performance of the underlying MSRs but does not give us any security interest or buyer's rights to the underlying MSRs. The validity or priority of our interest in the underlying MSRs, which is not secured, could be challenged in a bankruptcy proceeding of the mortgage servicing counterparty, the parent company of the mortgage loan servicer, or a subservicer, and the related purchase agreement could be rejected in such proceeding. Any of the foregoing events could materially adversely affect our business, financial condition and results of operations, and our ability to pay dividends to our stockholders.
The value of our MSR investments may vary substantially with changes in interest rates.
The values of our MSR investments are highly sensitive to changes in interest rates. The value of MSRs typically increases when interest rates rise and decreases when interest rates decline because of the effect those changes in interest rates have on
24
prepayment estimates. Changes in interest rates influence a variety of assumptions included in the valuation of MSRs, including prepayment speeds, assumed yields used to discount future cashflows, the value of float income earned on escrow balances and other servicing valuation elements. Subject to qualifying and maintaining our qualification as a REIT, we may pursue various hedging strategies to seek to reduce our exposure to adverse changes in interest rates.
Changes in prepayment rates could negatively affect the value of our investment portfolio, which could result in reduced earnings, losses, book value impairments and/or negatively affect the cash available for distribution to our stockholders.
There are seldom any restrictions on consumer borrowers’ abilities to prepay their residential mortgage loans. Homeowners tend to prepay mortgage loans faster when interest rates decline and not prepay when interest rates increase, resulting in loan owners having to reinvest the money received from prepayments at the lower prevailing rates or being unable to reinvest money that would have been received from prepayments at the higher prevailing interest rates, respectively. In addition, our Agency RMBS are protected from the risk of default on the underlying mortgages by guarantees from the U.S. Government or any GSEs such as Fannie Mae and Freddie Mac. Defaults on mortgage loans underlying Agency MBS typically have the same effect as prepayments because of the underlying Agency guarantee. Volatility in interest rates may increase the likelihood borrower’s may prepay the mortgage loans, and variability in prepayment rates may affect the earnings and value of our portfolio of residential mortgage loans, RMBS and MSRs, and may result in reduced earnings or losses, and negatively affect the cash available for distribution to our stockholders. In addition, if we purchased an investment at a premium, faster than expected prepayments would result in a faster than expected amortization of the premium paid, which would adversely affect our earnings. Conversely, if these investments were purchased at a discount, slower than expected prepayments would reduce our recognition of the discount, which would adversely affect our earnings.
A significant portion of our investment portfolio is secured by properties in a small number of geographic areas and may be disproportionately affected by economic or housing downturns, natural disasters, including natural disasters exacerbated by climate change, terrorist events, regulatory changes, or other adverse events specific to those markets.
A significant number of the mortgages underlying our Non-Agency RMBS and Loans held for investments are concentrated in certain geographic areas. For example, we have significant exposure in California, New York, Florida, Illinois, and Texas, among others. For further information on the geographic concentration of our investments see Note 3 and Note 4 to the consolidated financial statements within this 2025 Form 10-K. Any event that adversely affects the economy or real estate market (including business layoffs or downsizing, industry slowdowns, changing demographics, over or under building of housing, availability and cost of insurance, oversupply or reduced demand and other factors) in areas of high concentration could have a disproportionately adverse effect on our investments. In general, any material decline in the economy or significant problems in a particular real estate market would likely cause a decline in the value of residential properties securing the mortgages in that market, thereby increasing the risk of delinquency, default, and foreclosure of mortgage loans underlying our investments and the risk of loss upon liquidation of these assets. This could have a material adverse effect on our credit loss experience in the affected market if higher-than-expected rates of default or higher-than-expected loss severities on such loans were to occur.
In addition, the occurrence of a natural disaster or a terrorist attack may cause a sudden decrease in the value of real estate in the area or areas affected and would likely reduce the value of the properties securing the mortgages collateralizing our investments. Recent years have seen frequent and severe natural disasters in the U.S., including wildfires, hurricanes, high winds, hail, severe flooding and mudslides, the frequency and intensity of which may be indicative of the impact of climate change. The impacts of climate change, which may persist or worsen in the future, could have a more significant localized effect in the areas where our borrowers and real estate are concentrated, resulting in a disproportionate impact on us. Because certain natural disasters such as hurricanes or certain flooding are not typically covered by the standard hazard insurance policies maintained by borrowers, or the proceeds payable under any such policy are not sufficient to cover the related repairs, the affected borrowers may have to pay for any repairs themselves. Under these circumstances, borrowers may decide not to repair their property or may stop paying their mortgages. This would cause defaults and credit loss severities to increase. The availability and cost of property and hazard insurance has become increasingly uncertain as insurance carriers reduce coverage or withdraw from certain states, which may limit options for borrowers and would be homeowners and impair collateral protection. If borrowers are unable to obtain or afford adequate insurance, the value of our mortgage assets and the performance of the affected loans could deteriorate and adversely impact our financial results.
Changes in local laws and regulations, fiscal policies, property taxes and zoning ordinances in such states can also have a negative impact on property values, which could result in borrowers deciding to stop paying their mortgages. This circumstance could cause defaults and loss severities to increase, thereby adversely impacting our results of operations.
25
We may change our investment strategy or asset allocation or enter other operating businesses or financing plans without stockholder consent, which may result in riskier investments or subject us to new or increased regulatory risks and have an adverse effect on our business, results of operations and financial condition.
We may change our investment strategy or asset allocation or enter other operating businesses or financing plans at any time without the consent of our stockholders, which could result in our making investments that are different from, and possibly riskier than, the investments described in this 2025 Form 10-K. For example, we recently expanded our scope of business via the HomeXpress Acquisition. See “Risks Related to Our Recent Acquisition and Loan Origination and Acquisition Business” for further discussion.
A change in our investment strategy or financing plans could increase our exposure to interest rate and default risk and real estate market fluctuations. Furthermore, a change in our asset allocation could result in our making investments in asset categories different from those described in this 2025 Form 10-K. Additionally, we may enter other operating businesses that may or may not be closely related to our current business. These new assets or business operations may have new, different or increased risks than what we are currently exposed to, including potential unknown liabilities and disputes associated with these new assets or business operations that could lead to litigation, and we may not be able to manage these risks successfully. Additionally, when investing in new assets or businesses we could be exposed to the risk that those assets, or income generated by those assets or businesses, affects our ability to meet the requirements to maintain our qualification as a REIT or our exemption from registration under the 1940 Act. If we are not able to successfully manage the risks associated with new asset types or businesses, our business, results of operations and financial condition could be adversely affected.
Changes in the fair values of our assets, liabilities, and derivatives can have various negative effects on us, including reduced earnings, less liquidity, increased earnings volatility, and variability in our book value.
Fair values for our assets and liabilities, including derivatives, can be volatile and our revenue and income can be impacted by changes in fair values. Fair values can change rapidly and significantly, and changes can result from changes in interest rates, perceived risk, credit spreads, supply, demand, and actual and projected cash flows, prepayments, and credit performance. A decrease in fair value may not necessarily be the result of deterioration in future cash flows. Fair values for illiquid assets can be difficult to estimate, which could lead to volatility and uncertainty of earnings and book value. For GAAP purposes, we mark-to-market most, but not all, of the assets and liabilities on our Consolidated Statements of Financial Condition. In addition, valuation adjustments on certain consolidated assets and our derivatives are reflected in our Consolidated Statements of Operations. Assets that are funded with certain liabilities and hedges may have different mark-to-market treatment than the liability or hedge. If we sell an asset that has not been marked to market through our Consolidated Statements of Operations at a reduced market price relative to its cost basis, our reported earnings will be reduced. Our loan sale profit margins are generally reflective of gains (or losses) over the period from when we identify a loan for purchase until we subsequently sell or securitize the loan. These profit margins may encompass elements of positive or negative market valuation adjustments on loans, hedging gains or losses associated with related risk management activities, and any other related transaction expenses. However, under GAAP, the different elements may be realized unevenly over the course of one or more quarters for financial reporting purposes, with the result that our financial results may be more volatile and less reflective of the underlying economics of our business activity.
Our calculations of the fair value of the assets we own or consolidate are based upon assumptions that are inherently subjective and involve a high degree of management judgment, and such assumptions may be more difficult to calculate during times of severe market disruption in the mortgage, housing, rates or other financial market related sectors.
We report the fair values of securities, loans, derivatives, and certain other assets on our Consolidated Statements of Financial Condition. In computing the fair values for these assets, we may make several market-based assumptions, including assumptions regarding future interest rates, prepayment rates, discount rates, credit loss rates, and the timing of credit losses. These assumptions are inherently subjective and involve a high degree of management judgment, particularly for illiquid securities and other assets for which market prices are not readily determinable. These assumptions may be more difficult to calculate during times of severe market disruption in the mortgage, housing, rates or other financial market related sectors. For further information regarding our assets recorded at fair value see Note 6 to the consolidated financial statements within this 2025 Form 10-K. Use of different assumptions could materially affect our fair value calculations and our financial results and our actual experience may cause us to substantially revise our assumptions. Further discussion of the risk of our ownership and valuation of illiquid securities is set forth in the Risk Factors above and in this 2025 Form 10-K.
Any deterioration or uncertainty in broader U.S. and global economic conditions could materially adversely affect our business and financial condition.
Our results of operations are materially affected by conditions in the broader financial markets and the economy generally. Concerns over actual or anticipated low economic growth rates, higher levels of unemployment, a reduction in housing market
26
activity, inability of the U.S. government to address debt ceiling crises, increases in the supply of or decreases in demand for U.S. government issued securities, uncertainty over tariffs and potential international trade disputes, uncertainty regarding future U.S. monetary policy, potential prolonged shutdowns of the federal government, or geopolitical conflicts may contribute to increased financial market volatility and a decline in business volume. A reduction in our business volume can reduce our net interest income and adversely affect our financial results. Global economic conditions can also adversely affect our business and financial results. Changes or volatility in market conditions resulting from deterioration in or uncertainty regarding global economic conditions can adversely affect the value of our assets, which could materially adversely affect our results of operations, net worth and financial condition. To the extent global economic conditions negatively affect the U.S. economy, they also could negatively affect the credit performance of the loans in our investment portfolio. Volatility or uncertainty in global or domestic political conditions also can significantly affect economic conditions and financial markets. Global or domestic political unrest could adversely affect economic conditions and financial markets. Such events may contribute to heightened inflationary pressures, increased interest rates, market volatility, reduced liquidity, and disruptions in capital markets, any of which could negatively impact economic growth, the value of our investments, our access to financing, and our overall financial condition and results of operations.
Risks Related to Our Recent Acquisition and Loan Origination and Acquisition Business
We may fail to realize the expected benefits of the HomeXpress Acquisition.
We will be required to devote significant management attention and resources to the integration of HomeXpress’ business in order to realize the anticipated benefits and synergies of the HomeXpress Acquisition. The potential difficulties we may encounter in combining the companies include, but are not limited to, the following:
•the inability to successfully integrate HomeXpress businesses in a manner that permits us to achieve the anticipated benefits and synergies expected to result from the HomeXpress Acquisition in the timeframe currently anticipated or at all;
•the diversion of management’s attention from our ongoing business as a result of the devotion of time and resources to integration of the HomeXpress Acquisition;
•addressing possible differences in business backgrounds, corporate cultures and management philosophies;
•maintaining employee morale and attracting, motivating and retaining management personnel and other key employees;
•complying with an expanded regulatory framework, including the wide array of laws, rules and regulation, including federal and state consumer lending regulations, related to our loan origination and acquisition business;
•the possibility of faulty assumptions underlying expectations regarding the HomeXpress Acquisition;
•potential unknown liabilities and unforeseen increased expenses, delays or conditions associated with the HomeXpress Acquisition and HomeXpress’ operations;
•performance shortfalls as a result of the diversion of management’s attention caused by integrating HomeXpress’ operations;
•consolidating corporate and administrative infrastructures and eliminating duplicative operations;
•unanticipated issues and costs in integrating information technology, communications and other systems; and
•unanticipated changes in federal or state laws or regulations.
The operations acquired through the HomeXpress Acquisition are subject to certain of the same risks as our existing business. Due to the HomeXpress Acquisition, we are, however, subject to additional risks due to the heavily regulated nature of the mortgage industry and are required to comply with a wide array of laws, rules and regulations, including federal and state consumer lending regulations, that concern, among other things, the manner in which we conduct our loan origination and acquisition business, as well as other risks described in “Risks Related to Our Recent Acquisition and Loan Origination and Acquisition Business.”
It is possible that the integration process could take longer than anticipated or that the management of the combined organizations and achievement of anticipated benefits and synergies could be more difficult than expected. The integration of HomeXpress into Chimera could also result in the disruption of ongoing businesses, processes, systems and business relationships or inconsistencies in standards, controls, procedures, practices, policies and compensation arrangements, any of which could adversely affect our ability to achieve the anticipated benefits of the HomeXpress Acquisition. The integration process is subject to a number of risks and uncertainties, and no assurance can be given that the anticipated benefits of the HomeXpress Acquisition will be realized or, if realized, the timing of its realization. Failure to achieve these anticipated benefits could adversely affect our business, financial condition and results of operations.
27
Our loan origination and acquisition volume and ability to sell loans are highly dependent on macroeconomic and U.S. residential real estate market conditions which are outside of our control, and which may impact our ability to originate or acquire quality and profitable loans at an appropriate and consistent cost.
As a result of the HomeXpress Acquisition, we originate and sell consumer Non-QM and investor business purpose mortgage loans secured primarily by residential real estate properties with up to eight units, which are substantially all Non-QM loans sourced primarily on a wholesale basis through independent mortgage brokers and bankers. We also have a non-delegated correspondent channel, and may expand to include a delegated correspondent channel, in which we acquire and sell the same type of mortgage loans which are originated by correspondent lenders, with whom we partner. We refer to our network of independent mortgage brokers and correspondent lenders collectively as our “HomeXpress clients.” The HomeXpress business has been, and may continue to be, affected by a number of factors that are beyond our control, including the health of the U.S. residential real estate industry, changes in general economic and capital market conditions, including increases and decreases in interest rates, inflation, credit spreads, competition from competitors who may have greater financial and other resources than we have (including access to capital), changes in the costs to originate our loans, and the ability of borrowers to buy homes and make mortgage payments. In addition, the consumer Non-QM and investor business purpose mortgage loan market is highly sensitive to interest-rate volatility, securitization execution, and investor demand, and disruptions in these markets may limit our ability to sell or finance loans on acceptable terms and such conditions could reduce origination volumes, compress margins, or require us to retain assets longer than anticipated. The majority of the properties securing HomeXpress’ loans that are originated and held for sale are located in California, Florida, and Texas, and conditions in these regions’ real estate markets could have an outsized negative impact on the HomeXpress business.
Our consumer Non-QM loans are designed for borrowers who do not meet traditional qualified mortgage standards and documentation requirements and typically carry higher interest rates than traditional qualified mortgages. The business purpose loans that we originate are for investors in 1-to-8-unit investment rental properties and rely on the income from the property to service the debt. Loans made to borrowers who are self-employed borrowers or have a credit profile that does not meet qualified mortgage standards or are based on rental properties and their debt service coverage typically have a higher risk of default. Our underwriting guidelines strive to account for these characteristics, but our risk management and procedures may not be effective in assessing the likelihood of default and identifying potential valuation issues.
A disruption in the secondary home loan market, our ability to sell the loans that we originate or acquire, or loan compliance issues could have a negative effect on our business.
Our subsidiary, HomeXpress, sells mortgage loans to a variety of aggregators, insurance companies, banks, and other institutional investors who either hold such loans for investment or securitize such loans, which we currently sell on a servicing-released basis. Demand in the secondary market for the purchase of such loans and our ability to sell the mortgage loans that we originate or acquire depend on many factors that are beyond our control, including general economic conditions, the willingness of investors to provide funding for and to purchase mortgage loans, and changes in regulatory requirements. The gain recognized from sales represents a significant portion of HomeXpress’ revenues and earnings. If it is not possible or economical for us to continue selling mortgages to such investors or other loan purchasers, our business could be materially and adversely affected. Similarly, if we choose to retain a portion of HomeXpress’ loan originations in lieu of selling to investors, we may forgo current gain-on-sale earnings in favor of longer-term investment income, which could materially alter the timing of our earnings and adversely impact our financial condition.
Furthermore, non-GSE sales typically take longer to execute which can increase the amount of time that a mortgage loan is held by us, exposing us to additional market and interest rate risk, including prepayment risk where a mortgage loan has no prepayment penalty or such penalty is waived, and increased liquidity requirements.
Additionally, if a mortgage loan does not comply with the representations and warranties that we made with respect to it at the time of our sale, we may be required to either repurchase the loan with the identified defects or indemnify the investor or insurer for any loss. In addition, we may be required to repay all, or a portion of, the premium initially paid by an investor in the case of an early loan payoff or early default on certain loans. We may also be required to repurchase loans as a result of borrower fraud or if a payment default occurs on a loan shortly after its sale. Actual repurchase, premium recapture and indemnification obligations could materially exceed the reserves recorded in our consolidated financial statements. Any significant repurchases, premium recapture, or indemnifications could be detrimental to our business.
Our subsidiary, HomeXpress, relies on warehouse facilities, structured as repurchase agreements, to finance its loan originations and acquisitions. These facilities are short-term and subject us to various risks different from other types of credit facilities.
We fund substantially all of the mortgage loans we originate or acquire from our HomeXpress clients under HomeXpress’ short-term warehouse facilities and funds generated by HomeXpress’ operations. These borrowings are in turn generally repaid
28
with the proceeds we receive from mortgage loan sales. We depend upon several financial institutions to provide the warehouse lines of credit for these loans. Our ability to fund loan originations may be impacted by the ability of HomeXpress to secure further such borrowings on acceptable terms and the ability of our counterparties to continue to provide financing. HomeXpress’ warehouse facilities are uncommitted and can generally be terminated by the applicable lender at any time. In addition, these warehouse facilities contain restrictions, covenants and conditions that require HomeXpress to satisfy, among other things, specified financial and loan eligibility tests. The failure to satisfy such conditions could result in such warehouse facility being made unavailable to us, an event of default or other negative consequences. In the event that a significant number of these loan funding facilities become unavailable or are terminated or are not renewed, or if the aggregate principal amount that may be drawn under our funding agreements were to decrease significantly, we may be unable to find replacement financing on commercially favorable terms, or at all. Our liquidity with respect to the HomeXpress entity may be further constrained as there may be less demand from investors to acquire our mortgage loans in the secondary market. Further, if we are unable to refinance or obtain additional liquidity for borrowing, our ability to maintain or grow our loan origination business could be limited. If the refinancing or borrowing guidelines under these facilities become more stringent and those changes result in increased costs to comply or decreased origination volume, those changes could be detrimental to our liquidity and business operations.
Our business is dependent on our ability to maintain and expand our relationships with our clients, the independent mortgage brokers and bankers.
Our clients are independent mortgage brokers and bankers who refer or sell us mortgage loans to originate or fund. Consequently, our results of operations are dependent, in large part, on our ability to maintain and expand our relationships with these clients. If we are unable to attract these clients to join our network and to provide a level of service such that our clients remain with the network or refer or sell a greater number of their mortgage loans to us, our ability to originate loans will be significantly impaired. The willingness of independent mortgage brokers and bankers to originate mortgage loans with us is dependent on (i) the rates that we are able to offer our clients’ borrowers for mortgage loans, (ii) our customer service, (iii) products and (iv) compensation. In determining with whom to partner, our clients are also focused on the technological services and platforms we can provide so that they can best attract and serve their customers. If our clients are dissatisfied with our services or our platform or technological capabilities, or if they cannot offer prospective borrowers competitive products and rates, we could lose a number of clients, which would have a negative impact on our business, operating results and financial condition.
Our mortgage loans are primarily initiated by third parties, which exposes us to business, competitive and underwriting risks.
We market, originate and, acquire mortgage loans primarily through independent third parties, comprised of independent mortgage brokers and bankers. While we believe using independent mortgage brokers and bankers best serves mortgage loan consumers, our reliance on third parties presents risks and challenges, including the following:
•Our business depends in large part on the marketing efforts of our clients and on our ability to offer loan products and services that meet the requirements of our clients and their borrowers. However, loan officers are not obligated to sell or promote our products and many sell or promote competitors’ loan products in addition to our products. Some of our competitors may have higher financial strength ratings, may offer a larger variety of products, and/or may offer higher incentives than we do. Therefore, we may not be able to continue to attract and retain clients to source loans for us. The failure or inability of our clients to successfully market our mortgage products to prospective borrowers could, in turn, have a material adverse impact on our business, financial condition and results of operations.
•Communication with prospective borrowers is made through loan officers employed by third parties. Consequently, we rely on our clients and their loan officers to provide us with accurate information on behalf of borrowers, including financial statements and other financial information, for us to use in deciding whether to approve loans. While we have procedures in place to independently verify certain borrower information that we use in our lending decisions, if any of this information is intentionally or negligently misrepresented and such misrepresentation is not detected prior to loan funding, the fair value of the loan may be significantly lower than expected. Whether a misrepresentation is made by the borrower, the loan officer or one of our team members, we generally bear the risk of loss associated with the misrepresentation and may be exposed to repurchase obligations or regulatory violations. Our controls and processes may not detect or may not have detected all misrepresented information in our loan originations. Likewise, our clients may also lack sufficient controls and processes. Any such misrepresented information could have a material adverse effect on our business and results of operations.
•Wholesale mortgage lending presents some unique reputational and brand recognition risks. We attempt to provide high quality and transparent service to our clients so that our clients and prospective clients have confidence in our
29
ability to deliver our services in a timely and effective manner. To maintain good client relations, we attempt to do business with mortgage brokers and bankers that have a good reputation. Clients are monitored and those with excessive borrower complaints or misrepresented information are generally terminated. Our reputation and brand may suffer if we lose our clients’ confidence, which could have a material adverse impact on our results of operations and profitability.
•Growth in our market share is principally dependent on growth in the market share controlled by us within the wholesale and correspondent channels. Continued advancements or the perception of efficiency in “direct-to-the-consumer” distribution models may impact the overall market share controlled by our clients and make it more difficult for us to grow or require us to establish new, or modify existing, client relationships.
The conduct of the independent mortgage brokers and bankers through whom we originate mortgage loans could subject us to fines or other penalties.
We depend primarily on independent mortgage brokers and bankers for our loan originations and acquisitions. These clients are subject to parallel and separate legal obligations. While these laws may not explicitly hold the originating lenders responsible for the legal violations of such entities, U.S. federal and state agencies increasingly have sought to impose such liability. For example, the U.S. Department of Justice (“DOJ”), through its use of a disparate impact theory under the Fair Housing Act, has held originating lenders responsible for the pricing practices of third parties, alleging that the lender is directly responsible for the total fees and charges paid by the borrower even if the lender neither dictated what the third party could charge nor kept the money for its own account. In the past few years, there were a number of actions brought by the DOJ and other federal and state agencies under the Equal Credit Opportunity Act that allege that lenders have engaged in “redlining” by engaging in acts or practices directed at discouraging potential loan applicants from seeking financing. Even though we do not market directly to consumers, the failure or inability of our clients and their loan officers to attract certain classes of borrowers could result in actions being brought against us. In addition, under the TILA-RESPA Integrated Disclosure rule, we may be held responsible for improper disclosures made to borrowers by our clients. While the current presidential administration has suggested that these types of claims will not be pursued by the DOJ or federal agencies to the same degree, there is no assurance that state or private parties will not pursue similar claims. While we seek to use technology, and other means to monitor whether these clients and their loan officers are complying with their obligations, our ability to enforce such compliance is extremely limited. Consequently, we may be subject to claims for fines or other penalties based upon the conduct of our clients and their loan officers with whom we do business, which could have a material effect on our operating results and financial condition.
The mortgage lending industry can be very cyclical, with loan origination volumes varying materially based on macroeconomic conditions. If we are unable to effectively manage our team members during periods of volatility, it could adversely affect our current business operations and our growth.
The mortgage lending industry can be very cyclical, with loan origination volumes varying materially based largely on macroeconomic conditions. Our ability to effectively manage the volatility from significant increases and decreases in loan origination and acquisition volume will depend on our ability to hire, integrate, train and retain highly qualified personnel for all areas of our organization during these periods of changing volume. Any talent acquisition and retention challenges or mismanagement of our personnel needs in these situations could reduce our operating efficiency, increase our costs of operations and harm our overall financial condition. As the pool of qualified candidates has continued to be limited and there continues to be significant competition for talent, we may face challenges in hiring and retaining such highly qualified personnel in changing environments. Additionally, we invest heavily in training our team members, which increases their value to competitors who may seek to recruit them. If we do not effectively manage our pool of team members in times of volatility, it could disrupt our business operations and have a negative impact on our long-term growth.
We operate in a heavily regulated industry, and our mortgage loan origination activities as a result of our acquisition of HomeXpress, exposes us to risks of noncompliance with an increasing and inconsistent body of complex laws and regulations, including federal and state consumer lending regulations.
Due to the heavily regulated nature of the mortgage industry, we and our HomeXpress clients are required to comply with a wide array of laws, rules and regulations, including federal and state consumer lending regulations, that concern, among other things, the manner in which we conduct our loan origination and acquisition business and the fees that we may charge, and the collection, use, retention, protection, disclosure, transfer and processing of personal information by us and our clients. Governmental authorities and various U.S. federal and state agencies, including the CFPB, have broad oversight and supervisory authority over our HomeXpress business.
Because we originate and acquire mortgage loans in 46 states and the District of Columbia, we must be licensed in all relevant jurisdictions that require licensure for the type of mortgages we originate or acquire, and we are required to comply with each such jurisdiction’s respective laws and regulations, as well as with judicial and administrative decisions applicable to us. Such
30
licensing requirements also generally require the submission of information regarding any person who has 10% or more of the combined voting power of our outstanding equity interests. In addition, we and our clients are currently subject to a variety of, and may in the future become subject to additional, U.S. federal, state and local laws that are continuously evolving and developing.
We expect more states to enact legislation similar to the California Consumer Privacy Act and California Privacy Rights Act, which increase the privacy and security obligations of entities handling certain personal information of such consumers and could require us to provide consumers with privacy rights, such as the right to request deletion of their data, the right to receive data on record for them and the right to know what categories of data (generally) are maintained about them. These regulations directly impact our business and require ongoing compliance, monitoring and internal and external compliance audits as they continue to evolve and may result in ever-increasing public scrutiny with escalating levels of enforcement and sanctions. Subsequent changes to data protection and privacy laws could also impact how we process personal information and therefore limit the effectiveness of our products or services or our ability to operate or expand our business, including limiting strategic partnerships that may involve the sharing of personal information. Additionally, the interpretation of such data protection and privacy laws is rapidly evolving, making implementation and enforcement, and thus compliance requirements, ambiguous, uncertain, and potentially inconsistent. Although we make reasonable efforts to comply with all applicable data protection laws and regulations, our interpretations and such measures may have been or may prove to be insufficient or incorrect.
We and our HomeXpress clients must also comply with a number of federal, state and local consumer financial services, laws and regulations including, among others, the TILA, the Real Estate Settlement Procedures Act, the Equal Credit Opportunity Act, the Fair Credit Reporting Act, the Fair Housing Act, the Telephone Consumer Protection Act, the Gramm-Leach-Bliley Act, the Servicemembers Civil Relief Act, the Homeowners Protection Act, the Home Mortgage Disclosure Act, the SAFE Act, the Federal Trade Commission Act, the TILA-RESPA Integrated Disclosure rule rules, the Dodd-Frank Act, the Appraisal Independence Rule, the Bank Secrecy Act, U.S. federal and state laws prohibiting unfair, deceptive, or abusive acts or practices, and state foreclosure laws. These laws and regulations mandate certain disclosures and notices to borrowers and apply to loan origination, home appraisal, marketing, use of credit reports, safeguarding of non-public, personally identifiable information about borrowers, foreclosure and claims handling, investment of and interest payments on escrow balances and escrow payment features. The Appraisal Independence Rule requires that there be a separation of duties to ensure no conflicts of interest. While we believe that our programs meet all of the regulatory and legal requirements, there is a risk that a regulatory agency could decide that our programs do not meet all of the regulatory and legal requirements, or that our programs will not be accepted by other market participants, which could expose us to additional liability, or subject us to repurchase obligations.
Our Non-QM loans have more flexibility in underwriting guidelines than traditional qualified mortgage loan standards and are subject to increased credit risk compared to QM loans. These loans are also subject to relatively more litigation potential due to the subjectivity of the regulations and because they do not benefit from compliance with safe harbors. The underwriting guidelines for our Non-QM loans may be more permissive as to the borrower’s debt to income ratio, credit history, and/or income documentation than QM loans. Loans that are underwritten pursuant to less stringent underwriting guidelines could experience substantially higher rates of delinquencies, defaults and foreclosures than those experienced by loans underwritten to more stringent underwriting guidelines. If our Non-QM loans are underwritten to more flexible guidelines which have increased risk and may cause higher delinquency, default, or foreclosure rates given economic stress, the performance of the Non-QM loans we originate or acquire for resale could be correspondingly adversely affected, which could materially and adversely affect us.
Various federal, state and local laws have been enacted that are designed to discourage predatory lending practices. The Home Ownership and Equity Protection Act of 1994 (“HOEPA”) prohibits inclusion of certain provisions in consumer-purpose residential loans that have mortgage rates or origination costs in excess of prescribed levels and requires that borrowers be given certain disclosures prior to origination. Some states have enacted, or may enact, similar laws or regulations, which in some cases impose restrictions and requirements greater than those in HOEPA. In addition, under the anti-predatory lending laws of some states, the origination of certain residential loans, including loans that are not classified as “high cost” loans under applicable law, must satisfy a net tangible benefits test with respect to the related borrower. This test may be highly subjective and open to interpretation. As a result, a court may determine that a residential loan, for example, does not meet the test even if the related originator reasonably believed that the test was satisfied. Our failure to comply with these laws, or the failure of residential loan originators to comply with these laws, to the extent any of their residential loans are or become part of our mortgage-related assets, could subject us, as an originator, or, in the case of acquired loans, as an assignee or purchaser, to monetary penalties and could result in the borrowers rescinding the affected loans. Lawsuits have been brought in various states making claims against originators, assignees and purchasers of high-cost loans for violations of state law. Named defendants in these cases have included numerous participants within the secondary mortgage market. If our loans are found to have been originated in violation of predatory or abusive lending laws, we could be subject to lawsuits or governmental actions, and we could be fined or incur losses.
Both the scope of the laws, rules and regulations and the intensity of the regulatory oversight to which our business is subject has increased over time. In the past years, regulatory enforcement and fines have become more significant across the financial
31
services sector. For example, various federal regulatory agencies and departments, including the DOJ and CFPB, have historically taken the position that antidiscrimination statutes, such as the Fair Housing Act and the ECOA, that prohibit creditors from discriminating against loan applicants and borrowers based on certain characteristics, such as race, ethnicity, sex, religion and national origin apply not only to intentional discrimination, but also to neutral practices that have a disparate impact on a group that shares a characteristic that a creditor may not consider in making credit decisions (i.e., creditor practices that have a disproportionate negative effect on a protected class of individuals). While there is a perception that the enforcement agenda of the federal regulatory agencies may be curtailed under the current presidential administration, state regulators may fill the gap, and it is not clear the scope of such future limitations or the timing for implementation. Furthermore, it is not clear what effect those changes will have, or whether as a result of lesser oversight by the federal authorities, states will increase their regulatory oversight. Moreover, subsequent changes in various government administrations may result in yet other changes in regulatory oversight and enforcement. As these U.S. federal, state and local laws evolve, it may be more difficult for us to identify these developments comprehensively, to interpret changes accurately and to train our team members effectively with respect to these laws and regulations. These difficulties potentially increase our exposure to the risks of noncompliance with these laws and regulations, including loss of our licenses and approvals to engage in our lending businesses, costs associated with defending ourselves from investigations and enforcement actions or resulting administrative fines and penalties and civil and criminal liability, including class action lawsuits, which could be detrimental to our business.
The laws and regulations applicable to us are subject to administrative or judicial interpretation. Furthermore, state and federal agencies may differ in their interpretations as may private plaintiffs. Litigation amongst these various agencies and between private plaintiffs, including participants in the mortgage industry, and these agencies have added complexity and ambiguity in interpreting these regulations. Ambiguities in applicable laws and regulations may leave uncertainty with respect to permitted or restricted conduct and may make compliance with laws, and risk assessment decisions with respect to compliance with laws difficult, uncertain and costly. The adoption by industry participants of different interpretations of these statutes and regulations has added uncertainty and complexity to compliance and may result in them having a short- or long-term competitive advantage. If we are deemed to have violated applicable statutes or regulations, it could result in regulatory investigations, state or federal governmental actions or private civil claims, including class actions, being brought against us. Such litigation would cause us to incur costs, fines and legal expenses in connection with these matters, regardless of any eventual ruling in our favor, and could also harm the reputation of our brand, any of which could have a material adverse effect on our business, financial condition or results of operations.
To resolve issues raised in examinations or other governmental actions, we may be required to take various corrective actions, including changing certain business practices, making refunds and/or taking other actions that could be financially or competitively detrimental to us. We expect to continue to incur costs to comply with governmental regulations. In addition, certain legislative actions and judicial decisions can give rise to the initiation of lawsuits against us for activities we conducted in the past. Furthermore, provisions in our mortgage loan documentation, including but not limited to the mortgage and promissory notes we use in loan originations, could be construed as unenforceable by a court.
Although we have compliance management systems and procedures to comply with these legal and regulatory requirements, we cannot be assured that more restrictive laws and regulations will not be adopted in the future, or that governmental bodies or courts will not interpret existing laws or regulations in a more restrictive manner, which could render our current business practices non-compliant or which could make compliance more difficult or expensive. Any of these, or other, changes in laws or regulations could have a detrimental effect on our business.
Risks Related to Our Investment Management and Advisory Services
Our investment management and advisory services involve certain risks, which could adversely affect our business, financial condition and results of operations.
On December 2, 2024, we acquired TPG, PAS, Palisades Technology Holdings, LLC, and their respective subsidiaries (the “Palisades Acquisition”). As a result of the Palisades Acquisition, we began providing investment management and advisory services primarily through TPG and PAS (together with TPG, “Palisades”). TPG is registered with the SEC as an investment adviser under the Advisers Act, and PAS is a relying adviser with respect to TPG’s investment adviser registration.
Our investment management and advisory services are provided on a discretionary basis through investment funds that we manage and on a non-discretionary basis with respect to assets acquired and owned by third-party institutions, including insurance companies, credit funds, and other institutional investors. We do not own an interest in the Discretionary Funds other than any capital commitment that we may make in the future on a direct or indirect basis, including through co-investments. The Company did not acquire the general partners of the existing Discretionary Funds, for which the investment period has ended, as part of the Palisades Acquisition. Our subsidiary, however, is the non-member manager of the general partners of the existing Discretionary Funds and serves as the investment manager of the existing Discretionary Funds. Accordingly, we have certain obligations and responsibilities with respect to the existing Discretionary Funds and other third-party clients of our non-discretionary investment management and advisory services. In the future, we may form and manage new Discretionary Funds
32
for which we may act as the general partner and investment manager. Accordingly, our role as investment manager and advisor is subject to certain risks including, but not limited to:
•the possibility that investors in a Discretionary Fund or a managed account might become bankrupt or otherwise be unable to meet their capital commitment obligations;
•to the extent we were to become a general partner or limited partner in a new Discretionary Fund, the possibility that operating and/or management agreements applicable to such Discretionary Fund or a managed account may restrict our ability to transfer or liquidate our interest when we desire or on advantageous terms;
•that our relationships with clients of our non-discretionary investment management and advisory services are concentrated with certain clients and are generally contractual in nature and may be terminated (with or without cause) under the terms of the applicable agreements;
•that our role as investment manager and advisor of a Discretionary Fund or a managed account is generally contractual in nature and may be terminated or dissolved under the terms of the applicable agreements, or we may be removed as the non-member manager of the general partner of the existing Discretionary Funds;
•that our role as the general partner of any new Discretionary Fund is generally contractual in nature, and we may be removed as the general partner of any new Discretionary Fund under the terms of the applicable agreements;
•that we may fail to manage conflicts of interests among the general partner and limited partners of Discretionary Funds, and their respective principals, officers, employees, members and affiliates, as well as any conflicts of interests involving our business outside of the Discretionary Funds or managed accounts;
•that disputes between us and the investors in a Discretionary Fund or a managed account may result in litigation or arbitration that would increase our expenses and prevent our officers and directors from focusing their time and effort on our business and result in subjecting the investments owned by such Discretionary Fund or managed account to additional risk;
•that by reason of being the general partner for new Discretionary Funds, non-member manager of the general partner for existing Discretionary Funds, or investment manager, we will be required to make various decisions and perform various tasks, including preparing disclosures, tax filings and financial reports, that could expose us to liability, including for claimed breaches of fiduciary duties;
•that difficult market conditions could adversely affect a Discretionary Fund in many ways, including by negatively impacting its performance and reducing the ability of new Discretionary Funds to raise or deploy capital, thereby reducing assets under management and lowering management fee income and incentive-based income;
•that SEC examination of one or more of our subsidiaries currently required to be registered as an investment adviser or relying adviser may uncover deficiencies and potentially subject us to enforcement proceedings and sanctions for violations, including censure or termination of SEC registration, litigation and reputational harm; and
•that our business and financial condition may be materially adversely impacted by the loss of any of our key executives or other investment professionals.
Many of these factors are outside of our control and any one of them could adversely affect our business, financial condition and results of operations. Any incentive-based income that we may be entitled to with respect to future Discretionary Funds may be affected by changes in the market value of securities held in client accounts due to fluctuations in the securities markets and is highly variable. Such income may also be delayed due to the nature of a fund’s investment cycle.
Under the Advisers Act, the investment advisory contracts entered into by our investment adviser subsidiary may not be assigned without the client’s consent. A deemed “change of control” of our company could require us to obtain the consent of our clients, and a failure to do so properly could adversely affect our operations, financial conditions or business.
Our registered investment adviser and relying adviser subsidiaries are regulated and subject to examination by the SEC. The Advisers Act imposes numerous obligations, on registered investment advisers, including fiduciary duties, disclosure obligations recordkeeping and reporting requirements, marketing restrictions and general anti-fraud prohibitions. The failure to comply with the Advisers Act and other securities laws and regulations could cause the SEC to institute proceedings and impose sanctions for violations, including censure or terminating our registered investment adviser’s SEC registration, and could also result in litigation or reputational harm.
Our failure to appropriately manage or address conflicts of interest could damage our reputation and adversely affect our business, financial condition and results of operations.
33
As we expand the number of funds and scope of our business, we may confront potential conflicts of interest relating to our investment activities and the Discretionary Funds’ investment activities. With respect to each of the existing Discretionary Funds, the investment period has ended, and investments made on behalf of any future Discretionary Funds will be subject to a comprehensive policy regarding the allocation of investment opportunities between such future Discretionary Funds and our own account. Nevertheless, Discretionary Funds could have overlapping investment objectives, and such investment objectives could additionally overlap with our own investment objectives. Potential conflicts may arise with respect to our decisions regarding how to allocate investment opportunities among us and the Discretionary Funds. For example, we may allocate an investment opportunity that is appropriate for two or more Discretionary Funds in a manner that excludes one or more Discretionary Funds or results in a disproportionate allocation based on factors or criteria that we determine, such as sourcing of the transaction, the specific nature of the investment or size and type of the investment, amount of capital available to invest in a related investment by a fund, among other factors. The Discretionary Fund investors and our public stockholders may perceive conflicts of interest regarding investment decisions and will have very limited ability to challenge those decisions.
In addition, the challenge of allocating investment opportunities to certain Discretionary Funds may be exacerbated if we expand our business to include more lines of business. Allocating investment opportunities appropriately frequently involves significant and subjective judgments. In addition, the perception of noncompliance with such requirements or policies could harm our reputation with Fund investors and our public stockholders.
In the event we were to acquire new businesses or service providers, these newly acquired affiliates could become service providers or counterparties to the Discretionary Funds and receive fees or other compensation for services that are not shared with the Discretionary Fund investors. In such instances, we may be incentivized to cause the Discretionary Funds or portfolio companies to purchase such services from our affiliates rather than an unaffiliated service provider despite the fact that a third-party service provider could potentially provide higher quality services or offer them at a lower cost.
It is possible that actual, potential or perceived conflicts could give rise to investor dissatisfaction or litigation or regulatory enforcement actions. While we believe we have appropriate policies and procedures in place to manage conflicts of interest, this process is complex and difficult and our reputation could be damaged if we fail, or appear to fail, to deal appropriately with one or more potential or actual conflicts of interest. Regulatory scrutiny of, or litigation in connection with, conflicts of interest would have a material adverse effect on our reputation, which would materially adversely affect our business, financial condition or results of operations in a number of ways, including an inability to raise additional Discretionary Funds and a reluctance of counterparties to do business with us.
Two of our subsidiaries are currently required to be registered as an investment adviser or a relying adviser, subjecting us to extensive regulation and examination by the SEC that could adversely affect our ability to manage our business.
While Chimera Investment Corporation is currently not registered as an investment adviser under the Advisers Act, two of our subsidiaries are currently required to be registered as an investment adviser or relying adviser, and other subsidiaries may be required to register as such in the future. As a result, we and/or our subsidiaries are subject to extensive regulation which could adversely affect our ability to manage our business. Investment advisers are subject to various requirements under the Advisers Act such as fiduciary duties to clients, anti-fraud provisions, substantive prohibitions and requirements, contractual and record-keeping requirements and administrative oversight by the SEC (primarily by inspection). In addition, investment advisers must continually address potential conflicts between their interests and those of clients. Although we have established certain policies and procedures designed to mitigate conflicts of interest, there can be no assurance that these policies and procedures will be effective in doing so. It is possible that actual, potential or perceived conflicts of interest could give rise to investor dissatisfaction, litigation or regulatory enforcement actions. If we are deemed to be out of compliance with any such rules and regulations, we may be subject to civil liability, criminal liability and/or regulatory sanctions.
Our asset management and advisory services business has significant client concentration, with a limited number of clients accounting for a significant portion of fees. Failure to attract, grow, and retain a diverse and balanced client base could adversely affect our asset management and advisory services business.
Our asset management and advisory services business has a limited number of clients that account for a substantial portion of its fees. Revenues from these clients may fluctuate from time to time based on these clients’ business needs and client experience, the timing of which may be affected by market conditions or other factors outside of our control. Competitive pressures may also cause us to reduce the prices we charge, which could have an adverse effect on our margins and financial position and could negatively affect our revenues. If any of our large clients terminates its relationship with us or materially reduces the services they acquire from us, such termination or reduction could materially reduce the revenues we derive from our asset management and advisory services business. Because our operating costs may not decline proportionately with any such reductions, any client redemption or mandate termination could negatively impact our profitability.
34
Our ability to attract, grow, and retain a diverse and balanced client base may affect our ability to grow our revenues. Our ability to attract clients depends on a variety of factors, including our service offerings. If we are unable to expand or improve our service offerings, we may fail to develop, grow, and retain a diverse and balanced client base, which could adversely affect our asset management and advisory services business and the revenues derived therefrom.
Risks Related to Hedging
Hedging interest rate exposure may not be successful in mitigating the risks associated with interest rates and may reduce our cash available for distribution to our stockholders and adversely affect our financial condition and result of operations.
Subject to maintaining our qualification as a REIT, we use various hedging strategies to reduce our exposure to losses from rising interest rates in the current market. Hedging activity varies in scope based on the level and volatility of interest rates, the type of assets held, financing used, and other changing market conditions. There are no perfect hedging strategies, and interest rate hedging may fail to protect us from loss. Alternatively, we may fail to properly assess a risk to our investment portfolio or may fail to recognize a risk entirely, leaving us exposed to losses without the benefit of any offsetting hedging activities. The derivative financial instruments we may use, including interest rate caps, options, futures, and swap futures, to hedge our interest rate exposure, may not fully protect us from adverse market movements and could expose us to additional risks such as basis risk, margin calls, and liquidity constraints. Our hedging instruments can be traded on an exchange, or administered through a clearing house or under bilateral agreements between us and a counterparty. Bilateral agreements expose us to increased counterparty risk, and we may be at risk of losing any collateral held by a hedging counterparty if the counterparty becomes insolvent or files for bankruptcy.
The nature and timing of hedging transactions may influence the effectiveness of these strategies. Poorly designed strategies or improperly executed transactions could also increase our risk and losses. Our hedging strategies rely on models, assumptions, and historical correlations that may prove inaccurate, particularly in periods of market disruption. If these relationships break down or our models fail to capture relevant risk drivers, our hedges may underperform and result in financial losses. In addition, our hedging activities could result in losses if the anticipated market movements do not occur or if the hedging instruments do not effectively match the duration, timing, or other characteristics of the related assets or liabilities, or otherwise fail to correlate as intended with the risks being hedged. Regulatory changes that alter margin or clearing requirements could increase our costs and limit our hedging flexibility. Lastly, the amount of income that we may earn from hedging transactions to offset interest rate losses may be limited by U.S. federal tax provisions governing REITs.
The hedging transactions we undertake, which are intended to limit losses, may limit gains and increase our exposure to losses. Thus, if our hedging strategies fail or market conditions change unexpectedly, it may result in a reduction of our cash available for distribution and we could incur losses that adversely affect our financial condition and results of operations.
We may enter into hedging instruments that could expose us to contingent liabilities in the future, which could materially adversely affect our results of operations.
Subject to maintaining our qualification as a REIT, part of our financing strategy involves entering into hedging instruments that could require us to fund cash payments in certain circumstances (e.g., the early termination of a hedging instrument caused by an event of default or other voluntary or involuntary termination event or the decision by a hedging counterparty to request the posting of collateral that it is contractually owed under the terms of a hedging instrument). With respect to the termination of an existing derivative or hedge instrument, the amount due would generally be equal to the unrealized loss of the open position with the hedging counterparty and could also include other fees and charges. These economic losses will be reflected in our financial results of operations and our ability to fund these obligations will depend on the liquidity of our assets and access to capital at the time. Any losses we incur on our hedging instruments could materially adversely affect our earnings and thus our cash available for distribution to our stockholders.
The characteristics of hedging instruments present various concerns, including illiquidity, enforceability, and counterparty risks, which could adversely affect our business and results of operations.
As indicated above, from time to time we enter into various forms of hedge instruments. Entities entering into derivatives are exposed to credit losses in the event of non-performance by counterparties to these transactions. Rules issued by the Commodity Futures Trading Commission (the “CFTC”) that became effective in October 2012 require, with limited exceptions, the clearing of all standardized swap transactions through registered derivatives clearing organizations, or swap execution facilities, through standardized documents under which each swap counterparty transfers its position to another entity whereby the centralized clearinghouse effectively becomes the counterparty to each side of the swap. In addition to greater initial and
35
periodic margin (collateral) requirements and additional transaction fees both by the swap execution facility and the clearinghouse, the swap transactions are now subjected to greater regulation by both the CFTC and the SEC. In response to events having or expected to have adverse economic consequences or which create market uncertainty, clearing facilities or exchanges upon which some of our hedging instruments (i.e., interest rate swaps) are traded may also require us to post additional collateral against our hedging instruments. These additional fees, costs, margin requirements, documentation requirements, and regulations could adversely affect our business and results of operations.
Risks Associated with Our Operations
Through certain of our wholly owned subsidiaries, we have engaged in the past, and expect to continue to engage in, securitization transactions relating to residential mortgage loans. These types of transactions and investments expose us to potentially material risks.
A significant part of our business and growth strategy is to engage in various securitization transactions related to mortgage assets, and such transactions expose us to potentially material risks, including without limitation:
•Financing at Unfavorable Terms Risk: Engaging in securitization transactions and other similar transactions generally require us to incur short-term debt on a recourse basis to finance the accumulation of residential mortgage loans. If investor demand for securitization transactions weakens sufficiently, we may be unable to complete the securitization of loans accumulated for that purpose on favorable terms, or at all, which may hurt our business or financial results. We have a limited capacity to hold loans on our balance sheet as investments, and many of our financings are not structured as buy-and-hold facilities. If demand for securitized securities weakens, we may be forced to incur additional debt on unfavorable terms or may be unable to borrow to finance these assets, which may in turn impact our ability to continue acquiring loans over the short or long term.
•Diligence Risk: We engage in due diligence with respect to the loans or other assets we are securitizing and make representations and warranties relating to those loans and assets. When conducting due diligence, we rely on resources and data available to us and on a review of the collateral by third parties, each of which may be limited. We may also only conduct due diligence on a sample of a pool of loans or assets we are acquiring and assume that the sample is representative of the entire pool. Our due diligence efforts may not reveal matters which could lead to losses. If our due diligence process is not robust enough, or the scope of our due diligence is limited, we may incur losses. Losses could occur because a counterparty that sold us a loan or other asset refuses or is unable (e.g., due to its financial condition) to repurchase that loan or asset or pay damages to us if we determine after purchase that one or more of the representations or warranties made to us was inaccurate or because we do not get a representation or warranty that covers a discovered defect or violation. In addition, losses with respect to such loans will generally be borne by us as the holder of the “first-loss” securities in our securitizations.
•Disclosure and Indemnity Risk: When engaging in securitization transactions, we also prepare marketing and disclosure documentation, including term sheets and prospectuses, that include disclosures regarding the securitization transactions, the securitization transaction agreements and the assets being securitized. If our marketing and disclosure documentation are alleged or found to contain inaccuracies or omissions, we may be liable under federal and state securities laws (or under other laws) for damages to third parties that invest in these securitization transactions, including in circumstances where we relied on a third party in preparing accurate disclosures, or we may incur other expenses and costs disputing these allegations or settling claims. Additionally, we typically retain various third-party service providers when we engage in securitization transactions, including underwriters, trustees, administrative and paying agents, servicers and custodians, among others. We frequently contractually agree to indemnify these service providers against various claims and losses they may suffer from providing these services to us or the securitization trust. If any of these service providers are liable for damages to third parties that have invested in these securitization transactions, we may incur costs and expenses because of these indemnities.
•Call Right Risk: We often retain call rights with respect to certain sponsored securitizations that permit us to redeem securities at par, and because these securitizations are generally consolidated, exercising such rights may affect our GAAP book value. Specifically, if the redeemed securities are carried below par at the time of redemption, our GAAP book value may decline.
36
•Documentation Defects: If there are problems with the establishment of title to underlying mortgaged property and lien priority rights are transferred, securitization transactions that we sponsored and third-party sponsored securitizations that we hold investments in may experience losses, which could expose us to losses and could damage our ability to engage in future securitization transactions.
Our ability to profitably execute or participate in future securitization transactions depends, in part, on our ability to compete with other purchasers of residential mortgage loans and the cost and availability of short-term debt, which may be negatively impacted by adverse market conditions beyond our control.
A significant part of our business and growth strategy is to engage in various securitization transactions related to residential mortgage loans. There are many factors that can have a significant impact on whether a securitization transaction is profitable to us or result in a loss. One of these factors is the price we pay for the mortgage loans that we securitize, which, in the case of residential mortgage loans, is impacted by the level of competition in the marketplace for acquiring residential mortgage loans and the relative desirability to originators or other financial institutions of retaining residential mortgage loans as investments or selling them to third parties such as us. The cost and availability of the short-term debt we use to finance our mortgage loans before securitization impacts our profitability. This short-term debt cost is affected by several factors including its availability to us, its interest rate, its duration, and the percentage of our mortgage loans for which third parties are willing to provide short-term financing.
After we acquire mortgage loans that we intend to securitize, we can also suffer losses if the value of those loans declines before securitization. Declines in the value of a residential mortgage loan, for example, can be due to, among other things, changes in interest rates, changes in the credit quality of the loan, changes in the projected yields required by investors to invest in securitization transactions, and increased delinquencies. Hedging against a decline in loan value due to changes in interest rates may impact the profitability of a securitization.
The price that investors in MBS will pay for securities issued in our securitization transactions also has a significant impact on the profitability of the transactions to us, and these prices are impacted by numerous market forces and factors including the uncertainty, potential delinquencies, and lack of liquidity. In addition, the underwriter(s) or placement agent(s) we select for securitization transactions, the terms of their engagement and the transaction costs incurred in such securitizations can also impact the profitability of our securitizations. Also, any liability that we may incur, or may be required to reserve for when executing a transaction can cause a loss to us. To the extent that we are not able to profitably execute future securitizations of residential mortgage loans or other assets, including for the reasons described above or for other reasons, it could have a material adverse impact on our business and financial results.
Competition may affect our ability to source our target assets at attractive prices and grow our investment management and advisory services, which may have a material adverse effect on our business, financial condition and results of operations.
We operate in a highly competitive market for investment opportunities. In acquiring real estate-related assets for ourselves or for any new Discretionary Fund in our capacity as investment manager, we compete with other mortgage REITs, investment management firms, specialty finance companies, savings and loan associations, banks, mortgage bankers, insurance companies, exchange traded funds, mutual funds, institutional investors, investment banking firms, financial institutions, private equity funds, hedge funds, governmental bodies (including the Federal Reserve) and other entities. Many of our competitors are significantly larger than we are, have access to greater capital, technical, technological, marketing and other resources, and may have other advantages over us. In addition, some of our competitors may have higher risk tolerances, different risk assessments, or fewer regulatory burdens and restrictions, which could allow them to consider a wider variety of investments and establish more favorable relationships than we can. The existence of these entities, as well as the possibility of additional entities forming in the future, may increase the competition for the acquisition of residential mortgage assets, resulting in higher prices and lower yields on such assets, as well as limiting our ability to raise third-party funds for, and therefore earn fees and incentive-based income from, any new Discretionary Funds.
We also provide investment management and advisory services on a non-discretionary basis. In that regard, we compete with investment management firms and similar entities for clients. Our clients may also choose to perform these functions internally and discontinue their relationships with us. Many of our competitors are significantly larger than we are, have access to greater capital and other resources, and may have other advantages over us. The existence of these entities, as well as the possibility of additional entities forming in the future, may limit our ability to grow fees from our non-discretionary investment management and advisory services or our ability to obtain new third-party non-discretionary accounts. The competitive pressures we face may have a material adverse effect on our business, financial condition and results of operations.
37
We rely on third parties to perform certain services particularly as it relates to loan servicing, comply with applicable laws and regulations, and carry out contractual covenants and terms, the failure of which by any of these third parties may adversely impact our business and financial results.
To conduct our business of acquiring loans, engaging in securitization transactions, and investing in third-party issued securities and other assets, we rely on third-party service providers to perform certain services, comply with applicable laws and regulations, and carry out contractual covenants and terms. Thus, we are subject to the risks associated with a third party’s failure to perform, including failure to perform due to reasons such as fraud, negligence, errors, miscalculations, or insolvency.
We rely on third-party loan servicers to service and manage the mortgage loans we beneficially own and that underlie our RMBS. Third-party servicers also service and manage the mortgage loans underlying MSRs that we may invest in. The ultimate returns generated by our investments may depend on the quality of the service providers, the selection of which we may not always have control. For example, servicers not vigilantly monitoring required monthly payments or taking longer than expected to resolve non-performing loans or liquidate related real properties may adversely impact the value of these investments and our financial performance. In addition, while we have contracted with third-party servicers to carry out the actual servicing of the loans we beneficially own, other than our securitized loans (including all direct interface with the borrowers) we are nevertheless ultimately responsible, vis-à-vis the borrowers and state and federal regulators, for ensuring that the loans are serviced in accordance with the terms of the related notes and mortgages and applicable law and regulation. See “Risks Related to Regulatory Matters, Accounting, and Our 1940 Act Exemption” for further discussion. Considering the current regulatory environment, such exposure could be significant even though we might have contractual claims against our servicers for any failure to service the loans to the required standard.
For a majority of the loans that we beneficially own (other than securitized loans), we also beneficially own the right to service those loans, and we retain a sub-servicer to service those loans. In these circumstances, we are exposed to certain risks, including, without limitation, that we may not be able to enter into sub-servicing agreements on favorable terms to us or at all, or that the sub-servicer may not properly service the loan in compliance with applicable laws and regulations or the contractual provisions governing their sub-servicing role, and that we would be held liable for the sub-servicer’s improper acts or omissions. Additionally, in its capacity as a servicer of residential mortgage loans, a sub-servicer will have access to borrowers’ non-public personal information, and we could incur liability for a data breach relating to a sub-servicer or misuse or mismanagement of data by a sub-servicer. In the past, one of our sub-servicers experienced a data breach of personal information requiring notifications to borrowers and remedial actions. We also rely on technology infrastructure and systems of third parties who provide services to us and with whom we transact business. To the extent any one sub-servicer counterparty services a significant percentage of the loans with respect to which we own the servicing rights, the risks associated with our use of that sub-servicer are concentrated around this single sub-servicer counterparty. To the extent that there are significant amounts of advances that need to be funded in respect of loans where we own the servicing right, it could have a material adverse effect on our business and financial results.
We also rely on corporate trustees to act on behalf of us in enforcing our rights as security holders. Under the terms of most RMBS we hold, we do not have the right to directly enforce remedies against the issuer of the security but instead must rely on a trustee to act on behalf of us and other security holders. Should a trustee not be required to act under the terms of the securities, or fail to act, we could experience losses.
The expanding body of federal, state and local regulations and the investigations of servicers may increase their cost of compliance and the risks of noncompliance and may adversely affect their ability to perform their servicing obligations.
We rely on third-party servicers to service the residential mortgage loans that we acquire through consolidated trusts and that underlie the RMBS that we acquire. The mortgage servicing business is subject to extensive regulation by federal, state and local governmental authorities and various laws and judicial and administrative decisions imposing requirements and restrictions and increased compliance costs on a substantial portion of their operations. The volume of new or modified laws and regulations has increased in recent years. Some jurisdictions and municipalities have enacted laws that restrict loan servicing activities, including delaying or preventing prompt foreclosures, forcing the modification of certain mortgages, or preventing the collection of interest or other charges from borrowers under certain circumstances. Certain mortgage lenders and third-party servicers may also voluntarily, or as part of settlements with law enforcement authorities, establish loan modification programs relating to loans they hold or service, even if such loan modifications and other actions are not in the best interests of the beneficial owners of the mortgages. These federal, state and local legislative or regulatory actions that result in modifications of our outstanding mortgages, or interests in mortgages acquired by us either directly through consolidated trusts or through our investments in RMBS, may adversely affect the value of, and returns on, such investments. The foregoing matters may cause our business, financial condition, results of operations and ability to pay dividends to be adversely affected.
We utilize third-party analytical models and data to value our investments, and any incorrect, misleading or incomplete information used in connection therewith would subject us to potential risks.
38
Given the complexity of our investments and strategies, we rely heavily on analytical models and information and data supplied by third parties, (“Third-Party Data”). Third-Party Data is used to value investments or potential investments and to hedge our investments. When we rely on Third-Party Data that proves to be incorrect, misleading or incomplete, our decisions expose us to potential risks. For example, by relying on Third-Party Data, especially valuation models, we may be induced to buy certain investments at prices that are too high, to sell certain other investments at prices that are too low, or to miss favorable opportunities altogether. Similarly, any hedging based on faulty Third-Party Data may prove to be unsuccessful. Furthermore, any valuations of our investments that are based on valuation models may prove to be incorrect.
These risks include the following: (i) collateral cash flows and/or liability structures may be incorrectly modeled in all or only certain scenarios, or may be modeled based on simplifying assumptions that lead to errors; (ii) information about collateral may be incorrect, incomplete, or misleading; (iii) collateral or bond historical performance (such as historical prepayments, defaults, cash flows, etc.) may be incorrectly reported, or subject to interpretation (e.g., different issuers may report delinquency statistics based on different definitions of what constitutes a delinquent loan); or (iv) collateral or bond information may be outdated, in which case the models may contain incorrect assumptions as to what has occurred since the date information was last updated.
Some of the Third-Party Data we use, such as mortgage prepayment models or mortgage default models, are predictive in nature. The use of predictive models has inherent risks. For example, such models may incorrectly forecast future behavior, leading to potential losses on a cash flow and/or a mark-to-market basis. In addition, the predictive models we use may differ substantially from those models used by other market participants, with the result that valuations based on these predictive models may be substantially higher or lower for certain investments than actual market prices. Furthermore, since predictive models are usually constructed based on historical data supplied by third parties, the success of relying on such models may depend heavily on the accuracy and reliability of the supplied historical data and the ability of these historical models to accurately reflect future periods.
All valuation models rely on correct market data inputs. Certain assumptions used as inputs to the models may be based on historical trends and these trends may not be indicative of future results. If incorrect market data is used, even a well-designed valuation model may result in incorrect valuations. Even if market data is appropriately captured in the model, the resulting “model prices” will often differ substantially from market prices, especially for securities with complex characteristics, such as derivative securities. Volatility in any asset class, including real estate and mortgage-related assets, increases the likelihood of Third-Party Data being inaccurate as market participants attempt to value assets that have frequent, significant swings in pricing.
We are dependent on information technology and systems, including those of third parties, and their failure, including through a cyber-attack, could significantly disrupt our business or result in the disclosure or misuse of confidential or other information, including personal information, which could damage our reputation, result in regulatory sanctions, subject us to litigation and/or increase our costs and cause losses that have a material adverse impact on our business, financial results and financial condition.
Our business is highly dependent on our information and communications systems. These information and communications systems include hardware, software and cloud-based solutions. Our business is also highly dependent on the information and communications systems of third parties with whom we do business or that facilitate our business activities, including clearing agents, mortgage servicers, trustees, business counterparties, technology service providers and financial intermediaries. Our relationships with certain of these third parties allow for the external storage and processing of our information, including personal information, and counterparty and borrower information, including on cloud-based systems. In addition, third parties to whom we provide investment management and advisory services and a few customers who license two of our internally developed data analytics technologies, may also share their confidential information, including personal information, with us, which information may be processed and stored in, and transmitted through, our computer systems and networks.
We may not be able to anticipate, detect or recognize threats to our systems and assets, or to implement effective preventive measures against all cyber threats, especially because the techniques used in cyber-attacks are increasingly sophisticated, change frequently, are complex, and are often not recognized until launched. Cyber-attacks can occur and persist for an extended period of time without detection. Investigations of cyber-attacks are inherently unpredictable, and it takes time to complete an investigation and have full and reliable information. These and other challenges could further increase the costs and consequences of a cyber-attack and may inhibit our ability to provide rapid, complete and reliable information about a cyber-attack to our business partners, counterparties and regulators, as well as the public.
Any failure, interruption, attack or security breach of our networks or systems or those of key third parties could cause delays or other problems in our business or result in the disclosure or misuse of confidential or other information, including personal information, that belongs to us, to third parties to whom we provide investment management and advisory services, or to a few customers who license two of our internally developed data analytics technologies. Such delays, problems or unintentional
39
disclosures could damage our reputation, result in regulatory sanctions or liability to third parties and/or increase our costs and cause losses that have a material adverse impact on our business, financial results and financial condition. Cyber criminals are now deploying sophisticated techniques to conduct more advanced and persistent attacks. We have been and continue to be the target of such attacks. From time to time, third parties with whom we do business, including servicers and due diligence and third-party data providers, have experienced data breaches or other cybersecurity incidents. Such attacks, as well as an actual or perceived failure by us or third parties to comply with privacy, data protection and information security laws, regulations, standards, policies and contractual obligations could result in legal liabilities, fines, regulatory action and reputational harm that have a material adverse impact on our business, financial results and financial condition. We cannot assure you that our cybersecurity control and response plans will be sufficient to prevent or mitigate all potential risks of cybersecurity threats and incidents. Especially due to the current hybrid working environments, where our personnel are spending some time working from home, there is an elevated risk of such events occurring.
The development, proliferation, and use of artificial intelligence could give rise to legal and/or regulatory action, damage our reputation or otherwise materially impact our business, financial condition, and liquidity.
We currently use artificial intelligence in certain aspects of our operations, and we believe the development and proliferation of artificial intelligence will have a significant impact in our industry; however, the emerging and rapidly evolving nature of artificial intelligence presents risks, challenges, and unintended consequences, including potential defects in the design and development of the technologies used to automate processes, misapplication of artificial intelligence-enabled technologies, the reliance on data, rules or assumptions that may prove incomplete or inaccurate, information security vulnerabilities and operational failures to meet internal or external expectations for reliability, accuracy, fairness, and among others. This risk affects the adoption and use of this technology to the extent artificial intelligence algorithms and machine learning methods are flawed or insufficiently tested. For example, the use of artificial intelligence may raise ethical concerns and legal issues in the origination of mortgage loans. While we aim to use artificial intelligence responsibly, we may be unsuccessful in identifying or resolving issues before they arise. Artificial intelligence-related issues, including potential government regulation of artificial intelligence, deficiencies or failures could give rise to legal and regulatory actions, damage our reputation or otherwise materially impact our business, financial condition, and liquidity.
Laws and regulations related to artificial intelligence are developing rapidly, and there is significant uncertainty as to the potential adoption of new laws and regulations, which may vary amongst various states, that may restrict or impose burdensome and costly requirements on our ability to use artificial intelligence. We may receive claims from third parties, including our competitors, alleging that the use of artificial intelligence technology infringes on or violates such third party’s intellectual property rights. Adverse consequences of these risks related to artificial intelligence could undermine the decisions, predictions or analyses such technologies produce and subject us to competitive harm, legal liability, heightened regulatory scrutiny and brand or reputational harm. We could face competitive pressure to adopt AI at a pace consistent with technological advancements across our industry. If we are unable to implement AI capabilities as quickly or effectively as our competitors, our relative market position could be negatively affected.
Our executive officers and other key personnel are critical to our success and the loss of any executive officer or key employee may materially adversely affect our business.
Our success and our ability to manage anticipated future growth depend, in large part, upon the efforts of our highly skilled employees, and particularly on our key personnel, including our executive officers. Our executive officers have extensive experience and strong reputations in our industry and have been instrumental in setting our strategic direction, operating our business, identifying, recruiting, and training our other key personnel, and arranging necessary financing. Retention and motivation of certain key employees is particularly important to our business in light of the recent HomeXpress Acquisitions due to the uncertainty and difficulty of integration, as well as the time and attention required by our management team. See the Risk Factor above captioned “We may fail to realize the expected benefits of the HomeXpress Acquisition”. In addition, the governing agreements of the Discretionary Funds typically require the suspension or termination of the investment period if certain members of our senior management team or key personnel cease to devote sufficient professional time to or cease to be employed by the Company, often called a “key person event,” or in connection with certain other events. The departure of any of our executive officers or other key personnel, or our inability to attract, motivate and retain highly qualified employees at all levels of the firm in light of the intense competition for talent, could adversely affect our business, operating results or financial condition, diminish our investment opportunities, or weaken our relationships with lenders, counterparties and other parties important to our business and strategy.
Risks Related to Regulatory Matters, Accounting, and Our 1940 Act Exemption
Our business is subject to extensive regulation that may subject us to significant costs and compliance requirements, and there can be no assurance that we will satisfactorily comply with such regulations. Any changes in regulatory and
40
legal requirements, including changes in their interpretation and enforcement by lawmakers and regulators, could materially and adversely affect our business and our financial condition, liquidity, and results of operations.
Our business is subject to extensive regulation by federal and state governmental authorities, self-regulatory organizations, and securities exchanges. We are required to comply with numerous federal and state laws. The laws, rules and regulations comprising this regulatory framework change frequently, as can the interpretation and enforcement of existing laws, rules, and regulations. We incur significant ongoing costs to comply with these government regulations.
Our portfolio includes or may include investments in mortgage pass-through certificates issued or guaranteed by Ginnie Mae, Fannie Mae or Freddie Mac. The FHFA and Congress have considered various measures that would significantly reform the country’s mortgage finance system, including, among other things, eliminating Freddie Mac and Fannie Mae and replacing them with a single new MBS insurance agency. While the likelihood that major mortgage finance system reform will be enacted in the short term or through administrative action remains uncertain, it is possible that the adoption of any such reforms could adversely affect the types of assets we can buy, the costs of these assets and our business operations. A reduction in the ability of mortgage loan originators to access Fannie Mae and Freddie Mac to sell their mortgage loans may adversely affect the mortgage markets generally and adversely affect the ability of mortgagors to refinance their mortgage loans. In addition, any decline in the value of securities issued by Fannie Mae and Freddie Mac may affect the value of MBS in general.
Although we do not currently directly service residential mortgage loans, where this activity is subject to separate state and federal regulatory requirements, we may do so in the future. We and our HomeXpress clients are required to comply with a wide array of laws, rules and regulations, including federal and state consumer lending regulations, that concern, among other things, the manner in which we conduct our loan origination and acquisition business and the fees that we may charge, and the collection, use, retention, protection, disclosure, transfer and processing of personal information by us and our clients. Governmental authorities and various U.S. federal and state agencies, including the CFPB, have broad oversight and supervisory authority over our HomeXpress business. See “Risks Related to Our Recent Acquisition and Loan Origination and Acquisition Business” for further discussion. We are also subject to various federal and state laws, rules, and regulations because we purchase residential mortgage loans, including rules promulgated under the Dodd-Frank Act and the Gramm-Leach-Bliley Financial Modernization Act of 1999. The CFPB, has broad authority over a wide range of consumer financial products and services, including mortgage lending and servicing. One portion of the Dodd-Frank Act, the Mortgage Reform and Anti-Predatory Lending Act (or Mortgage Reform Act), contains underwriting and servicing standards for the mortgage industry and various other requirements related to mortgage origination and servicing. In addition, the Dodd-Frank Act grants enforcement authority and broad discretionary regulatory authority to the CFPB to prohibit or condition terms, acts or practices relating to residential mortgage loans that the CFPB finds abusive, unfair, deceptive or predatory, as well as to take other actions that the CFPB finds are necessary or proper to ensure responsible affordable mortgage credit remains available to consumers. The Dodd-Frank Act also affects the securitization of mortgages (and other assets) with requirements for risk retention by securitizers and requirements for regulating rating agencies.
Numerous regulations have been issued pursuant to the Dodd-Frank Act, including regulations regarding mortgage loan servicing, underwriting and loan originator compensation and others could be issued in the future. These requirements can and do change, and the recent trends among federal and state lawmakers and regulators have been toward increasing laws, regulations, and investigative proceedings concerning the mortgage industry generally. As a result, we are unable to predict how the Dodd-Frank Act, as well as future laws or regulations, will affect our business, results of operations and financial condition, or the environment for financing or investing. We believe that the Dodd-Frank Act and the regulations promulgated thereunder are likely to continue to increase the economic and compliance costs for participants in the mortgage and securitization industries, including us.
In 2020, in response to the COVID-19 pandemic, wide-ranging legal protections for homeowners, including foreclosure moratoria and forbearance provisions, were enacted and extended multiple times including through the Coronavirus Aid, Relief, and Economic Security Act (or CARES Act), which was signed into law on March 27, 2020, and rules and letters issued by the Federal Housing Agency and the CFPB. If the COVID-19 pandemic resurges or another public health crisis breaks out in the future, similar measures may be reenacted, which could adversely affect our business, results of operations and financial condition.
Although we believe that we have structured our operations and investments to comply with existing legal and regulatory requirements and interpretations, changes in regulatory and legal requirements, including changes in their interpretation and enforcement by lawmakers and regulators, could materially and adversely affect our business and our financial condition, liquidity, and results of operations.
The need to operate within the parameters that allow us to be excluded from regulation as a commodity pool operator could limit the use of swaps by us below the level we would otherwise consider optimal or may lead to the registration of us or our directors as commodity pool operators, which will subject us to additional regulatory oversight, compliance and costs.
41
The Dodd-Frank Act established a comprehensive regulatory framework for derivative contracts commonly referred to as “swaps.” Under the Dodd-Frank Act, any investment fund that trades in swaps may be considered a “commodity pool,” which would cause its operators to be regulated as a commodity pool operator (“CPO”). In December 2012, the CFTC issued a no-action letter, giving relief to operators of mortgage REITs from the requirement to register as a CPO. In order to qualify, we must, among other non-operation requirements: (1) limit our initial margin and premiums required to establish our swap or futures positions to no more than 5% of the fair market value of our total assets; and (2) limit our net income derived annually from our swaps and futures positions that are not “qualifying hedging transactions” to less than 5% of our gross income. The need to operate within these parameters could limit the use of swaps by us below the level that we would otherwise consider optimal or may lead to the registration of us or our directors as commodity pool operators, which will subject us to additional regulatory oversight, compliance and costs.
We may be required to obtain various state licenses to purchase mortgage loans in the secondary market and there is no assurance we will be able to obtain or maintain those licenses.
While we are not required to obtain licenses to purchase MBS, the purchase of residential mortgage loans in the secondary market may, in some circumstances, require us, or the entities, including securitization trusts, we use to conduct our business, to maintain various state licenses. Acquiring the right to service residential mortgage loans may also, in some circumstances, require us to maintain various state licenses even though we currently do not expect to directly engage in loan servicing ourselves. Thus, we could be delayed in conducting certain business if we were first required to obtain a state license. We cannot assure you that we will be able to obtain all the licenses we need or that we would not experience significant delays in obtaining these licenses. Furthermore, once licenses are issued, we are required to comply with various information reporting and other regulatory requirements to maintain those licenses, and there is no assurance that we will be able to satisfy those requirements or other regulatory requirements applicable to our business of acquiring residential mortgage loans on an ongoing basis. Our failure to obtain or maintain required licenses or our failure to comply with regulatory requirements that are applicable to our business of acquiring residential mortgage loans may restrict our business and investment options and could harm our business and expose us to penalties or other claims.
Our GAAP financial results may not be an accurate indicator of taxable income and dividend distributions.
Generally, the cumulative net income we report over the life of an asset will be the same for GAAP and tax purposes, although the timing of this income recognition over the life of the asset could be materially different. Differences exist in the accounting for GAAP net income and REIT taxable income, which can lead to significant variances in the amount and timing of when income and losses are recognized under these two measures. Due to these differences, our reported GAAP financial results could materially differ from our determination of taxable income, which impacts our dividend distribution requirements, and, therefore, our GAAP results may not be an accurate indicator of future taxable income and dividend distributions.
Changes in accounting rules could occur at any time and could impact us in significantly negative ways that we are unable to predict or protect against.
The Financial Accounting Standards Board, or the FASB, and other regulatory bodies that establish the accounting rules applicable to us have recently proposed or enacted a wide array of changes to accounting rules. Moreover, in the future, these regulators may propose additional changes that we do not currently anticipate. Changes to accounting rules that apply to us could significantly impact our business or our reported financial performance in ways that we cannot predict or protect against. We cannot predict whether any changes to current accounting rules will occur or what impact any codified changes will have on our business, results of operations, liquidity or financial condition, directly or through their impact on our business partners or counterparties.
Loss of our 1940 Act exemption would adversely affect us and negatively affect the market price of shares of our capital stock and our ability to distribute dividends.
We conduct our operations so that neither we nor any of our subsidiaries are required to register as an investment company under the 1940 Act. Section 3(a)(1)(A) of the 1940 Act defines an investment company as any issuer that is or holds itself out as being engaged primarily in the business of investing, reinvesting, or trading in securities. Section 3(a)(1)(C) of the 1940 Act defines an investment company as any issuer that is engaged or proposes to engage in the business of investing, reinvesting, owning, holding, or trading in securities and owns or proposes to acquire investment securities having a value exceeding 40% of the value of the issuer’s total assets (exclusive of U.S. Government securities and cash items) on an unconsolidated basis, which we refer to as the 40% test. Excluded from the term “investment securities,” among other things, are U.S. Government securities and securities issued by majority-owned subsidiaries that are not themselves investment companies and are not
42
relying on the exclusion from the definition of investment company set forth in Section 3(c)(1) or Section 3(c)(7) of the 1940 Act.
Because we are a holding company that conducts its businesses primarily through wholly owned subsidiaries and majority-owned subsidiaries, the securities issued by these subsidiaries that are excepted from the definition of “investment company” under Section 3(c)(1) or Section 3(c)(7) of the 1940 Act, together with any other investment securities we may own, may not have a combined value in excess of 40% of the value of our adjusted total assets on an unconsolidated basis. This requirement limits the types of businesses in which we may engage through our subsidiaries. In addition, the assets we and our subsidiaries may acquire are limited by the provisions of the 1940 Act, the rules and regulations promulgated under the 1940 Act and SEC staff interpretative guidance, which may adversely affect our performance.
Certain of our subsidiaries may rely on Section 3(c)(7) for their 1940 Act exemption and, therefore, our interest in each of these subsidiaries would constitute an “investment security” for purposes of determining whether we pass the 40% test.
Certain of our subsidiaries rely on the exemption from registration provided by Section 3(c)(5)(C) of the 1940 Act. Section 3(c)(5)(C) as interpreted by the staff of the SEC, requires us to invest at least 55% of our assets in “mortgages and other liens on and interest in real estate” (“Qualifying Real Estate Assets”) and at least 80% of our assets in Qualifying Real Estate Assets plus real estate-related assets. The assets that we acquire, therefore, are limited by the provisions of the 1940 Act and the rules and regulations promulgated under the 1940 Act. If the SEC determines that any of our subsidiaries’ securities are not Qualifying Real Estate Assets or real estate-related assets or otherwise believes such subsidiary does not satisfy the exemption under Section 3(c)(5)(C) of the 1940 Act, we could be required to restructure our activities or sell certain of our assets. The net effect of these factors will be to lower our net interest income. If we fail to qualify for exemption from registration as an investment company, our ability to use leverage would be substantially reduced, and we would not be able to conduct our business as described.
Certain of our subsidiaries may rely on Rule 3a-7, which exempts certain securitization vehicles. There are numerous requirements that must be met to exclude such subsidiaries from the definition of an investment company. Our ability to manage assets held in a special purpose subsidiary that complies with Rule 3a-7 will be limited and we may not be able to purchase or sell assets owned by that subsidiary when we would otherwise desire to do so, which could lead to losses.
The determination of whether an entity is a majority-owned subsidiary of our company is made by us. The 1940 Act defines a majority-owned subsidiary of a person as a company of which 50% or more of the outstanding voting securities are owned by such person, or by another company which is a majority-owned subsidiary of such person. The 1940 Act further defines voting securities as any security presently entitling the owner or holder thereof to vote for the election of directors of a company. We treat companies in which we own at least a majority of the outstanding voting securities as majority-owned subsidiaries for purposes of the 40% test. We have not requested the SEC to approve our treatment of any company as a majority-owned subsidiary, and the SEC has not done so. If the SEC were to disagree with our treatment of one or more companies as majority-owned subsidiaries, we may need to adjust our strategy and our assets to continue to pass the 40% test. Any such adjustment in our strategy could have a material adverse effect on us.
There can be no assurance that the laws and regulations governing the 1940 Act status of REITs, including guidance from the Division of Investment Management of the SEC regarding these exemptions, will not change in a manner that adversely affects our operations. If we or our subsidiaries fail to maintain an exception or exemption from the 1940 Act, we could, among other things, be required either to (a) substantially change the manner in which we conduct our operations to avoid being required to register as an investment company, (b) effect sales of our assets in a manner that, or at a time when, we would not otherwise choose to do so, or (c) register as an investment company, any of which could negatively affect the value of our capital stock, the sustainability of our business model, and our ability to make distributions, which could have an adverse effect on our business and the market price for our shares of capital stock.
U.S. Federal Income Tax Risks and Risks Related to Our REIT Status
Complying with REIT requirements may cause us to forego otherwise attractive opportunities or to liquidate otherwise attractive investments.
To maintain our qualification as a REIT, we must continually satisfy various tests regarding the sources of our income, the nature and diversification of our assets, the amounts we distribute to our stockholders and the ownership of our stock. To meet these tests, we may be required to forego investments we might otherwise make. We may be required to make distributions to stockholders at disadvantageous times or when we do not have funds readily available for distribution. Thus, compliance with the REIT requirements may hinder our investment performance. In particular, we generally must ensure that at the end of each calendar quarter at least 75% of the value of our total assets consists of cash, cash items, government securities and qualifying
43
real estate assets, including certain mortgage loans and MBS. The remainder of our investments in securities (other than government securities and qualifying real estate assets) generally cannot include more than 10% of the outstanding voting securities of any one issuer or more than 10% of the total value of the outstanding securities of any one issuer. In addition, in general, no more than 5% of the value of our assets (other than government securities, qualifying real estate assets, and stock in one or more TRSs) can consist of the securities of any one issuer, and no more than 25% of the value of our total assets can be represented by securities of one or more TRSs (20% for taxable years beginning before January 1, 2026). If we fail to comply with these requirements at the end of any quarter, we must correct the failure within 30 days after the end of such calendar quarter or qualify for certain statutory relief provisions to avoid losing our REIT status and suffering adverse tax consequences. Thus, we may be required to liquidate from our portfolio otherwise attractive investments. These actions could have the effect of reducing our income and amounts available for distribution to our stockholders.
Complying with REIT requirements may limit our ability to hedge effectively.
The REIT provisions of the Internal Revenue Code of 1986, as amended (the “Code”), substantially limit our ability to hedge our assets and related borrowings. Under these provisions, any income that we generate from transactions intended to hedge our interest rate, inflation and/or currency risks will be excluded from gross income for purposes of the REIT 75% and 95% gross income tests if the instrument hedges (1) interest rate risk on liabilities incurred to carry or acquire real estate or (2) risk of currency fluctuations with respect to any item of income or gain that would be qualifying income under the REIT 75% or 95% gross income tests, and such instrument is properly identified under applicable Treasury Department regulations. Our annual gross income from non-qualifying hedges, together with any other income not generated from qualifying real estate assets, cannot exceed 25% of our annual gross income. In addition, our aggregate gross income from non-qualifying hedges, fees, and certain other non-qualifying sources cannot exceed 5% of our annual gross income. As a result, we might have to limit our use of advantageous hedging techniques or implement certain hedges through a TRS. This could increase the cost of our hedging activities or expose us to greater risks associated with changes in interest rates than we would otherwise want to bear.
We may invest in TBAs, which have some uncertainty in their treatment under the REIT asset and income tests.
We may in the future purchase and sell Agency RMBS through to-be-announced forward contracts (“TBAs”) and recognize income or gains from the disposition of those TBAs, through dollar roll transactions or otherwise. While there is no direct authority with respect to the qualification of TBAs as real estate assets or U.S. Government securities for purposes of the REIT 75% asset test or the qualification of income or gains from dispositions of TBAs as gains from the sale of real property or other qualifying income for purposes of the REIT 75% gross income test, we intend to treat the GAAP value of our TBAs under which we contract to purchase to-be-announced Agency RMBS as qualifying assets for purposes of the REIT 75% asset test, and we treat income and gains from our TBAs as qualifying income for purposes of the REIT 75% gross income test. No assurance can be given that the IRS would not assert that such assets or income are not qualifying assets or income. If the IRS were to successfully challenge our position, we could be subject to a penalty tax or we could fail to remain qualified as a REIT if a sufficient portion of our assets consists of TBAs or a sufficient portion of our income consists of income or gains from the disposition of TBAs.
Failure to qualify as a REIT would subject us to U.S. federal income tax, which would reduce the cash available for distribution to our stockholders.
We have elected to be treated as a REIT for U.S. federal income tax purposes and intend to operate so that we will qualify as a REIT. However, the U.S. federal income tax laws governing REITs are extremely complex, and interpretations of the U.S. federal income tax laws governing qualification as a REIT are limited. Qualifying as a REIT requires us to meet various tests regarding the nature of our assets and our income, the ownership of our outstanding stock, and the amount of our distributions on an ongoing basis. While we intend to operate so as to maintain our qualification as a REIT, given the highly complex nature of the rules governing REITs, the ongoing importance of factual determinations, including the tax treatment of certain investments we may make, and the possibility of future changes in our circumstances, no assurance can be given that we will so qualify for any particular year.
We also indirectly own an entity that has elected to be taxed as a REIT under the U.S. federal income tax laws (the “Subsidiary REIT”). Our Subsidiary REIT is subject to the same REIT qualification requirements that are applicable to us. If our Subsidiary REIT were to fail to qualify as a REIT, then (i) that Subsidiary REIT would become subject to regular U.S. federal, state and local corporate income tax, (ii) our interest in such Subsidiary REIT would cease to be a qualifying asset for purposes of the REIT asset tests, and (iii) it is possible that we would fail certain of the REIT asset tests, in which event we also would fail to qualify as a REIT unless we could avail ourselves of certain relief provisions. While we believe that the Subsidiary REIT has qualified as a REIT under the Code, we have joined the Subsidiary REIT in filing a “protective” TRS election under Section 856(l) of the Code for each taxable year in which we have owned an interest in the Subsidiary REIT. We cannot assure you that such "protective" TRS election would be effective to avoid adverse consequences to us. Moreover, even if the “protective” election were to be effective, the Subsidiary REIT would be subject to regular corporate income tax, and we cannot assure you
44
that we would not fail to satisfy the requirement that not more than 25% (20% for taxable years beginning before January 1, 2026) of the value of our total assets may be represented by the securities of one or more TRSs. See “Our ownership of and relationship with our TRSs will be limited, and a failure to comply with the limits would jeopardize our REIT status and may result in the application of a 100% excise tax.” below.
If we fail to qualify as a REIT in any calendar year and we do not qualify for certain statutory relief provisions, we would be required to pay U.S. federal income tax on our taxable income at regular corporate income tax rates. We might need to borrow money or sell assets to pay any such tax. Our payment of income tax would decrease the amount of our income available for distribution to our stockholders. Furthermore, if we fail to maintain our qualification as a REIT and we do not qualify for certain statutory relief provisions, we no longer would be required to distribute substantially all our REIT taxable income to our stockholders. Unless our failure to qualify as a REIT was excused under U.S. federal tax laws, we would be disqualified from taxation as a REIT for the four taxable years following the year during which qualification was lost.
The ability of our Board of Directors to revoke our REIT election without stockholder approval may cause adverse consequences to our stockholders.
Our charter provides that our Board of Directors may revoke or otherwise terminate our REIT election, without the approval of our stockholders, if our Board of Directors determines that it is no longer in our best interest to attempt to, or continue to, qualify as a REIT. If we cease to qualify as a REIT, we would become subject to U.S. federal income tax on our net taxable income and we generally would no longer be required to distribute any of our net taxable income to our stockholders, which may have adverse consequences on the total return to our stockholders.
Distributions may be treated as unrelated business taxable income to tax-exempt investors.
If (1) all or a portion of our assets are subject to the rules relating to taxable mortgage pools, (2) we are a ‘‘pension-held REIT,’’ (3) a tax-exempt stockholder has incurred debt to purchase or hold our capital stock, or (4) the residual REMIC interests, we buy (if any) generate “excess inclusion income,” then a portion of the distributions to and, in the case of a stockholder described in clause (3), gains realized on the sale of capital stock by such tax-exempt stockholder may be subject to U.S. federal income tax as unrelated business taxable income under the Code.
Classification of our securitizations or financing arrangements as a taxable mortgage pool could subject us or certain of our stockholders to increased taxation.
We intend to structure our securitization and financing arrangements so as to not allocate “excess inclusion income” to our stockholders. However, if we have borrowings with two or more maturities and, (1) those borrowings are secured by mortgages or MBS and (2) the payments made on the borrowings are related to the payments received on the underlying assets, then the borrowings and the pool of mortgages or MBS to which such borrowings relate may be classified as a taxable mortgage pool under the Code. If any part of our investments were to be treated as a taxable mortgage pool, then our REIT status would not be impaired, but a portion of the taxable income we recognize may, under regulations to be issued by the Treasury Department, be characterized as excess inclusion income and allocated among our stockholders to the extent of and generally in proportion to the distributions we make to each stockholder. Any excess inclusion income would:
•not be allowed to be offset by a stockholder’s net operating losses;
•be subject to a tax as unrelated business income if a stockholder were a tax-exempt stockholder;
•be subject to the application of U.S. federal withholding tax at the maximum rate (without reduction for any otherwise applicable income tax treaty) with respect to amounts allocable to foreign stockholders; and
•be taxable (at the highest corporate tax rate) to us, rather than to our stockholders, to the extent the excess inclusion income relates to stock held by disqualified organizations (generally, tax-exempt organizations not subject to tax on unrelated business income, including governmental organizations).
Failure to make required distributions would subject us to tax, which would reduce the cash available for distribution to our stockholders.
To maintain our qualification as a REIT, we must distribute to our stockholders each calendar year at least 90% of our REIT taxable income (excluding certain items of non-cash income in excess of a specified threshold), determined without regard to the deduction for dividends paid and excluding net capital gain. To the extent that we satisfy the 90% distribution requirement, but distribute less than 100% of our taxable income, we will be subject to federal corporate income tax on our undistributed income. In addition, we will incur a 4% nondeductible excise tax on the amount, if any, by which our distributions in any calendar year are less than the sum of:
45
•85% of our REIT ordinary income for that year;
•95% of our REIT capital gain net income for that year; and
•any undistributed taxable income from prior years.
We intend to distribute all of our REIT taxable income to our stockholders so as to satisfy the 90% distribution requirement and to avoid both corporate income tax and the 4% nondeductible excise tax.
Our taxable income may substantially exceed our net income as determined by GAAP. As an example, realized capital losses may be included in our GAAP net income, but may not be deductible in computing our taxable income. In addition, we may invest in assets that generate taxable income in excess of economic income or in advance of the corresponding cash flow from the assets. Also, our ability, or the ability of our subsidiaries, to deduct interest may be limited under Section 163(j) of the Code. To the extent that we generate such non-cash taxable income or have limitations on our deductions in a taxable year, we may incur corporate income tax and the 4% nondeductible excise tax on that income if we do not distribute such income to stockholders in that year. In that event, we may be required to use cash reserves, incur debt, or liquidate non-cash assets at rates or at times that we regard as unfavorable to satisfy the distribution requirement and to avoid corporate income tax and the 4% nondeductible excise tax in that year. Moreover, our ability to distribute cash may be limited by available financing facilities. Therefore, our dividend payment level may fluctuate significantly, and, under some circumstances, we may not pay dividends at all.
Our ownership of and relationship with our TRSs will be limited, and a failure to comply with the limits would jeopardize our REIT status and may result in the application of a 100% excise tax.
A REIT may own up to 100% of the equity of one or more TRSs. A TRS may earn income that would not be qualifying income if earned directly by the parent REIT. Both the subsidiary and the REIT must jointly elect to treat the subsidiary as a TRS. Overall, no more than 25% (20% for taxable years beginning before January 1, 2026) of the value of a REIT’s assets may consist of stock or securities of one or more TRSs. A TRS will pay U.S. federal, state and local income tax at regular corporate rates on any taxable income that it earns and could be subject to the 15% corporate alternative minimum tax on its adjusted financial statement income if certain income thresholds are met. In addition, the TRS rules impose a 100% excise tax on certain transactions between a TRS and its parent REIT that are not conducted on an arm’s-length basis. Our TRS after-tax net income would be available for distribution to us but would not be required to be distributed to us. We expect to satisfy the 25% limitation discussed above and conduct transactions with any TRS on an arm's length basis. There can be no assurance, however, that we will be able to comply with the 25% limitation or to avoid application of the 100% excise tax.
The tax on prohibited transactions will limit our ability to engage in transactions, including certain methods of securitizing mortgage loans, that would be treated as sales for U.S. federal income tax purposes.
A REIT’s net income from prohibited transactions is subject to a 100% tax. In general, prohibited transactions are sales or other dispositions of property, other than foreclosure property, but including mortgage loans, held primarily for sale to customers in the ordinary course of business. We might be subject to this tax if we sold or securitized our assets in a manner that was treated as a sale for U.S. federal income tax purposes. Therefore, to avoid the prohibited transactions tax, we may choose not to engage in certain sales of assets at the REIT level and may securitize assets in transactions that are treated as financing transactions and not as sales for tax purposes even though such transactions may not be the optimal execution on a pre-tax basis. We could avoid any prohibited transactions tax concerns by engaging in securitization transactions or sales of loans, including loans originated by HomeXpress, through a TRS, subject to certain limitations described above. To the extent that we engage in such activities through domestic TRSs, the income associated with such activities will be subject to U.S. federal (and applicable state and local) corporate income tax. There can be no assurance, however, that we will avoid the application of the 100% tax on net income from prohibited transactions described above.
The interest apportionment rules may affect our ability to comply with the REIT asset and gross income tests.
The mortgage loans we acquire may be subject to the interest apportionment rules under Treasury Regulations Section 1.856-5(c) (the “Interest Apportionment Regulation”), which generally provides that if a mortgage is secured by both real property and other property, a REIT is required to apportion its annual interest income for purposes of the REIT 75% gross income test. If a mortgage is secured by both real property and personal property and the value of the personal property does not exceed 15% of the aggregate value of the property securing the mortgage, the mortgage is treated as secured solely by real property for this purpose.
46
For purposes of the asset tests applicable to REITs, Revenue Procedure 2014-51 provides a safe harbor under which the IRS will generally not challenge a REIT’s treatment of a loan as being in part a real estate asset in an amount equal to the lesser of the fair market value of the loan or the fair market value of the real property securing the loan at certain relevant testing dates. We believe that all of the mortgage loans that we acquire are secured only by real property. Therefore, we believe that the Interest Apportionment Regulation does not apply to our portfolio.
Nevertheless, if the IRS were to assert successfully that our mortgage loans were secured by property other than real estate, that the Interest Apportionment Regulation applied for purposes of our REIT testing, and that the position taken in Revenue Procedure 2014-51 should be applied to our portfolio, then we might not be able to meet the REIT 75% gross income test, and possibly the asset tests applicable to REITs. If we did not meet these tests, we could lose our REIT status or be required to pay a tax penalty to the IRS.
Even if we remain qualified as a REIT, we may face other tax liabilities that reduce our cash flow.
Even if we remain qualified for taxation as a REIT, we may be subject to certain U.S. federal, state and local taxes on our income and assets, including taxes on any undistributed income, tax on income from some activities conducted because of a foreclosure, excise taxes, state or local income, property and transfer taxes, such as mortgage recording taxes, and other taxes. In addition, to meet the REIT qualification requirements, prevent the recognition of certain types of non-cash income, or to avert the imposition of a 100% tax that applies to certain gains derived by a REIT from dealer property or inventory, we may originate or hold some of our assets through our TRSs or other subsidiary corporations that will be subject to corporate-level income tax at regular corporate rates. In certain circumstances, the ability of our TRSs to deduct net interest expense may be limited. Any of these taxes would decrease cash available for distribution to our stockholders.
The failure of excess MSRs held by us to qualify as real estate assets, or the failure of the income from excess MSRs to qualify as interest from mortgages, could adversely affect our ability to qualify as a REIT.
We may hold excess MSRs. In certain private letter rulings, the IRS ruled that excess MSRs meeting certain requirements would be treated as an interest in mortgages on real property and thus a real estate asset for purposes of the 75% REIT asset test, and interest received by a REIT from such excess MSRs will be considered interest on obligations secured by mortgages on real property for purposes of the 75% gross income test. A private letter ruling may be relied upon only by the taxpayer to whom it is issued, and the IRS may revoke a private letter ruling. We intend to treat any excess MSRs that we acquire that are consistent with the requirements provided in the private letter rulings as qualifying assets for purposes of the 75% gross asset test, and we intend to treat income from such excess MSRs as qualifying income for purposes of the 75% and 95% gross income tests. Notwithstanding the IRS's determination in the private letter rulings described above, it is possible that the IRS could successfully assert that any excess MSRs that we acquire do not qualify for purposes of the 75% REIT asset test and income from such MSRs does not qualify for purposes of the 75% and/or 95% gross income tests, which could cause us to be subject to a penalty tax and could adversely impact our ability to qualify as a REIT.
We may be subject to adverse legislative or regulatory tax changes that could reduce the market price of our capital stock and our business in general.
At any time, the U.S. federal income tax laws or regulations governing REITs or the administrative interpretations of those laws or regulations may be amended. We cannot predict when or if any new U.S. federal income tax law, regulation or administrative interpretation, or any amendment to any existing U.S. federal income tax law, regulation or administrative interpretation, will be adopted, promulgated or become effective and any such law, regulation or interpretation may take effect retroactively. We and our stockholders could be adversely affected by any such change in, or any new, U.S. federal income tax law, regulation or administrative interpretation.
Risks Related to Our Organization and Structure
Certain provisions of Maryland Law, of our charter, and of our bylaws contain provisions that may inhibit potential acquisition bids that stockholders may consider favorable, and the market price of our capital stock may be lower as a result.
•There are ownership limits and restrictions on transferability and ownership in our charter. To qualify as a REIT, not more than 50% of the value of our outstanding stock may be owned, directly or constructively, by five or fewer individuals during the second half of any calendar year. To assist us in satisfying this test, among other things, our charter generally prohibits any person or entity from beneficially or constructively owning more than 9.8% in value or number of shares, whichever is more restrictive, of any class or series of our outstanding capital stock. This restriction
47
may discourage a tender offer or other transactions or a change in the composition of our Board of Directors or control that might involve a premium price for our shares or otherwise be in the best interests of our stockholders and any shares issued or transferred in violation of such restrictions being automatically transferred to a trust for a charitable beneficiary, thereby resulting in a forfeiture of the additional shares.
•Our charter permits our Board of Directors to issue stock with terms that may discourage a third party from acquiring us. Our charter permits our Board of Directors to amend the charter without stockholder approval to increase the total number of authorized shares of stock or the number of shares of any class or series and to issue common or preferred stock, having preferences, conversion or other rights, voting powers, restrictions, limitations as to dividends or other distributions, qualifications, and terms or conditions of redemption as determined by our Board of Directors. Thus, our Board of Directors could authorize the issuance of stock with terms and conditions that could have the effect of discouraging a takeover or other transaction in which holders of some or a majority of our shares might receive a premium for their shares over the then-prevailing market price of our shares.
•Maryland Control Share Acquisition Act. Maryland law provides that holders of ‘‘control shares’’ of our company (defined as voting shares of stock which, when aggregated with all other shares controlled by the acquiring stockholder, entitle the stockholder to exercise one of three increasing ranges of voting power in electing directors) acquired in a “control share acquisition” (defined as the direct or indirect acquisition of ownership or control of “control shares”) have no voting rights except to the extent approved by our stockholders by the affirmative vote of at least two-thirds of all the votes entitled to be cast on the matter, excluding all interested shares. Our bylaws provide that we are not subject to the “control share” provisions of Maryland law. Our Board of Directors, however, may elect to make the “control share” statute applicable to us at any time and may do so without stockholder approval.
•Business Combinations. We are subject to the “business combination” provisions of Maryland law that, subject to limitations, prohibit certain business combinations (including a merger, consolidation, share exchange, or, in circumstances specified in the statute, an asset transfer or issuance or reclassification of equity securities) between us and an “interested stockholder” (defined generally as any person who beneficially owns 10% or more of our then outstanding voting capital stock or an affiliate or associate of ours who, at any time within the two‑year period before the date in question, was the beneficial owner of 10% or more of our then outstanding voting capital stock) or an affiliate thereof for five years after the most recent date on which the stockholder becomes an interested stockholder. After the five‑year prohibition, any business combination between us and an interested stockholder generally must be recommended by our Board of Directors and approved by the affirmative vote of at least (i) 80% of the votes entitled to be cast by holders of outstanding shares of our voting capital stock and (ii) two‑thirds of the votes entitled to be cast by holders of voting capital stock of the corporation other than shares held by the interested stockholder with whom or with whose affiliate the business combination is to be effected or held by an affiliate or associate of the interested stockholder. These super‑majority voting requirements do not apply if our common stockholders receive a minimum price, as defined under Maryland law, for their shares in the form of cash or other consideration in the same form as previously paid by the interested stockholder for its shares. These provisions of Maryland law also do not apply to business combinations that are approved or exempted by a Board of Directors before the time that the interested stockholder becomes an interested stockholder. Pursuant to the statute, our Board of Directors has by resolution exempted business combinations between us and any other person, provided, that such business combination is first approved by our Board of Directors (including a majority of our directors who are not affiliates or associates of such person).
•Unsolicited Takeovers: The “unsolicited takeover” provisions of Maryland law, permit our Board of Directors, without stockholder approval and regardless of what is currently provided in our charter or bylaws, to elect to be subject to any or all of five provisions, including a classified board, a two-thirds vote requirement for removing a director, a requirement that the number of directors be fixed only by vote of the directors, a requirement that a vacancy on the board be filled only by the remaining directors and for the remainder of the full term of the class of directors in which the vacancy occurred, and majority requirement for the calling of a special meeting of stockholders. Through provisions in our charter and bylaws unrelated to this statute, we (i) require, unless called by the chairman of our Board of Directors, our chief executive officer, our president or our Board of Directors, the request of stockholders entitled to cast not less than a majority of all the votes entitled to be cast at the meeting to call a special meeting of
48
stockholders, (ii) require that the number of directors be fixed only by our Board of Directors, (iii) have a classified board and (iv) have a two-thirds vote requirement for the removal of a director. We have elected in our charter to be subject to the provision whereby any vacancy on the board is filled only by a vote of the remaining directors (whether or not they constitute a quorum) for the remainder of the full term of the directorship in which the vacancy occurred and until a successor is duly elected and qualifies. These provisions may have the effect of inhibiting a third party from making an acquisition proposal for us or of delaying, deferring, or preventing a change in control of us under the circumstances that otherwise could provide the holders of shares of common stock with the opportunity to realize a premium over the then current market price.
•Classified Board. Our Board of Directors is divided into three classes of directors. Directors of each class are chosen for terms expiring at the annual meeting of stockholders held in the third year following the year of their election, and each year one class of directors is elected by the stockholders. The classified terms of our directors may reduce the possibility of a tender offer or an attempt at a change in control, even though a tender offer or change in control might be in the best interests of our stockholders.
Our rights and the rights of our stockholders to take action against our directors and officers are limited, which could limit stockholders’ recourse in the event of actions not in their best interests.
Our charter limits the liability of our directors and officers to us and our stockholders for money damages, except for liability resulting from:
•actual receipt of an improper benefit or profit in money, property or services; or
•a judgment or other final adjudication adverse to the director or officer based upon a finding of active and deliberate dishonesty by the director or officer that was material to the cause of action adjudicated in the proceeding.
In addition, our charter authorizes us to obligate our company to indemnify, and to pay or reimburse reasonable expenses in advance of final disposition of a proceeding to our present and former directors and officers for actions taken by them in those capacities to the maximum extent permitted by Maryland law. Our bylaws require us to indemnify and, without requiring a preliminary determination of the ultimate entitlement to indemnification, pay or reimburse reasonable expenses in advance of final disposition of a proceeding, each present or former director or officer, to the maximum extent permitted by Maryland law, in the defense of any proceeding to which he or she is made or threatened to be made, a party because of his or her service to us.
Risks Related to Our Securities
The market price and trading volume of shares of our capital stock may be volatile.
The market price of shares of our capital stock, including our common and preferred stock, may be highly volatile and could be subject to wide fluctuations. A variety of factors may influence the price of our common and preferred stock in the public trading markets. For example, some investors may perceive REITs as yield-driven investments and compare the annual yield from dividends by REITs with yields on various other types of financial instruments. An increase in market interest rates may lead purchasers of stock to seek a higher annual dividend rate from other investments, which could adversely affect the market price of the stock. Also, the trading volume in shares of our capital stock may fluctuate and cause significant price variations to occur. We cannot assure you that the market price of shares of our capital stock will not fluctuate or decline significantly in the future. Some of the factors that could negatively affect our share price or result in fluctuations in the price or trading volume of our shares of common and preferred stock include those set forth in this Item 1A. “Risk Factors” section.
We may not be able to pay dividends or other distributions on our capital stock.
Under Maryland law, no distributions on stock may be made if, after giving effect to the distribution, (i) the corporation would not be able to pay the indebtedness of the corporation as such indebtedness becomes due in the usual course of business or (ii) except in certain limited circumstances when distributions are made from net earnings, the corporation’s total assets would be less than the sum of the corporation’s total liabilities plus, unless the charter provides otherwise (which our charter does, with respect to any outstanding series of preferred stock), the amount that would be needed, if the corporation were to be dissolved at the time of the distribution, to satisfy the preferential rights upon dissolution of stockholders whose preferential rights on dissolution are superior to those receiving the distribution. There can be no guarantee that we will have sufficient cash to pay dividends on any series of our capital stock. Our ability to pay dividends may be impaired if any of the risks described in this
49
Item 1A “Risk Factors” section were to occur. In addition, payment of our dividends depends upon our earnings, our financial condition, maintenance of our REIT qualification and other factors as our Board of Directors may deem relevant from time to time. The payment of dividends may be more uncertain during disruptions in the mortgage, housing or related sectors, such as the current elevated interest rate environment. We cannot assure you that our business will generate sufficient cash flow from operations or that future borrowings will be available to us in an amount sufficient to enable us to make distributions on our common stock or any series of our preferred stock.
Interests of holders of our securities are structurally subordinated to the liabilities and obligations of our subsidiaries and may also be adversely affected by future offerings of securities.
We are a holding company that conduct our businesses primarily through our subsidiaries. Accordingly, claims of holders of our capital stock and debt securities are structurally subordinated to all existing and future liabilities and obligations of our subsidiaries. In the future, we may also attempt to increase our capital resources by making offerings of debt or additional offerings of equity or equity-linked securities, including commercial paper, warrants, senior or subordinated notes and series or classes of preferred stock or common stock. Upon liquidation, holders of our debt securities and shares of preferred stock, if any, and lenders with respect to other borrowings will receive a distribution of our available assets before the holders of our common stock. With certain limited exceptions related to some financing facilities, we are not required to offer any such shares to existing shareholders on a pre-emptive basis; therefore, additional offerings of equity securities, including securities that may be converted into or exchanged for equity securities, may dilute the holdings of our existing stockholders or reduce the market price of our capital stock, or both. Preferred stock, including our Series A, Series B, Series C, and Series D Preferred Stock, will have a preference on liquidating distributions or a preference on dividend payments or both that could limit our ability to make a dividend distribution to the holders of our capital stock, including our common stock. Because our decision to issue securities in any future offering will depend on market conditions and other factors beyond our control, we cannot predict or estimate the amount, timing or nature of our future offerings. Thus, holders of our securities bear the risk of our future offerings reducing the market price of our securities and diluting their holdings in us.
Changes in the amount of dividend distributions we pay or in the tax characterization of dividend distributions we pay may adversely affect the market price of our common stock or may result in holders of our common stock being taxed on dividend distributions at a higher rate than initially expected.
Our dividend distributions are driven by a variety of factors, including our minimum dividend distribution requirements under the REIT tax laws and our REIT taxable income as calculated for tax purposes pursuant to the Code. We generally intend to distribute to our common shareholders at least 90% of our REIT taxable income, although our reported financial results for GAAP purposes may differ materially from our REIT taxable income.
Our ability to pay a dividend per common share per quarter and the dividend on each series of our preferred stock at the stated dividend rate may be adversely affected by many factors, including the risk factors described herein. These same factors may affect our ability to pay other future dividends. In addition, to the extent we determine that future dividends would represent a return of capital to investors, rather than the distribution of income, we may determine to discontinue dividend payments until such time that dividends would again represent a distribution of income. Any reduction or elimination of our payment of dividend distributions would not only reduce the number of dividends you would receive as a holder of our common stock but could also have the effect of reducing the market price of our common stock.
Dividends payable by REITs generally do not qualify for the reduced tax rates available for some dividends.
Qualified dividend income payable to U.S. investors that are individuals, trusts, and estates is subject to the reduced maximum tax rate applicable to long-term capital gains. Dividends payable by REITs, however, generally are not eligible for the reduced qualified dividend rates. Non-corporate taxpayers may deduct up to 20% of certain pass-through business income, including “qualified REIT dividends” (generally, dividends received by a REIT shareholder that are not designated as capital gain dividends or qualified dividend income), subject to certain limitations. Although the reduced U.S. federal income tax rate applicable to qualified dividend income does not adversely affect the taxation of REITs or dividends payable by REITs, the more favorable rates applicable to regular corporate qualified dividends and the reduced corporate tax rate could cause certain non-corporate investors to perceive investments in REITs to be relatively less attractive than investments in the stocks of non-REIT corporations that pay dividends, which could adversely affect the value of the shares of REITs, including our stock.
We cannot guarantee that any share repurchase program will be fully consummated or will enhance long-term stockholder value, and share repurchases could increase the volatility of our stock prices and could diminish our cash reserves.
50
We may engage in share repurchases of our common stock and preferred stock from time to time in accordance with authorizations from the Board of Directors. Our repurchase program does not have an expiration date and does not obligate us to repurchase any specific dollar amount or to acquire any specific number of shares. Further, our share repurchases could affect our share trading prices, increase their volatility, reduce our cash reserves and may be suspended or terminated at any time, which may result in a decrease in the trading prices of our stock.
Holders of our preferred stock have limited voting rights.
The voting rights of holders of any series of our outstanding preferred stock are limited. Our common stock is the only class of our securities that currently carries full voting rights. Holders of any series of our preferred stock may vote only (i) to elect, voting together as a single class, with holders of parity stock having similar voting rights two additional directors to our Board of Directors if six full quarterly dividends (whether or not consecutive) payable on any series of our preferred stock are in arrears, (ii) on amendments to our charter, including the articles supplementary designating any series of our outstanding preferred stock, that materially and adversely affect the rights of the holders of such series or (iii) to authorize or create, or increase the authorized or issued amount of, additional classes or series of stock ranking senior to our outstanding preferred stock.
Item 1B. Unresolved Staff Comments
None.
Item 1C. Cybersecurity
Risk Management and Strategy
We have a risk management process and strategy in place for assessing, identifying, and managing material risks from cybersecurity threats. Our cybersecurity risk management framework is closely aligned with the National Institute of Standards and Technology’s (“NIST”) Cybersecurity Framework (“CSF”) and is incorporated into our enterprise risk management process, information systems, vendor engagement process and employee training programs. We focus on people, processes and technology to build a defensive posture against cybersecurity threats that minimizes disruption to our business while maximizing the security and resiliency of the organization.
We believe that one of the first lines of defense against cybersecurity threats is our employees. Accordingly, we require all new employees to complete cybersecurity training. In addition, we provide quarterly cybersecurity training to existing employees, conduct simulated phishing tests, and perform security awareness proficiency assessments to create more effective and targeted training campaigns to strengthen the human firewall. We also require our employees to annually re-affirm adherence to company-wide IT and related policies designed to protect our information and communications systems. As part of our cybersecurity risk management process, we also conduct third-party led tabletop exercises to practice and prepare to respond to a confirmed or suspected security incident and to highlight any areas for potential improvement.
Our cybersecurity vendors are increasingly incorporating artificial intelligence and machine learning technologies into their products to enhance threat detection, prevention, and response capabilities. These technologies are designed to analyze large volumes of data, identify anomalous behavior, and detect potential threats that may not be identifiable through signature-based or rules-based approaches alone. While AI-enabled tools may improve the speed and effectiveness of threat identification and response, their effectiveness depends on the quality of underlying data, model tuning, and ongoing oversight, and such tools may not prevent all cybersecurity incidents. We utilize AI-enabled security capabilities as part of our broader, layered cybersecurity program, in combination with human review and established controls.
We also maintain policies, procedures and governance structures designed to help us identify, assess and respond to cybersecurity risks. We have a written cybersecurity framework that closely aligns with the NIST’s CSF. In addition, we maintain a cyber incident response plan to facilitate our response to cybersecurity incidents and formed an Incident Response Team composed of the Chief Information Security Officer & Head of IT Infrastructure (“CISO”), the Head of Portfolio Analytics, the Chief Legal Officer, the Head of Operations, the Chief Compliance Officer of Advisory Services, the Head of Data Science, the Associate General Counsel, and certain senior IT officers of HomeXpress. The foregoing officers also include within their working teams, non-management employees who are best positioned to identify, assess, respond to and galvanize both internal and third-party resources necessary in the event of a cybersecurity incident. We test the resiliency of our systems through penetration and disaster recovery tests to continually improve our business continuity plans against an ever-changing threat landscape, create redundancies where appropriate for the protection of the Company’s assets, have engaged a security operations center to provide 24/7 monitoring of our environment to detect and respond to suspicious activities in the network, and have cybersecurity insurance. We periodically perform an independent third-party cybersecurity maturity assessment of our
51
systems, policies and procedures focused on the NIST’s CSF and the SEC’s Office of Compliance Inspections and Examinations cybersecurity guidance.
Lastly, we use technology to minimize our exposure to cybersecurity vulnerabilities and promote a safe information and communications systems environment. We avail ourselves of third-party technologies and tools, including tools provided by the Cybersecurity and Infrastructure Security Agency (CISA), other government agencies and third-party cybersecurity experts.
We have completed the integration of the Palisades IT assets into our established cybersecurity programs and information technology general controls. In October 2025, we completed the acquisition of HomeXpress and have initiated the process of integrating its cybersecurity function into our governance framework. This integration includes incorporating legacy HomeXpress personnel into our Incident Response Team. We are conducting comprehensive cybersecurity risk assessments to identify and prioritize remediation efforts and to align HomeXpress’ cybersecurity programs and IT general controls with our existing practices.
Governance
The Incident Response Team and the non-management employees who support the Incident Response Team identify, assess, respond to and coordinate both internal and third-party resources in the event of a cybersecurity incident. In the event of a potentially material cybersecurity event, all members of the Incident Response Team are notified, and a preliminary assessment of the situation is made. Designated individuals within the Incident Response Team notify the Chief Executive Officer, and if the situation so warrants, the Board of Directors, cybersecurity experts, outside counsel and other advisors to help further assess and formulate an appropriate response to the situation and regulatory and other government authorities as applicable and as required by law.
Item 2. Properties
As of December 31, 2025, we do not own any property. Our corporate headquarters is located in leased space at 630 Fifth Avenue, Ste 2400, New York, New York 10111, telephone (212) 626-2300. Our office lease expires in January 2027. We believe that this space is suitable and adequate for our current needs. In addition, we have leases through November 2026, for our off-site back-up facilities and data centers located in Wappingers Falls, New York and Norwalk, Connecticut.
52
As a result of the Palisades acquisition in December 2024, we acquired leases on spaces located at 6001 Bold Ruler Way, Suite 110, Austin, Texas 78746, which runs through December 2026, 401 South 1st Street, Suite 850, Austin, Texas 78704, which runs through March 2035, and 909 Davis Street, Ste 500, Evanston, Illinois 60201, which runs through August 2029.
As a result of the HomeXpress Acquisition, we have acquired leases for HomeXpress’ two primary facilities located in 1936 E Deere Ave, Suite 200, Santa Ana, California 92705, and 4902 Eisenhower Blvd, Suite 155, Tampa, Florida , 33634. HomeXpress’ corporate office is in Santa Ana, California. In 2025, HomeXpress renewed its Santa Ana, California lease and extended it to September 2027. HomeXpress’ lease for Tampa, Florida is active through August 2029.
Our Investment Portfolio segment utilizes the New York City, Wappingers Falls, Norwalk, Austin, and Evanston offices and facilities. Our Residential Origination segment utilizes the Santa Ana and Tampa offices.
Item 3. Legal Proceedings
None.
Item 4. Mine Safety Disclosures
Not applicable.
PART II
Item 5. Market for Registrant's Common Equity, Related Stockholder Matters and Issuer Purchases of Equity Securities
Our common stock began trading publicly on the NYSE under the trading symbol “CIM” on November 16, 2007. As of January 31, 2026, we had 83,402,526 shares of common stock issued and outstanding which were held by 167 holders of record.
Dividends
We pay quarterly dividends and distribute to our stockholders all or substantially all of our taxable income in each year (subject to certain adjustments). This enables us to qualify for the tax benefits accorded to a REIT under the Code. We have not established a set minimum dividend payment level and our ability to pay dividends may be adversely affected for the reasons described under the caption “Risk Factors.” All distributions will be made at the discretion of our Board of Directors and will depend on our taxable income, our financial condition, maintenance of our REIT status and such other factors as our Board of Directors may deem relevant from time to time.
Our Board of Directors declared dividends of $1.48 and $1.42 per share during 2025 and 2024, respectively.
Purchases of Equity Securities
In January 2024, the Company's Board of Directors updated the authorization to include the Company's preferred stock into the Repurchase Program and increased the authorization by $33 million back up to $250 million. Such authorization does not have an expiration date, and at present, there is no intention to modify or otherwise rescind such authorization. Shares of the Company's common stock and preferred stock may be purchased in the open market, including through block purchases, through privately negotiated transactions, or pursuant to any trading plan that may be adopted in accordance with Rule 10b5-1 of the Securities Exchange Act of 1934, as amended, or the Exchange Act. The timing, manner, price and amount of any repurchases will be determined at the Company's discretion and the program may be suspended, terminated or modified at any time, for any reason. Among other factors, the Company intends to only consider repurchasing shares of its common stock and preferred stock when the purchase price is less than the last publicly reported book value per common share. In addition, the Company does not intend to repurchase any shares from directors, officers or other affiliates. The program does not obligate the Company to acquire any specific number of shares, and all repurchases will be made in accordance with Rule 10b-18, which sets certain restrictions on the method, timing, price and volume of stock repurchases.
The company did not repurchase any of its common stock and preferred stock during the year ended December 31, 2025. The approximate dollar of shares that may yet to be purchased under the share repurchase program was $250 million as of December 31, 2025.
53
Share Performance Graph
The following graph and table set forth certain information comparing the yearly percentage change in cumulative total return on our common stock to the cumulative total return of the Standard & Poor’s Composite-500 Stock Index or S&P 500 Index, and the iShares Mortgage Real Estate ETF, an industry index of mortgage REITs. The comparison is for the period from December 31, 2020 to December 31, 2025 and assumes the reinvestment of dividends.
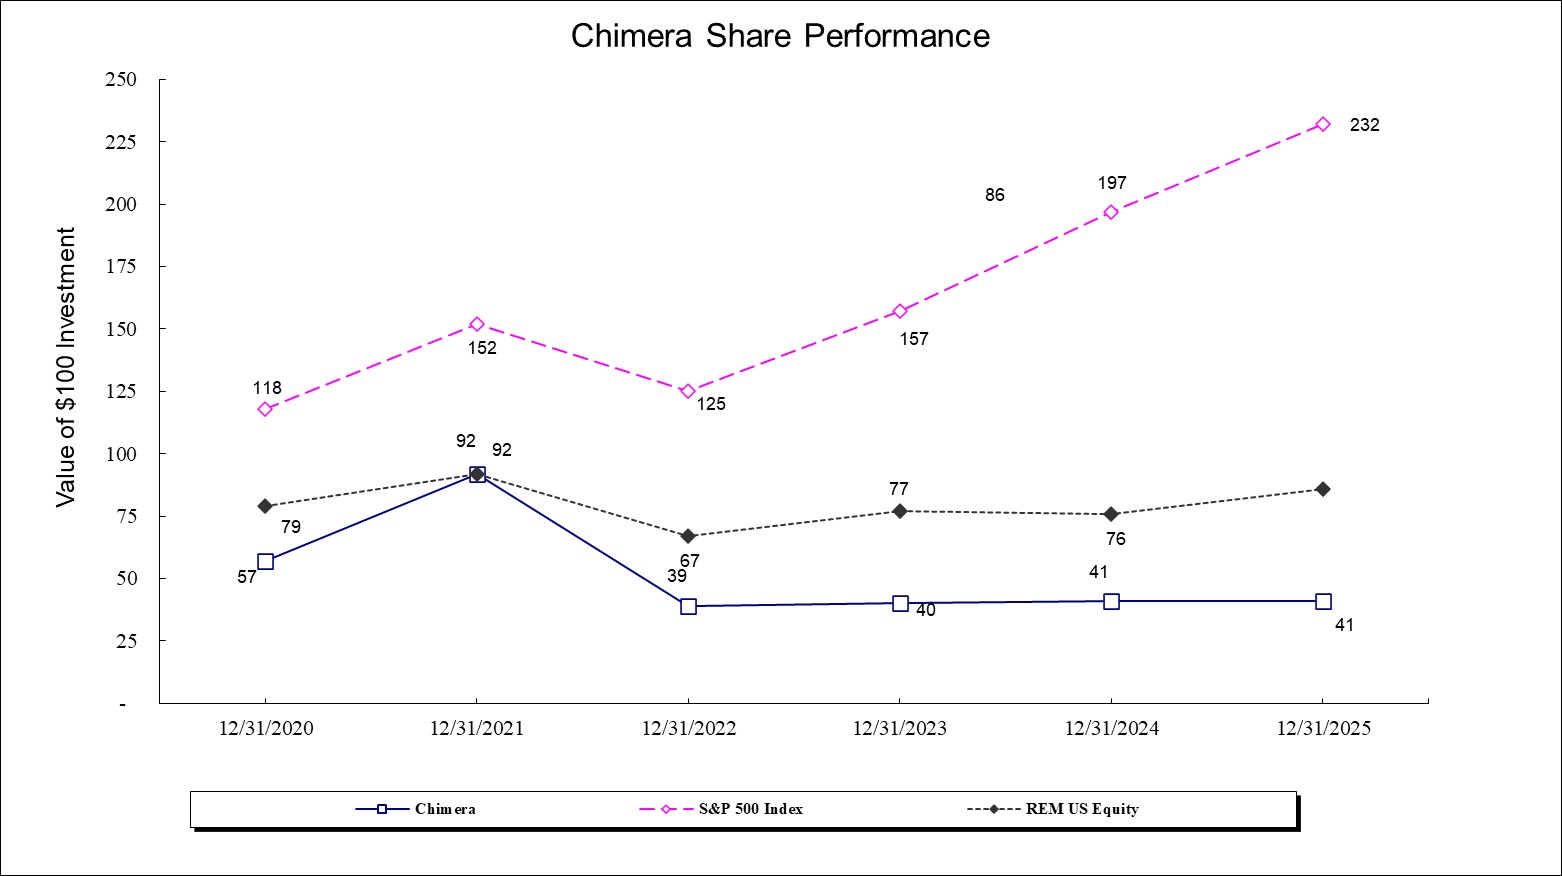
| 12/31/2020 | 12/31/2021 | 12/31/2022 | 12/31/2023 | 12/31/2024 | 12/31/2025 | |||||||||||||||
| Chimera | 57 | 92 | 39 | 40 | 41 | 41 | ||||||||||||||
| S&P 500 Index | 118 | 152 | 125 | 157 | 197 | 232 | ||||||||||||||
| iShares Mortgage Real Estate ETF | 79 | 92 | 67 | 77 | 76 | 86 | ||||||||||||||
The information in the share performance graph and table has been obtained from sources believed to be reliable, but neither its accuracy nor its completeness can be guaranteed. The historical information set forth above is not necessarily indicative of future performance. Accordingly, we do not make or endorse any predictions as to future share performance.
The share performance graph and table shall not be deemed, under either the Securities Act of 1933, as amended (the “Securities Act”), or the Exchange Act, to be (i) “soliciting material” or “filed” or (ii) incorporated by reference by any general statement into any filing made by us with the SEC, except to the extent that we specifically incorporate such share performance graph and table by reference.
Item 6. RESERVED
54
Item 7. Management's Discussion and Analysis of Financial Condition and Results of Operations
The following discussion of our financial condition and results of operations should be read in conjunction with the consolidated financial statements and notes to those statements included in Part IV of this 2025 Form 10-K. The discussion may contain certain forward-looking statements that involve risks and uncertainties. Forward-looking statements are those that are not historical in nature. As a result of many factors, such as those set forth under “Risk Factors” in this 2025 Form 10-K, our actual results may differ materially from those anticipated in such forward-looking statements.
This section of the 2025 Form 10-K generally discusses 2025 and 2024 items and year-to-year comparisons between 2025 and 2024. Discussions of 2023 items and year-to-year comparisons between 2024 and 2023 that are not included in this 2025 Form 10-K, can be found in “Management’s Discussion and Analysis of Financial Condition and Results of Operations” in Part II, Item 7 of our Annual Report on Form 10-K for the fiscal year ended December 31, 2024.
Executive Summary
We are a diversified real estate company that invests in, originates, and manages primarily residential real estate assets. The assets we may invest in and manage for others, through our wholly-owned subsidiary PAS, include residential mortgage loans, Non-Agency RMBS, Agency RMBS, business purpose loans (including RTLs) and investor loans, MSRs and other real estate-related assets such as Agency CMBS, junior liens and HELOCs, equity appreciation rights, and reverse mortgages. Also, through our wholly-owned subsidiary, HomeXpress, we originate consumer Non-QM and investor business purpose residential mortgage loans as well as QM residential mortgage loans.
In 2025, we reevaluated the composition of our reportable segments based on changes in the significance of certain business activities, including the acquisition of HomeXpress, and the manner in which our management reviews operating results and allocates resources. As a result of this reevaluation, we report as two reportable segments: (i) Investment Portfolio, and (ii) Residential Origination. The Investment Portfolio segment consists of our investments and third-party advisory services activities. The Residential Origination segment consists of the stand-alone mortgage origination business of HomeXpress that originates consumer Non-QM, investor business purpose, and other Non-Agency and Agency mortgage loan products.
Investment Portfolio Segment
As of December 31, 2025, based on the fair value of our interest earning assets, approximately 65% of our investment portfolio was allocated to residential mortgage loans, 23% to Agency MBS, 5% to Non-Agency RMBS and less than 1% to interests in MSR financing receivables (excluding loans held for sale by HomeXpress). As of December 31, 2024, based on the fair value of our interest earning assets, approximately 88% of our investment portfolio was allocated to residential mortgage loans, 4% to Agency RMBS, and 8% to Non-Agency RMBS.
We utilize a variety of channels, including securitizations, warehouse facilities, repurchase agreements and other capital market activities to finance our investments, manage liquidity, improve capital efficiency, support the implementation of our investment strategies, as well as to enhance our potential return on equity. We manage interest rate risk using hedging instruments such as interest rate swaps, swap futures, treasury futures, swaptions, and interest rate caps.
Our investment strategy is intended to be durable across a variety of economic, rate, and credit environments. We seek to approach portfolio management in a disciplined manner and expect to operate in an environment characterized by ongoing uncertainty related to global trade dynamics, fiscal and monetary policy, inflation, labor market conditions, economic growth, and domestic and geopolitical tensions.
Residential Origination Segment
During the fourth quarter we completed the HomeXpress Acquisition, which closed on October 1, 2025. We raised liquidity through staggered sales of select assets, some of which we sourced from our Agency RMBS liquidity allocation and the rest from what we viewed to be fully priced Non-Agency RMBS positions. Separately, we also issued unsecured debt.
The HomeXpress Acquisition represents a strategically significant milestone and broadens our business capabilities. We expect that this acquisition will provide us with direct exposure to the growing residential consumer Non-QM and investor business purpose mortgage loan origination market and will enhance the diversification of our earnings sources beyond our core investment activities. As of December 31, 2025, loans held for sale by HomeXpress constituted approximately 6% of our interest earning assets based on fair value.
HomeXpress is a specialty mortgage lender focused primarily on providing first lien, consumer Non-QM loans, and investor business purpose solutions to the residential housing market on a national basis through mortgage brokers and bankers. Non-
55
QM loans are designed for borrowers who do not meet traditional qualified mortgage standards and typically carry higher interest rates and offer more flexible solutions for potential borrowers. Investor business purpose loans are secured by first liens on non-owner occupied 1–8 unit investment rental properties. HomeXpress is a leading originator of these residential mortgage loans and does so substantially on a wholesale basis through independent mortgage brokers and bankers. HomeXpress currently sells all the loans it originates on a servicing-released basis to third-party institutional investors. Warehouse financing is used by HomeXpress to fund these loans from origination through sale. While the residential real estate market and associated mortgage loan origination volumes are heavily influenced by economic factors such as interest rates, housing prices and employment conditions, additional loan origination growth for HomeXpress is expected to be realized from further development of its existing wholesale origination network as well as from the growth in its recent implementation of a non-delegated correspondent channel. Additional growth is also expected from expansion in its FHA, VA and conventional agency-conforming channel and the implementation of delegated correspondent lending platform.
For a full description of our business, see Part 1 – Business in this Annual Report on Form 10-K.
Market Conditions and our Strategy
Interest Rates, Inflation, Labor Markets, and Economic Activity
Interest rates across the U.S. Treasury curve fluctuated throughout the year as market expectations regarding the timing and magnitude of policy easing evolved in response to incoming inflation, labor, and economic data. Short-term interest rates declined over the course of the year alongside expectations for easing monetary policy, while longer-term Treasury yields declined more slowly reflecting continued inflation uncertainty and term-premium dynamics.
Inflation, as measured by the Consumer Price Index (“CPI”), moderated at times during the year but remained above the Federal Reserve’s stated 2.0% objective. CPI inflation ranged between 2.3% and 3.0% on a year-over-year basis during 2025 and ended the year at 2.7%. Shelter costs continued to be a significant contributor to overall inflation, with rates of increase that generally exceeded those of goods and energy prices.
Labor market conditions moderated over the course of the year but remained relatively resilient. The unemployment rate increased to 4.4% at year-end, but still remained historically low, while job gains and broader indicators pointed to an easing labor market trajectory. Economic activity remained solid as real gross domestic product increased at an annualized rate of 3.8% in the second quarter and 4.4% in the third quarter of 2025.
With this backdrop, the Federal Reserve held short term rates steady through the first half of 2025 and eased 25 basis points at each of the final three Federal Open Market Committee meetings, bringing the yearend federal funds target range between 3.50% and 3.75%.
Consistent with these dynamics, the yield curve evolved with a steepening bias during 2025. The two-year Treasury yield dropped 77 basis points during the year to 3.47%, while the ten-year yield declined just 39 basis points, resulting in the yield curve steepening by 38 basis points during 2025.
Housing Market
U.S. housing market conditions in 2025 were shaped by continued affordability challenges and an ongoing imbalance between housing supply and demand. While mortgage interest rates, home prices, insurance costs, and property taxes continued to pressure homebuyer affordability, several of the largest drivers showed signs of easing over the course of the year.
According to the Freddie Mac Primary Mortgage Market Survey, the average 30-year fixed mortgage rate declined from 6.85% at the beginning of the year to 6.15% at year-end, a decrease of approximately 70 basis points, with most of the decline occurring in the second half of 2025.
Housing supply conditions remained constrained, particularly in the existing home market, as elevated mortgage rates continued to limit homeowner mobility. Existing home inventory increased modestly during the year but remained below long-term averages. In contrast, new home supply and construction remained relatively more active. Homebuilders continued to support transaction volumes through the use of mortgage rate buydowns and other incentives, which helped offset affordability pressures and support new home sales despite higher headline financing costs.
Home price growth moderated relative to prior years, and year-over-year national home price appreciation ended the year below consumer wage growth, representing a step toward easing affordability challenges.
56
Execution of Our Strategy in 2025
During 2025, we focused on diversifying the portfolio and repositioning the Company as a diversified, vertically integrated residential real estate platform. To execute on these objectives, we exercised redemption rights with respect to several securitized transactions and raised capital organically through re-securitizations of the underlying mortgage loans and loan sales to third parties. We also raised capital through monetizing certain fully valued assets as well as through the issuance of senior unsecured debt. These activities provided the capital necessary as we expanded our platform and mortgage lending capabilities through the acquisition of HomeXpress, increased our allocation to liquid Agency RMBS, made our first investment in MSRs, and began to reshape our allocation of capital, investment mix, and sources of income and earnings.
Full Year and Fourth Quarter 2025 Business Highlights - Investment Portfolio Segment
Investment Activity
Asset Purchases
Agency RMBS. Predominantly starting with the second quarter and through the rest of the year 2025, we purchased approximately $4.3 billion of Agency RMBS, taking advantage of relative value opportunities while simultaneously increasing our liquid securities allocation. These investments allow us to deploy capital in a relatively expedient manner upon raising funds through capital market transactions, asset divestitures, portfolio run-off, or other means and enable us to maintain liquidity that we can access for future investments or other strategic objectives, including business acquisitions. During the fourth quarter we added $606 million of Agency RMBS, net of sales.
MSR Investment. During the third quarter, we gained exposure to a $6.5 billion pool of Fannie Mae MSRs through a third-party servicing partnership. The weighted average interest rate on the loans at the time of acquisition was 4.02% and the weighted average LTV ratio and borrower credit score was 71% and 754, respectively. The purchase price for this investment was $38 million, which represented the net asset value after financing the MSRs by the mortgage loan servicing counterparty. Because MSR valuations typically increase as interest rates rise, offsetting mark-to-market declines on our residential credit portfolio, the MSR allocation is intended to serve as a natural book value hedge to our portfolio. In addition to its hedging characteristics, MSRs are also standalone, income generating assets. The recurring servicing fees, ancillary income, recapture income and float earnings associated with MSRs contribute to earnings while diversifying our interest rate exposure.
RTL Loans. We settled $27 million of business purpose loans during the second quarter that we committed to purchase in the first quarter, funded with warehouse facilities and targeting mid-to-high teen levered returns. These loans were purchased with a weighted average asset yield of 8.46%. We did not purchase any additional RTL loans during the rest of the year.
Asset Sales
Agency CMOs. During the second quarter, we sold Agency CMO securities for $73 million. In addition, we also sold previously purchased Agency RMBS Pass-through securities for $53 million and reallocated the capital to our current portfolio strategy. We received a total of $138 million in net proceeds from this sale and a total of $98 million after paying the financing on these positions. These sales resulted in a net realized loss of $2 million during the quarter, not including any net realized interest income. Proceeds from the sales were largely re-invested in Agency RMBS that increased our liquidity allocation.
Non-Agency and CMBS IO securities. In the third quarter, we also sold $104 million of Non-Agency RMBS subordinate securities, $88 million of Non-Agency RMBS senior securities and $164 million of Agency CMBS IO positions. Net liquidity raised after payment of principal on a secured financing facility that held these securities as collateral was $44 million. These sales generated a realized loss of $8.4 million during the third quarter. In the fourth quarter, we sold $33 million of Non-Agency RMBS subordinate securities. These sales generated a realized loss of $5 million during the fourth quarter.
Non-Agency retained securities. During the third quarter, we sold $237 million of retained bonds from previously issued RPL securitizations and $25 million from previously issued Non-QM and investor securitization for total proceeds of $232 million. Consequently, the retained positions sold will be added to securitized debt as a result of consolidation going forward. Net liquidity raised after payment of principal on a secured financing facility that held these retained bonds as collateral was $72 million.
Non-QM investment loans sales. As a normal discipline of our business operation, we routinely evaluate the potential economic and portfolio benefits of exercising our redemption rights with respect to our sponsored securitizations. These rights provide us with the option to organically raise liquidity by refinancing and/or selling the underlying loans. Through this strategy, during the fourth quarter we redeemed $70 million in securities from the CIM 2022-I1 securitization and sold the
57
underlying loans with principal balance of $166 million. After satisfying certain recourse financing obligations, the transaction released approximately $28 million in equity.
Securitization Activity
On January 31, 2025, we sponsored CIM 2025-I1, a $288 million securitization of residential mortgage investor loans. The loans had a weighted average coupon of 7.9%, weighted average FICO scores of 748, and LTV ratio of 64%. Securities issued by CIM 2025-I1, with an aggregate balance of approximately $276 million, were sold in a private placement to institutional investors. These senior securities represented approximately 95.8% of the capital structure. We also retained an option to call the securitized mortgage loans on the earlier of (i) February 25, 2028, or (ii) when the unpaid principal balance is less than or equal to 30% of the unpaid principal balance of the securitized mortgage loans as of the cut-off date. The weighted average cost of debt on securities sold was 5.8%. The securitization is rated by Fitch and Morningstar DBRS. PAS is the asset manager for the securitization.
During the first quarter, we redeemed securities in seven outstanding securitizations and sponsored two new securitizations as further detailed below. The net result of these transactions enabled us to organically generate in excess of $187 million in capital for new investments, while moderately lowering our cost of financing by 17 basis points from a weighted average cost of 6.21% from the seven terminated securitizations to a 6.04% weighted average cost on the two new securitizations. Below we describe these transactions in more detail.
On March 25, 2025, we sponsored two securitizations of residential mortgage loans with an aggregate principal balance of $646 million. The mortgage loans for both securitizations were sourced from the redemption of prior Chimera-sponsored securitizations, including CIM 2021-NR1, CIM 2021-NR2, CIM 2021-NR3, CIM 2021-NR4, CIM 2022-NR1, CIM 2023-NR1, and CIM 2023-NR2.
CIM 2025-R1 was a $392 million securitization of residential mortgage loans. The loans had a weighted average coupon of 5.74%, weighted average FICO scores of 636, and LTV ratio of 50.80%. Securities issued by CIM 2025-R1, with an aggregate balance of approximately $333 million, were sold in a private placement to institutional investors. These senior securities represented approximately 85% of the capital structure. We retained subordinate interests in securities with an aggregate balance of approximately $59 million and certain IOs. We also retained an option to call the securitized mortgage loans on the earlier of (i) March 25, 2027 or (ii) when the aggregate principal amount of the offered notes is less than, or equal to, 10% of the aggregate principal amount of the offered notes as of March 25, 2025. The weighted average cost of debt on securities sold was 5.74%. PAS is the asset manager for the securitization.
CIM 2025-NR1 was a $254 million securitization of residential mortgage loans. The loans had a weighted average coupon of 5.67%, weighted average FICO scores of 597, and LTV ratio of 61.61%. Securities issued by CIM 2025-NR1, with an aggregate balance of approximately $184 million, were sold in a private placement to institutional investors. These senior securities represented approximately 72.50% of the capital structure. We retained subordinate interests in securities with an aggregate balance of approximately $70 million. We also retained an option to call the securitized mortgage loans, at the direction of the majority class B1 certificate holder, beginning on March 25, 2026. The weighted average cost of debt on securities sold was 6.59%. PAS is the asset manager for the securitizations.
Secured Financing Activity
During the first quarter of 2025, we exited a maturing $104 million non-MTM secured facility and separately entered into a new non-MTM secured facility with a principal amount of $167 million that will mature in 18 months in July 2026. The interest rate on the new facility was 412.5 basis points lower than the maturing facility.
In addition, we extended a maturing $407 million non-MTM secured facility by an additional 24 months to February 2027. The old facility had a spread of 375 basis points over SOFR with a maximum rate of 8.75%. The new facility has two separate terms: (i) an approximately $283 million financing facility with a fixed rate of 8.15%, and (ii) an approximately $136 million floating-rate facility at a rate of SOFR +425 basis points.
During the fourth quarter of 2025, our secured financing costs overall declined by 43 basis points for the quarter and 158 basis points for the year, and our secured financing agreements (recourse liabilities) increased by a net $352 million for the quarter, reflecting the deployment of leverage to support our Agency RMBS activities. While the purchase of Agency RMBS securities increased toward the end of the year, our Non-Agency RMBS financing saw a decrease of approximately $74 million during the quarter and $78 million during the year due to asset sales and paydowns.
As of December 31, 2025, we had no outstanding warehouse financing exposure (recourse liabilities) backed by residential mortgage loans, other than a $67 million facility related to business purpose loans for the Investment Portfolio segment.
58
At the end of the year, our total recourse financing exposure on our investment portfolio was $5.2 billion. We continue to seek opportunities to finance our retained notes from securitizations with long-term, limited, or, when conditions are appropriate, non-MTM financing facilities. We currently have $1.3 billion, or 25%, of our recourse financing with these types of facilities.
Hedging Activity
Residential Credit Portfolio. We continued to maintain our strategy of using interest rate derivatives to mitigate the impact of interest rates on our future financing costs and protect against the potential for higher interest rates eroding our earnings and dividend paying ability. Our hedging strategy in our residential credit portfolio seeks to limit the impact of higher short-term interest rates, while maintaining optionality in the event interest rates decline in the future.
As of December 31, 2025, we maintained open interest rate hedge positions attributable to the residential credit portfolio that included: (i) a $500 million 3.45% pay-fixed interest rate swap maturing in January 2026, (ii) a $1.0 billion interest rate cap with a strike rate of 3.95% maturing in February 2027, (iii) $50 million 4.05% par rate equivalent pay-fixed two-year Eris swap futures maturing in March 2027, (iv) a $300 million two-year 3.40% pay fixed rate swaption that expires in January 2027, and (v) a $300 million two-year 3.17% pay fixed rate swaption that expires in February 2027.
Agency RMBS Portfolio. Interest rate swaps and swaptions are valuable tools for managing the interest rate and prepayment risks associated with levered Agency RMBS. By strategically using these derivatives, we seek to mitigate these risks, stabilize cash flows, and potentially enhance the overall risk-adjusted returns of the Agency RMBS portfolio. During the quarter, we executed a variety of interest rate derivative transactions across a range of tenors, including $1.7 billion in pay-fixed interest rate swaps. We also closed out interest rate swaps with a range of maturities and underlying swap tenors representing notional balances of $951 million that resulted in net realized loss of $16 million.
As of December 31, 2025, we maintained open interest rate hedge positions attributable to the Agency RMBS portfolio that included: (i) $3.0 billion 3.44% average pay-fixed interest rate swaps with varying maturities, (ii) $60 million 3.87% par rate equivalent pay-fixed ten-year Eris swap futures maturing in June 2035 and $230 million 3.60% par rate equivalent pay-fixed five-year Eris swap futures maturing in June 2030.
Loan Acquisitions. Considering the velocity and magnitude of interest rate movements, we maintain a hedging program to manage the interest rate risk for the time differential between loan purchase commitment and the closing of loans into securitization. We use a combination of various U.S. Treasury futures contracts to hedge our exposure to future financing costs. Our hedging techniques attempt to mitigate the interest rate risk but do not capture the impact of credit spread risk. We did not have any loan commitments or related futures hedges as of the end of the quarter.
Capital Raising Activity
In September, we issued $120 million of 8.875% unsecured senior notes due August 15, 2030. Net of underwriting fees and offering expenses, we received approximately $116 million in proceeds. These notes may be redeemed, in whole or in part, at any time, from time to time, at our option on or after August 15, 2027. While we continue to favor securitized debt as a source of financing for our assets, the ability to issue unsecured debt helps us to further diversify our capital structure and provides long-term financing to support our investment activities. This was our third overall unsecured bond offering over the past two years, resulting in a combined total issuances of approximately $260 million.
Investment and third-party asset management and advisory fees
Through the Palisades Acquisition in December 2024, we started earning investment management and advisory fees. In addition, PAS was hired to provide asset management services for three securitizations issued by Chimera during the year, and we continue to provide services to unaffiliated investors and private credit funds. Palisades’ fee-based income (both transaction and advisory fees) contributed $9 million in revenue during the fourth quarter and $35 million for the full year 2025.
Acquisition of HomeXpress
On October 1, 2025, we completed the acquisition of HomeXpress for total consideration of $272 million, which consisted of (i) cash of $124 million, representing the Adjusted Book Value of HomeXpress as of September 30, 2025, (ii) cash premium of $120 million, and (iii) issuance of 2,077,151 shares of our common stock.
59
Fourth Quarter 2025 Business Highlights - Residential Origination Segment
HomeXpress’ loan origination strategy is focused on providing consistent high-quality service to its network of independent mortgage brokers and bankers and having an agile and responsive approach to shifts in market demand for its loan products, institutional investor appetite and regulatory environments. We expect continued growth in loan originations to come from further penetration of HomeXpress’ existing independent mortgage brokers network and the development of new relationships with them and non-delegated correspondent lenders. Our business strategy is also focused on driving loan origination process and operational efficiencies through our customized technology and risk assessment framework so that we can control and enhance the cost of originating our loans. HomeXpress currently sells all the loans it originates on a servicing-released basis to third-party institutional investors for cash premiums. Warehouse financing is used by HomeXpress to fund these loans from origination through sale.
During the fourth quarter of 2025, HomeXpress originated 2,516 mortgage loans for approximately $1.0 billion in principal balance for an average loan balance produced of approximately $412 thousand. Substantially all these loans were consumer Non-QM and investor business purpose loans with approximately 3.7% being FHA, VA and conventional agency-conforming loans. The weighted average interest rate, FICO score and loan-to value on these loans were 7.13%, 739 and 71.6%, respectively.
| As of | ||||||||
| December 31, 2025 | ||||||||
| (dollars in thousands) | % total | |||||||
| Unpaid principal balance ("UPB") of mortgage loans originated: | ||||||||
| Consumer Non-QM and investor business purpose loans originated | $ | 997,991 | 96.2 | % | ||||
| FHA, VA, Conventional and Jumbo loans originated | 39,061 | 3.8 | % | |||||
| UPB of loans originated | $ | 1,037,052 | 100.0% | |||||
Secured Financing Activity
HomeXpress maintained a sufficient overall liquidity position during the fourth quarter of 2025 with its cash balances and seven warehouse lines of credit. HomeXpress had a total available capacity of $1.4 billion in warehouse lines as of December 31, 2025, which are all priced utilizing a base pricing of the 30-day SOFR plus a weighted pricing spread of approximately 197 basis points. As of December 31, 2025, HomeXpress held $872 million on unpaid principal balance on the balance sheet that was financed with $802 million of advances from the warehouse lines of credit, with an average advance rate of 92%.
Hedging Activity
Prior to funding a loan, HomeXpress typically enters into an IRLC with the prospective borrower. This IRLC is accounted for as a derivative asset and is valued based on market conditions, loan characteristics, estimated remaining direct expenses, and subject to the anticipated loan funding probability (the “Pull-through Rate”). As of December 31, 2025, the fair value of HomeXpress’ IRLC asset was $4 million. Upon funding of a locked loan, the IRLC is derecognized and the loan is recorded as LHFS at fair value, with origination fees recognized in interest income and direct loan origination costs expensed as incurred. As of December 31, 2025, the total fair value of HomeXpress’ LHFS was $24 million. HomeXpress operates a daily hedging program that utilizes financial instruments (2-year and 5-year U.S. Treasury futures) in an effort to protect its operational results from interest rate risk. The program covers loans from the day the IRLC is issued through the day a loan is committed for sale to an investor. As of December 31, 2025, HomeXpress had hedging instruments with a notional amount of $173 million for U.S. Treasury futures and $199 million for IRLC.
For the fourth quarter of 2025, HomeXpress reported net income of $8 million, inclusive of gain on origination and sale of loans, net, of approximately $21 million, net interest income of $3 million, total operating expenses of approximately $12 million, and amortization of intangibles and depreciation expense of approximately $3 million. Net income, excluding amortization of intangibles and depreciation, resulted in fourth quarter operating income of approximately $11 million. The operating income represented 111 basis points of HomeXpress’ loan origination volume for the quarter.
Operating expenses
Investment Portfolio Segment
Compensation and benefits expenses decreased by $6 million to $8 million during the fourth quarter, primarily due to lower performance-related expense accruals in the current quarter. For the full year 2025, compensation and benefits expenses
60
increased by $5 million to $46 million from $41 million in the prior year, reflecting the inclusion of staffing costs from the Palisades Acquisition in December 2024.
Servicing expenses decreased by $1 million during the fourth quarter of 2025 to $6 million from $7 million in the prior quarter, due to lower loan balances and loan counts related to our portfolio reallocation strategy.
For the full year 2025, G&A expenses increased by $5 million to $28 million compared to $23 million in the prior year, driven primarily by the inclusion of a full year of G&A expenses related to Palisades following the acquisition in December 2024.
Transaction expense was $625 thousand for the fourth quarter of 2025, reflecting additional costs incurred related to the HomeXpress Acquisition. For the full year, we recorded transaction expense of $17 million related to the HomeXpress Acquisition, reflecting an increase of $10 million from the prior year.
Residential Origination Segment
We recognized compensation and benefits of $10 million for our Residential Origination segment for the quarter and year ended December 31, 2025, following the acquisition of HomeXpress on October 1, 2025. We recognized G&A expenses of $2 million for our Residential Origination segment for the quarter and year ended December 31, 2025, following the acquisition of HomeXpress on October 1, 2025. No such expenses were recognized in the prior reporting periods.
Inducement Grants for HomeXpress employees
On September 19, 2025, the Compensation Committee of the Board of Directors (the “Compensation Committee”) approved grants of restricted stock units (“RSUs”), effective October 1, 2025, representing an aggregate of up to 540,000 shares of our common stock, of which 533,391 were granted, under the Chimera Investment Corporation 2025 Inducement Award Plan (the “Award Plan”) to up to 300 individuals offered employment with Chimera in connection with our acquisition of HomeXpress.
In accordance with NYSE Rule 303A.08, the grants were made exclusively to individuals employed by HomeXpress at the time as a material inducement to such individual’s continued service following our acquisition of HomeXpress. The Award Plan reserves up to 540,000 shares of our common stock to be used for inducement grants.
Each grant of RSUs will generally vest in full upon the third anniversary of the grant date, subject to the recipient’s continued service through such vesting date. All of the RSU awards are subject to the terms of the Award Plan and the grant agreements covering such awards.
Earnings and Book Value
During 2025, we diversified our portfolio and positioned it to maintain flexibility and to meet liquidity needs as they arise. In parallel, we continued to evaluate and execute selective asset dispositions related to investments that we believe to be fully valued, not meeting our risk-adjusted return objectives, and/or are no longer consistent with our long-term portfolio objectives. These asset sales were comprised primarily of retained securities from sponsored securitizations and Non-Agency RMBS, with proceeds being redeployed into higher-returning investments to enhance our earnings power, dividend paying ability, and return on equity. We also continue to grow our sources of income, a growth that began with the Palisades Acquisition and continued with the HomeXpress Acquisition that closed on October 1, 2025.
During the quarter, spreads on mortgage loans were relatively unchanged from the third quarter while securitized products continued to tighten. Spread tightening and a steeper yield curve had a more pronounced effect on the bonds issued through our securitization programs than in the underlying mortgage loan assets that we consolidate. As a result, the fair value of our securitized debt liabilities increased more than the fair value of the related mortgage loans.
This dynamic, along with elevated transaction during the fourth quarter, contributed to a decrease in book value per share of 2.7%, to $19.70 as of December 31, 2025, as compared to $20.24 in the prior quarter. For the year ended December 31, 2025, our book value per common share remained relatively unchanged at $19.70, as compared to $19.72 for the year ended December 31, 2024. We declared $1.48 common stock dividends per share in 2025. Our economic return on book value, which includes the overall change in book value for the period plus dividends, was (0.9)% for the fourth quarter and 7.4% for the full year of 2025.
61
Strategy Outlook
We continue to focus on building a diversified residential platform that can generate income from assets, gains on sale, and fees from operations with the long-term goal of growing both dividends and overall business value. Specifically, we will continue to look for opportunities to grow and diversify our portfolio, increase liquidity and grow our fee-based income revenue streams.
With respect to our portfolio, while we intend to continue to look for opportunities to securitize mortgage loans (whether we manufacture or acquire the loans), we expect to grow our Agency RMBS and MSR portfolios. In addition to supporting our regulatory compliance, we believe that a larger Agency RMBS portfolio will provide portfolio diversity, more stable dividends, a source of liquidity for opportunistic asset and business acquisitions, as well as allowing us to grow our fee-based operations, and protection in periods of volatility. We also intend to look at opportunities to acquire additional MSRs, which we believe will help hedge our loan portfolio, as well as provide a diverse source of income for our dividends.
With the HomeXpress and Palisades acquisitions, we have embarked on our strategy of enhancing returns to our shareholders through diversification of revenue from fee-based income. As we move into 2026 and beyond, we will look for opportunities to grow our residential operating platform both organically and through acquisitions. We believe that HomeXpress is well positioned to grow originations in 2026 and we will continue to assess the strategy of selling versus retaining the loan production volume of HomeXpress, considering how it affects our short-term results and long-term earnings potential. HomeXpress views its loan origination volumes, its loan sale premiums and its cost efficiency to be its key performance indicators and uses these to measure management’s effectiveness in realizing its objectives. With respect to our non-discretionary advisory business, we anticipate heightened competition may pressure client flow volumes which may lead to margin compression across existing and potential client relationships. We will however, continue to navigate through the market challenges and look to maintain and/or grow our non-discretionary investment management and advisory services through a combination of organic and external growth, depending on opportunities and market conditions.
We will continue to seek other opportunities to acquire platforms that we believe will be synergistic and accretive. We believe such opportunities exist and expect acquisitions to continue to be a source of growth and diversification.
Funds for these portfolio diversification and growth initiatives will come from both our existing portfolio, as we return to our re-lever strategy, and the capital markets. We expect to call, and if market conditions are appropriate, either sell loans or re-securitize our NR securitizations, as well as some of our R securitizations, in 2026. Our ability to call and either sell or resecuritize the loans, as well as access the capital markets will depend on a number of factors, including the breakeven economic re-investment rate, relative value opportunity and liquidity needs, among others.
Business Operations
Net Income Summary
The table below presents our net income on a GAAP basis for the years ended December 31, 2025, 2024, and 2023.
62
| Net Income | |||||||||||
| (dollars in thousands, except share and per share data) | |||||||||||
| For the Years Ended | |||||||||||
| December 31, 2025 | December 31, 2024 | December 31, 2023 | |||||||||
| Net interest income: | |||||||||||
Interest income (1) | $ | 821,343 | $ | 760,950 | $ | 772,904 | |||||
Interest expense (2) | 554,924 | 496,274 | 509,541 | ||||||||
| Net interest income | 266,419 | 264,676 | 263,363 | ||||||||
| Increase in provision for credit losses | 15,705 | 9,838 | 11,371 | ||||||||
| Other income (losses): | |||||||||||
| Net unrealized gains (losses) on derivatives | 10,371 | 2,963 | (6,411) | ||||||||
| Realized losses on derivatives | (33,352) | (21,540) | (40,957) | ||||||||
| Periodic interest on derivatives, net | 20,375 | 23,780 | 17,167 | ||||||||
| Net gains (losses) on derivatives | (2,606) | 5,203 | (30,201) | ||||||||
| Investment management and advisory fees | 35,382 | 2,710 | — | ||||||||
Interest income from investment in MSR financing receivables, net (3) | 520 | — | — | ||||||||
| Net unrealized gains on financial instruments at fair value | 81,735 | 10,811 | 34,373 | ||||||||
| Net realized losses on sales of investments | (23,192) | (5,219) | (31,234) | ||||||||
| Gains on extinguishment of debt | 2,142 | — | 3,875 | ||||||||
| Other investment gains | 5,733 | 9,543 | 1,091 | ||||||||
| Gain on origination and sale of loans, net | 20,590 | — | — | ||||||||
| Total other income (losses) | 120,304 | 23,048 | (22,096) | ||||||||
| Other expenses: | |||||||||||
Compensation and benefits (4) | 56,702 | 41,364 | 30,570 | ||||||||
| General and administrative expenses | 29,995 | 23,201 | 25,117 | ||||||||
| Servicing and asset manager fees | 27,737 | 29,795 | 32,624 | ||||||||
| Amortization of intangibles and depreciation expenses | 7,183 | 321 | — | ||||||||
| Transaction expenses | 16,634 | 7,091 | 15,379 | ||||||||
| Total other expenses | 138,251 | 101,772 | 103,690 | ||||||||
| Income before income taxes | 232,767 | 176,114 | 126,206 | ||||||||
| Income taxes | 2,268 | 49 | 102 | ||||||||
| Net income | $ | 230,499 | $ | 176,065 | $ | 126,104 | |||||
| Dividends on preferred stock | 86,031 | 85,736 | 73,750 | ||||||||
| Net income available to common shareholders | $ | 144,468 | $ | 90,329 | $ | 52,354 | |||||
| Net income per share available to common shareholders: | |||||||||||
| Basic | $ | 1.76 | $ | 1.12 | $ | 0.68 | |||||
| Diluted | $ | 1.72 | $ | 1.10 | $ | 0.68 | |||||
| Weighted average number of common shares outstanding: | |||||||||||
| Basic | 82,175,111 | 80,976,745 | 76,685,785 | ||||||||
| Diluted | 83,942,704 | 82,157,622 | 77,539,289 | ||||||||
| Dividends declared per share of common stock | $ | 1.48 | $ | 1.42 | $ | 2.10 | |||||
(1) Includes interest income of consolidated VIEs of $557,046, $640,499 and $593,384 for the years ended December 31, 2025, 2024, and 2023 respectively.
(2) Includes interest expense of consolidated VIEs of $283,722, $293,509, and $282,542 for the years ended December 31, 2025, 2024, and 2023, respectively.
(3) Includes interest income from investment in MSR financing receivables of a consolidated VIE of $709, $0 and $0 for the years ended December 31, 2025, 2024 and 2023, respectively.
(4) Includes a related-party, non-cash imputed compensation expense from the Palisades Acquisition of $1,364, $10,296, and $0 for the years ended December 31, 2025, 2024 and 2023, respectively.
See accompanying notes to the consolidated financial statements.
63
Results of Operations for the Years Ended December 31, 2025 and 2024.
The primary source of income for our Investment Portfolio segment is interest income earned on our assets, net of interest expense paid on our financing liabilities, and investment and asset management fees earned through our investment management and advisory business.
The primary source of income for our Residential Origination segment is derived from our mortgage lending activities and includes certain fees collected at the time of origination and gain or loss from the sale of LHFS. Loan origination income reflects the fees earned, net of lender credits from originating the loans. These consist of fees related to loan origination, discount points, underwriting, processing and other fees.
For the year ended December 31, 2025, our net income available to common shareholders was $144 million, or $1.76 per average basic common share, compared to a net income of $90 million, or $1.12 per average basic common share for year ended December 31, 2024. The increase in net income available to common shareholders for the year ended December 31, 2025, as compared to the year ended December 31, 2024, was primarily driven by an increase in net unrealized gains on financial instruments at fair value of $71 million, an increase in investment management and advisory fees of $33 million related to a full year of customized solutions offerings, and an increase in net unrealized gains on derivatives of $7 million. This was offset by an increase in net realized losses on sales of investments of $18 million, an increase in realized losses on derivatives of $12 million, an increases to compensation and benefits of $15 million due to the inclusion of staffing costs from the Palisades Acquisition in December 2024, an increase in transaction expenses of $10 million related to a combination of the HomeXpress Acquisition and higher securitization activity, and an increase in amortization of intangibles and depreciation of $7 million related to the newly acquired intangible assets as part of the business acquisitions.
Interest Income
Our interest income revenues are driven primarily by our Investment Portfolio segment. Interest income increased by $60 million, or 7.9%, to $821 million for the year ended December 31, 2025 as compared to $761 million, for the year ended December 31, 2024. This increase was primarily driven by our Agency Pass-through purchases during the period, resulting in an increase in interest income on our Agency RMBS portfolio of $77 million as compared to the year ended December 31, 2024. The increase was also related to interest income of $13 million on loans held for sale following the acquisition of HomeXpress as reported within our Residential Origination segment. The increase in interest income is offset by decreases in income on our Non-agency RMBS and Loans held for investment portfolios of $10 million and $21 million, respectively, due to asset sales and paydowns during the year.
Interest Expense
Interest expense increased by $59 million, or 11.8%, to $555 million for the year ended December 31, 2025, as compared to $496 million for the year ended December 31, 2024. The increase was primarily driven by an increase in interest expense on our secured financing agreements collateralized by Agency RMBS of $52 million, driven by higher borrowings to finance our Agency CMO and Agency Pass-through purchases, reflecting the deployment of leverage to support our Agency RMBS activities, during the year ended December 31, 2025 as compared to the prior year. Additionally, the interest expense on our Long Term Debt increased to $17 million during the year ended December 31, 2025 as compared to $7 million for the year ended December 31, 2024, driven by our additional unsecured long term debt issuance during the year to support our investment activities. The increase was also driven by the additional interest expense of $10 million on warehouse financing used by HomeXpress to fund our loans from origination through sale.
The increase in interest expense was offset by a decrease in our interest expense on secured financing agreements collateralized by Non-Agency RMBS of $12 million for the year ended December 31, 2025, as compared to the year ended December 31, 2024, due to a reduction in our average secured financing agreements collateralized by Non-Agency RMBS through asset sales and paydowns. Additionally, our interest expense on Securitized debt decreased by $2 million due to a reduction in our average securitized debt balance of $524 million during the year ended December 31, 2025, as compared to the year ended December 31, 2024.
Economic Net Interest Income - Investment Portfolio Segment
Economic net interest income of our Investment Portfolio is a non-GAAP financial measure that equals GAAP net interest income adjusted for net periodic interest on derivatives, interest income from Residential Origination segment and interest income from investment in MSR financing receivables, and excludes interest earned on cash and interest expense from our Residential Origination segment. For the purpose of computing economic net interest income and ratios relating to cost of funds measures throughout this section, interest expense includes net payments on our derivatives, which is presented as a part of Net gains (losses) on derivatives in our Consolidated Statements of Operations. Interest rate swaps, Interest rate cap and Swap
64
futures are used to manage the increase in interest paid on secured financing agreements in a rising rate environment. Presenting the net contractual interest payments on interest rate derivatives with the interest paid on interest-bearing liabilities reflects our total contractual interest payments. We believe this presentation is useful to investors because it depicts the economic value of our investment strategy by showing all components of interest expense and net interest income of our investment portfolio. However, Economic net interest income should not be viewed in isolation and is not a substitute for net interest income computed in accordance with GAAP. Where indicated, interest expense, adjusting for any interest earned on cash, is referred to as Economic interest expense. Where indicated, net interest income reflecting net periodic interest on derivatives and any interest earned on cash, is referred to as Economic net interest income.
The following table reconciles the Economic net interest income to GAAP net interest income and Economic interest expense to GAAP interest expense for the periods presented.
| GAAP Interest Income | Interest Income on Mortgage Loan Origination | Other (1) | Economic Interest Income | GAAP Interest Expense | Periodic Interest On Derivatives, net & Interest Expense on Mortgage Loan Origination | Economic Interest Expense | GAAP Net Interest Income | Periodic Interest On Derivatives, net | Other (1) | Net Interest Income on Mortgage Loan Origination | Economic Net Interest Income | |||||||||||||||||||||||||||||||||||||||||||||||||||||||||||||||||||||
| For the Year Ended December 31, 2025 | $ | 821,343 | $ | (12,355) | $ | (8,796) | $ | 800,192 | $ | 554,924 | $ | (30,054) | $ | 524,870 | $ | 266,419 | $ | 20,375 | $ | (8,796) | $ | (2,676) | $ | 275,322 | ||||||||||||||||||||||||||||||||||||||||||||||||||||||||
| For the Year Ended December 31, 2024 | $ | 760,950 | $ | — | $ | (7,352) | $ | 753,598 | $ | 496,274 | $ | (23,780) | $ | 472,494 | $ | 264,676 | $ | 23,780 | $ | (7,352) | $ | — | $ | 281,104 | ||||||||||||||||||||||||||||||||||||||||||||||||||||||||
| For the Year Ended December 31, 2023 | $ | 772,904 | $ | — | $ | (9,871) | $ | 763,033 | $ | 509,541 | $ | (17,167) | $ | 492,374 | $ | 263,363 | $ | 17,167 | $ | (9,871) | $ | — | $ | 270,659 | ||||||||||||||||||||||||||||||||||||||||||||||||||||||||
| For the Quarter Ended December 31, 2025 | $ | 220,328 | $ | (12,355) | $ | (3,540) | $ | 204,433 | $ | 154,150 | $ | (15,101) | $ | 139,049 | $ | 66,178 | $ | 5,422 | $ | (3,540) | $ | (2,676) | $ | 65,384 | ||||||||||||||||||||||||||||||||||||||||||||||||||||||||
| For the Quarter Ended September 30, 2025 | $ | 209,100 | $ | — | $ | (2,204) | $ | 206,896 | $ | 144,089 | $ | (5,751) | $ | 138,338 | $ | 65,011 | $ | 5,751 | $ | (2,204) | $ | — | $ | 68,558 | ||||||||||||||||||||||||||||||||||||||||||||||||||||||||
| For the Quarter Ended June 30, 2025 | $ | 201,297 | $ | — | $ | (2,002) | $ | 199,295 | $ | 135,287 | $ | (5,067) | $ | 130,220 | $ | 66,010 | $ | 5,067 | $ | (2,002) | $ | — | $ | 69,075 | ||||||||||||||||||||||||||||||||||||||||||||||||||||||||
| For the Quarter Ended March 31, 2025 | $ | 190,616 | $ | — | $ | (1,050) | $ | 189,566 | $ | 121,397 | $ | (4,135) | $ | 117,262 | $ | 69,219 | $ | 4,135 | $ | (1,050) | $ | — | $ | 72,304 | ||||||||||||||||||||||||||||||||||||||||||||||||||||||||
(1) Primarily interest income on cash and cash equivalents from our Portfolio and Residential Origination segments and interest income from investment in MSR financing receivables.
Net Interest Rate Spread - Investment Portfolio Segment
The following tables show our average earning assets held, interest earned on assets, yield on average interest earning assets, average debt balance, economic interest expense, economic average cost of funds, economic net interest income and net interest rate spread for the periods presented.
65
| For the Quarters Ended | |||||||||||||||||||||||||||||
| December 31, 2025 | September 30, 2025 | December 31, 2024 | |||||||||||||||||||||||||||
| (dollars in thousands) | (dollars in thousands) | (dollars in thousands) | |||||||||||||||||||||||||||
| Average Balance | Interest | Average Yield/Cost | Average Balance | Interest | Average Yield/Cost | Average Balance | Interest | Average Yield/Cost | |||||||||||||||||||||
| Assets: | |||||||||||||||||||||||||||||
Interest-earning assets (1)(4): | |||||||||||||||||||||||||||||
Agency RMBS (3) | $ | 2,975,920 | $ | 40,159 | 5.4 | % | $ | 2,520,146 | $ | 34,108 | 5.9 | % | $ | 19,136 | $ | 303 | 6.3 | % | |||||||||||
| Agency CMBS | 40,391 | 417 | 4.1 | % | 41,062 | 464 | 4.5 | % | 105,270 | 1,138 | 4.3 | % | |||||||||||||||||
Non-Agency RMBS (3) | 763,957 | 24,735 | 12.9 | % | 872,037 | 27,872 | 12.5 | % | 950,366 | 29,611 | 12.5 | % | |||||||||||||||||
| Loans held for investment | 10,027,070 | 139,102 | 5.5 | % | 10,482,981 | 143,952 | 5.5 | % | 11,882,662 | 158,501 | 5.3 | % | |||||||||||||||||
MSR(5) | 38,221 | 20 | 0.2 | % | 38,221 | 500 | 5.2 | % | — | — | — | % | |||||||||||||||||
| Total | $ | 13,845,559 | $ | 204,433 | 5.9 | % | $ | 13,954,447 | $ | 206,896 | 5.9 | % | $ | 12,957,434 | $ | 189,553 | 5.9 | % | |||||||||||
| Liabilities and stockholders' equity: | |||||||||||||||||||||||||||||
Interest-bearing liabilities (2)(4): | |||||||||||||||||||||||||||||
| Secured financing agreements collateralized by: | |||||||||||||||||||||||||||||
Agency RMBS (3) | $ | 2,913,324 | $ | 27,523 | 4.3 | % | $ | 2,450,389 | $ | 24,160 | 4.7 | % | $ | — | $ | — | — | % | |||||||||||
| Agency CMBS | 30,899 | 329 | 4.3 | % | 30,704 | 355 | 4.6 | % | 75,847 | 1,071 | 5.6 | % | |||||||||||||||||
Non-Agency RMBS (3) | 491,472 | 6,217 | 5.1 | % | 565,871 | 7,378 | 5.2 | % | 710,550 | 13,561 | 7.6 | % | |||||||||||||||||
| Loans held for investment | 1,533,349 | 26,141 | 6.8 | % | 1,752,317 | 30,214 | 6.9 | % | 1,761,188 | 30,298 | 6.9 | % | |||||||||||||||||
| Securitized Debt | 7,177,468 | 72,474 | 4.0 | % | 7,321,240 | 72,285 | 3.9 | % | 8,422,017 | 76,327 | 3.6 | % | |||||||||||||||||
Long Term Debt (3) | 259,750 | 6,365 | 9.8 | % | 158,212 | 3,946 | 10.0 | % | — | — | — | % | |||||||||||||||||
| Total | $ | 12,406,262 | $ | 139,049 | 4.5 | % | $ | 12,278,733 | $ | 138,338 | 4.5 | % | $ | 10,969,602 | $ | 121,257 | 4.4 | % | |||||||||||
| Economic net interest income/net interest rate spread | $ | 65,384 | 1.4 | % | $ | 68,558 | 1.4 | % | $ | 68,296 | 1.5 | % | |||||||||||||||||
| Net interest-earning assets/net interest margin | $ | 1,439,297 | 1.9 | % | $ | 1,675,714 | 2.0 | % | $ | 1,987,832 | 2.1 | % | |||||||||||||||||
| Ratio of interest-earning assets to interest bearing liabilities | 1.12 | 1.14 | 1.18 | ||||||||||||||||||||||||||
| (1) Interest-earning assets at amortized cost. | |||||||||||||||||||||||||||||
| (2) Interest includes periodic interest on derivatives, net. | |||||||||||||||||||||||||||||
| (3) These amounts have been adjusted to reflect the daily outstanding averages for which the financial instruments were held during the period. | |||||||||||||||||||||||||||||
| (4) This table excludes interest-bearing assets and liabilities of our Residential Origination segment. Our Residential Origination segment includes average assets of $775 million, average liabilities of $621 million, interest income of $13 million, interest expense of $10 million, and net interest income of $3 million. | |||||||||||||||||||||||||||||
| (5) The average balance amount represents committed capital by the Company during the period. | |||||||||||||||||||||||||||||
66
| For the Years Ended | |||||||||||||||||||||||
| December 31, 2025 | December 31, 2024 | ||||||||||||||||||||||
| (dollars in thousands) | (dollars in thousands) | ||||||||||||||||||||||
| Average Balance | Interest | Average Yield/Cost | Average Balance | Interest | Average Yield/Cost | ||||||||||||||||||
| Assets: | |||||||||||||||||||||||
Interest-earning assets (1)(4): | |||||||||||||||||||||||
Agency RMBS (3) | $ | 2,298,260 | $ | 101,075 | 5.6 | % | $ | 631,883 | $ | 23,892 | 6.3 | % | |||||||||||
| Agency CMBS | 41,112 | 2,693 | 6.6 | % | 49,593 | 2,321 | 4.7 | % | |||||||||||||||
Non-Agency RMBS (3) | 896,477 | 109,165 | 12.1 | % | 978,131 | 119,335 | 12.2 | % | |||||||||||||||
| Loans held for investment | 10,603,115 | 586,739 | 5.5 | % | 11,337,205 | 608,049 | 5.4 | % | |||||||||||||||
MSR (5) | 38,221 | 520 | 5.4 | % | — | — | — | % | |||||||||||||||
| Total | $ | 13,877,185 | $ | 800,192 | 5.8 | % | $ | 12,996,812 | $ | 753,598 | 5.8 | % | |||||||||||
| Liabilities and stockholders' equity: | |||||||||||||||||||||||
Interest-bearing liabilities (2)(4): | |||||||||||||||||||||||
| Secured financing agreements collateralized by: | |||||||||||||||||||||||
Agency RMBS (3) | $ | 2,188,583 | $ | 68,841 | 4.5 | % | $ | 540,735 | $ | 16,860 | 5.2 | % | |||||||||||
| Agency CMBS | 30,509 | 1,369 | 4.5 | % | 35,555 | 1,951 | 5.5 | % | |||||||||||||||
Non-Agency RMBS (3) | 583,960 | 32,494 | 5.6 | % | 661,781 | 44,649 | 6.7 | % | |||||||||||||||
| Loans held for investment | 1,737,540 | 113,434 | 6.5 | % | 1,709,150 | 108,891 | 6.4 | % | |||||||||||||||
| Securitized Debt | 7,407,162 | 291,473 | 3.9 | % | 7,930,785 | 293,509 | 3.7 | % | |||||||||||||||
Long Term Debt (3) | 174,461 | 17,259 | 9.9 | % | 110,050 | 6,634 | 9.9 | % | |||||||||||||||
| Total | $ | 12,122,215 | $ | 524,870 | 4.3 | % | $ | 10,988,056 | $ | 472,494 | 4.3 | % | |||||||||||
| Economic net interest income/net interest rate spread | $ | 275,322 | 1.5 | % | $ | 281,104 | 1.5 | % | |||||||||||||||
| Net interest-earning assets/net interest margin | $ | 1,754,970 | 2.0 | % | $ | 2,008,756 | 2.2 | % | |||||||||||||||
| Ratio of interest-earning assets to interest bearing liabilities | 1.14 | 1.18 | |||||||||||||||||||||
| (1) Interest-earning assets at amortized cost. | |||||||||||||||||||||||
| (2) Interest includes periodic interest on derivatives, net | |||||||||||||||||||||||
| (3) These amounts have been adjusted to reflect the daily outstanding averages for which the financial instruments were held during the period. | |||||||||||||||||||||||
| (4) This table excludes interest-bearing assets and liabilities of our Residential Origination segment. Our Residential Origination segment includes average assets of $775 million, average liabilities of $621 million, interest income of $13 million, interest expense of $10 million, and net interest income of $3 million. | |||||||||||||||||||||||
| (5) The average balance amount represents committed capital by the Company during the period. | |||||||||||||||||||||||
Economic Net Interest Income and the Average Earning Assets - Investment Portfolio Segment
Our Economic net interest income (which is a non-GAAP measure, see “Economic net interest income” discussion earlier for details) decreased by $6 million to $275 million for the year ended December 31, 2025, from $281 million for the year ended December 31, 2024. Our net interest rate spread, which equals the yield on our average interest-earning assets less the economic average cost of funds, remained relatively unchanged at 1.5% for the years ended December 31, 2025 and 2024, respectively.
Our Average net interest-earning assets decreased by $254 million to $1.8 billion for the year ended December 31, 2025, compared to $2.0 billion for the same period of 2024. Our net interest margin, which equals the yield on our average interest-earning assets less the economic average cost of funds, decreased by 20 basis points for the year ended December 31, 2025, as compared to the year ended December 31, 2024.
Economic Interest Expense and the Cost of Funds - Investment Portfolio Segment
The borrowing rate at which we are able to finance our assets using secured financing agreements is typically correlated to SOFR and the term of the financing. The borrowing rate on the majority of our securitized debt is fixed and correlated to the term of the financing. The table below shows our average borrowed funds, Economic interest expense, average cost of funds (inclusive of periodic interest on swaps and Swap futures), average one-month SOFR, average three-month SOFR and average one-month SOFR relative to average three-month SOFR.
67
| Average Debt Balance | Economic Interest Expense | Average Cost of Funds | Average One-Month SOFR | Average Three-Month SOFR | Average One-Month SOFR Relative to Average Three-Month SOFR | |||||||||||||||
| (Ratios have been annualized, dollars in thousands) | ||||||||||||||||||||
| For The Year Ended December 31, 2025 | $ | 12,122,215 | $ | 524,870 | 4.30 | % | 4.21 | % | 4.11 | % | 0.09 | % | ||||||||
| For The Year Ended December 31, 2024 | $ | 10,988,056 | $ | 472,494 | 4.30 | % | 5.09 | % | 5.02 | % | 0.07 | % | ||||||||
| For The Year Ended December 31, 2023 | $ | 11,244,670 | $ | 492,374 | 4.38 | % | 5.07 | % | 5.17 | % | (0.10) | % | ||||||||
| For the Quarter Ended December 31, 2025 | $ | 12,406,262 | $ | 139,049 | 4.50 | % | 3.91 | % | 3.82 | % | 0.09 | % | ||||||||
| For the Quarter Ended September 30, 2025 | $ | 12,278,733 | $ | 138,338 | 4.50 | % | 4.29 | % | 4.05 | % | 0.24 | % | ||||||||
| For the Quarter Ended June 30, 2025 | $ | 11,501,566 | $ | 130,220 | 4.50 | % | 4.32 | % | 4.30 | % | 0.02 | % | ||||||||
| For the Quarter Ended March 31, 2025 | $ | 10,769,436 | $ | 117,262 | 4.40 | % | 4.31 | % | 4.30 | % | 0.01 | % | ||||||||
Average interest-bearing liabilities increased by $1.1 billion for the year ended December 31, 2025, as compared to the year ended December 31, 2024. Economic interest expense increased by $52 million for the year ended December 31, 2025, as compared to the year ended December 31, 2024, due to an increase in borrowings under our secured financing agreements to fund our Agency RMBS purchases.
While we may use interest rate hedges to mitigate risks related to changes in interest rate, the hedges may not fully offset interest expense movements.
Provision for Credit Losses
For the year ended December 31, 2025, we recorded an increase in provision for credit losses of $16 million, as compared to an increase in provision of credit losses of $10 million for the year ended December 31, 2024. The changes in provision for credit losses for the year ended December 31, 2025, as compared to the year ended December 31, 2024, are primarily due to a deterioration in cashflows on a combination of Non-Agency senior and subordinated bonds.
Net Gains (Losses) on Derivatives
We use derivatives to economically hedge the effects of changes in interest rates on our portfolio, specifically our secured financing agreements. Unrealized gains and losses include the change in market value, period over period, on our derivatives portfolio. Changes in market value are generally a result of changes in interest rates. We may or may not ultimately realize these unrealized derivative gains and losses depending on trade activity, changes in interest rates and the values of the underlying securities. The net gains and losses on our derivatives include both unrealized and realized gains and losses. Realized gains and losses include the net cash paid and received on our derivatives portfolio during the period as well as sales, terminations and settlements related to our derivatives portfolio.
The tables below show a summary of our net gains (losses) on derivative instruments for the years ended December 31, 2025, 2024 and 2023.
68
| For the Years Ended | |||||||||||
| December 31, 2025 | December 31, 2024 | December 31, 2023 | |||||||||
| (dollars in thousands) | |||||||||||
| Periodic interest on derivatives, net | $ | 20,375 | $ | 23,780 | $ | 17,167 | |||||
| Realized gains (losses) on derivative instruments, net: | |||||||||||
| Interest rate swaps | (25,774) | (17,317) | (45,226) | ||||||||
| Swap futures | (2,037) | — | — | ||||||||
| Treasury futures | 82 | (4,223) | (6,344) | ||||||||
| Swaptions | (5,623) | — | 10,613 | ||||||||
| Total realized gains (losses) on derivative instruments, net | (33,352) | (21,540) | (40,957) | ||||||||
| Unrealized gains (losses) on derivative instruments, net: | |||||||||||
| Interest rate swaps | 23,520 | 4,224 | 497 | ||||||||
| Swap futures | (4,618) | — | — | ||||||||
| Treasury futures | (117) | 117 | — | ||||||||
| Swaptions | (1,045) | (1,378) | (6,908) | ||||||||
| Interest rate cap | (7,369) | — | — | ||||||||
| Total unrealized gains (losses) on derivative instruments, net: | 10,371 | 2,963 | (6,411) | ||||||||
| Total gains (losses) on derivative instruments, net | $ | (2,606) | $ | 5,203 | $ | (30,201) | |||||
In addition, the net gains (losses) attributable to derivatives on our Residential Origination segment was $1.2 million for the year ended December 31, 2025 which is reported in Gain on origination and sale of loans, net, in our Consolidated Statements of Operations.
During the years ended December 31, 2025 and 2024, we recognized total net losses on derivatives of $3 million and total net gains on derivatives of $5 million, respectively. Changes in market value are generally a result of changes in interest rates. We may or may not ultimately realize these unrealized derivative gains and losses depending on trade activity, changes in interest rates and the values of the underlying securities.
Interest Rate Swaps
The weighted average pay rate on our interest rate swaps at December 31, 2025 was 3.44% and the weighted average receive rate was 3.87%. At December 31, 2025, the weighted average maturity on our interest rate swaps was less than 6 years. During the year ended December 31, 2025, we had net realized losses of $26 million related to the interest rate swaps.
The weighted average pay rate on our interest rate swaps at December 31, 2024 was 3.56% and the weighted average receive rate was 4.49%. At December 31, 2024, the weighted average maturity on our interest rate swaps was less than one year.
We had net realized losses of $26 million related to swap terminations during the year ended December 31, 2025. We had a realized loss of $17 million related to the maturity of one swap during the year ended December 31, 2024.
Swap Futures
During the year ended December 31, 2025, we had Swap futures with a notional of $340 million. We had net realized losses of $2 million related to swap futures terminations during the year ended December 31, 2025.
Swaptions
During the year ended December 31, 2025, we had swaptions with a notional of $600 million. We had net realized losses of $6 million related to swaptions during the year ended December 31, 2025. During the year ended December 31, 2024, we did not have any swaption terminations.
Interest Rate Cap
During the year ended December 31, 2025, we entered into an interest rate cap. We paid $7 million for a $1.0 billion notional two-year interest rate cap with a strike rate of 3.95% on SOFR as the market reference rate. At December 31, 2024, we held no interest rate caps.
Treasury Future Contracts
69
For our Investment Portfolio segment, during the year ended December 31, 2025, we covered our open short position of 1,000 two-year U.S. Treasury Futures contracts for a net realized gain of $82 thousand. During the year ended December 31, 2024, we entered into 1,391 short 5-year and 1,684 short 5-year U.S. Treasury futures contract with a notional of $139 million and $168 million, respectively, which we subsequently covered for a net realized loss of $5 million. Additionally, we covered and reopened our existing open 2-year U.S Treasury futures contract position for a realized gain of $641 thousand. We are short 1,000 2-year U.S. Treasury futures contract at December 31, 2024.
For the Residential Origination segment, during the year ended December 31, 2025, we entered into 360 short 5-year and 1,400 short 2-year U.S. Treasury futures contract with notional amounts of $36 million and $280 million respectively, which we subsequently covered for net realized gain of $31 thousand. We are short 197 5-year and 765 2-year U.S. Treasury futures contracts at December 31, 2025.
Interest Rate Lock Commitments
For the Residential Origination segment, we enter into IRLCs with prospective borrowers to originate mortgage loans at a specified interest rate. This creates a derivative asset which is valued based on market conditions, loan characteristics, estimated remaining direct expenses, and subject to the Pull-through Rate. As of December 31, 2025, HomeXpress’ total IRLC asset had a notional amount of $200 million and a fair value of $4 million.
Changes in our derivative positions were primarily a result of changes in our secured financing composition and changes in interest rates.
Long Term Debt Expense
During the second quarter of 2024, we issued $65 million aggregate principal amount of 9.00% unsecured senior notes due 2029 that pay quarterly interest. After deducting the underwriting discount and other debt issuance costs, we received approximately $251 million of proceeds.
During the third quarter of 2024, we issued $75 million aggregate principal amount (including the additional amount
issued pursuant to the exercise of the over-allotment option) of 9.25% unsecured senior notes due 2029 that pay quarterly interest. After deducting the underwriting discount and other debt issuance costs, we received approximately $72 million of proceeds.
During the third quarter of 2025, we issued $120 million aggregate principal amount (including the additional amount
issued pursuant to the exercise of the over-allotment option) of 8.875% unsecured senior notes due 2030 that pay quarterly interest. After deducting the underwriting discount and other debt issuance costs, we received approximately $116 million of proceeds.
At December 31, 2025, the outstanding principal amount of these notes was $260 million and the accrued interest payable on this debt was $3 million. At December 31, 2025, the unamortized deferred debt issuance cost was $8 million. The net interest expense was $17 million and $7 million for the years ended December 31, 2025 and 2024, respectively.
Investment management and advisory fees
During the fourth quarter of 2024, we started earning investment management and advisory fees through certain investment management agreements entered into with our investment partnerships and privately offered pooled investment vehicles, insurance companies, and other institutional clients. We recognized investment management and advisory fees of $35 million and $3 million for the years ended December 31, 2025 and 2024, respectively.
Gain on origination and sale, net
Gain on origination and sale, net, represents the primary source of revenue for our Residential Origination segment. During the fourth quarter of 2025, revenue derived from our mortgage lending activities includes certain fees collected at the time of origination, gain or loss from the sale of LHFS, net change in the valuations of the IRLC and LHFS, realized and unrealized change in value of the derivative instruments, provisions or benefit for loan repurchase reserves and the direct loan originations costs, net.
Loan origination income, net, reflects the fees earned, net of lender credits from originating the loans. These consist of fees related to loan origination, discount points, underwriting, processing and other fees. Lender credits typically are related to rebates or concessions for certain loan origination costs.
Premiums from loan sales and the mark-to-market changes of LHFS include both the realized and unrealized gains and losses on the sale of LHFS and are included in Gain on origination and sales of loans, net. The valuation of LHFS approximates the
70
servicing released market value of a loan sold to a private investor. Unrealized gains from derivative instruments are the net change in value of the IRLC derivative asset and the hedge derivatives.
Benefits (provision) for loan repurchase reserves records the net change in the estimated losses retaining to reps and warrant associated with a mortgage loan sale.
Direct loan origination costs, net, are the direct expenses associated with the origination of a mortgage loan. These costs include loan verification services, interim servicing expenses, third party due diligence fees, and commissions to sales employees. Under fair value accounting these expenses are realized when a loan funds.
We recognized gain on origination and sale of loans, net, of $21 million for the year ended December 31, 2025 following the acquisition of HomeXpress on October 1, 2025.
Interest Income from investment in MSR financing receivables
During the year ended December 31, 2025, we entered into purchase agreements to acquire base and excess servicing compensation rights, also known as MSRs, associated with a $6.5 billion portfolio of mortgage loans from a licensed, GSE-approved residential mortgage loan servicer. In these arrangements, the licensed servicer holds legal title to the MSRs and is responsible for performing all servicing activities, while we provide financing or capital support and, in return, receive the economic benefits of a base and excess servicing spread.
We entered into a Reference Spread Agreement for Agency Loans to purchase the base servicing fee on the mortgage servicing loans at a rate of 12.5 basis points less the cost of servicing and other ancillary fees and income. We also entered into a True Excess Spread Agreement for FNMA Loans entitling us to monthly distributions of the servicing fees collected by the mortgage loan servicer in excess of 12.5 basis points per annum and other related servicing cash flows.
Recurring servicing fees, ancillary income, recapture income, and float earnings associated with MSRs are recognized on a cash basis when earned and received. We recognized interest income on our investments in MSR financing receivables, net, of $520 thousand for the year ended December 31, 2025.
Net Unrealized Gains (Losses) on Financial Instruments at Fair Value
During the year ended December 31, 2025, the Federal Reserve cut rates three times by 25 basis points each, bringing the year end range to 3.50%-3.75%. Interest rates generally tracked lower during the year, with the two-year treasury falling 77 basis points to 3.47%, and the ten-year treasury yield dropping 40 basis points to 4.17% at year end. We recorded net unrealized gains on financial instruments at fair value of $82 million and $11 million for the years ended December 31, 2025 and 2024, respectively.
Gains and Losses on Sales of Assets
We do not forecast sales of investments as we generally expect to invest for long-term gains. However, from time to time, we may sell assets to create liquidity necessary to pursue new opportunities, to achieve targeted leverage ratios, as well as for gains when prices indicate a sale is most beneficial to us, or is the most prudent course of action to maintain a targeted risk-adjusted yield for our investors.
During the year ended December 31, 2025, we rebalanced a portion of our investment portfolio and sold certain Agency CMO, Non-Agency RMBS and Loans held for investment assets, which resulted in a net realized loss of $23 million. Proceeds from these sales were largely re-invested in Agency RMBS Pass-through securities and enabled us to maintain liquidity which can be used for investments or acquisitions. During the year ended December 31, 2024, we sold Agency CMBS and Agency CMO assets. These sales resulted in a net realized losses of $5 million.
Gain and Loss on Extinguishment of Debt
When we acquire our outstanding securitized debt, we extinguish the outstanding debt and recognize a gain or loss based on the difference between the carrying value of the debt and the cost to acquire the debt which is reflected in the Consolidated Statements of Operations as a gain or loss on extinguishment of debt.
Securitized Debt Collateralized by Non-Agency RMBS
We did not acquire any securitized debt collateralized by Non-Agency RMBS during the years ended December 31, 2025 and 2024.
71
Securitized Debt Collateralized by Loans Held for Investment
We acquired securitized debt collateralized by Loans held for investment with an amortized cost balance of $384 million for $382 million during the year ended December 31, 2025. We did not acquire any securitized debt collateralized by loans held for investment during the year ended December 31, 2024.
Compensation, General and Administrative Expenses and Transaction Expenses
The table below shows our total compensation and benefits expense, general and administrative, or G&A expenses, and transaction expenses as compared to average total assets and average equity for the periods presented.
| Total Compensation, G&A and Transaction Expenses | Total Compensation, G&A and Transaction Expenses/Average Assets | Total Compensation, G&A and Transaction Expenses/Average Equity | |||||||||
| (Ratios have been annualized, dollars in thousands) | |||||||||||
| For The Year Ended December 31, 2025 | $ | 103,331 | 0.72 | % | 3.99 | % | |||||
| For The Year Ended December 31, 2024 | $ | 71,656 | 0.55 | % | 2.73 | % | |||||
| For The Year Ended December 31, 2023 | $ | 71,067 | 0.53 | % | 2.74 | % | |||||
| For the Quarter Ended December 31, 2025 | $ | 28,164 | 0.73 | % | 4.38 | % | |||||
| For the Quarter Ended September 30, 2025 | $ | 30,623 | 0.82 | % | 4.72 | % | |||||
| For the Quarter Ended June 30, 2025 | $ | 18,865 | 0.54 | % | 2.86 | % | |||||
| For the Quarter Ended March 31, 2025 | $ | 25,680 | 0.78 | % | 3.97 | % | |||||
Compensation and benefits costs were approximately $57 million and $41 million for the year ended December 31, 2025 and December 31, 2024. The increase in Compensation and benefits costs for the year ended December 31, 2025 compared to the year ended December 31, 2024, was driven by higher overall compensation expense related to the increase in employee headcount and expenses related to the acquisitions of Palisades and HomeXpress.
G&A expenses were approximately $30 million and $23 million for the year ended December 31, 2025 and December 31, 2024. G&A expenses are primarily comprised of legal, market data and research, auditing, consulting, information technology, rent and independent investment consulting expenses.
During the year ended December 31, 2025, we incurred transaction expenses of $17 million in relation to the HomeXpress Acquisition. During the year ended December 31, 2024, we incurred transaction expenses of $7 million due to Palisades Acquisition and securitization activity.
Servicing and Asset Manager Fee Expense
Servicing fees and asset manager expenses were $28 million and $30 million for the year ended December 31, 2025 and December 31, 2024, respectively. These servicing fees are primarily related to the servicing costs of the whole loans held in consolidated securitization vehicles and are paid from interest income earned by the VIEs. Servicing fees generally ranged from 2 to 50 basis points of unpaid principal balances of our consolidated VIEs. Servicing and asset manager fee expense decreased by $2 million year over year due to lower loan balances and loan counts at December 31, 2025 related to our portfolio reallocation during the year. Servicing fees paid by the Residential Origination unit are for the interim servicing of loans from organization to sale and are included in Gain on origination and sale of loans, net, in our Consolidated Statements of Operations.
Amortization of intangibles and depreciation expenses
We recognized intangible assets related to investment management agreements, internally developed software, developed technology, broker relationships, trade name and licenses acquired in the acquisitions. The long-lived fixed assets are comprised of leasehold improvements, furniture and fixtures, and computers. The fixed assets and intangible assets are depreciated or amortized over their estimated useful lives. We acquired both intangible assets and long-lived fixed assets through the acquisitions of Palisades and HomeXpress during the fourth quarters of 2024 and 2025, respectively. During the years ended December 31, 2025 and December 31, 2024, we recognized amortization of intangible assets and depreciation expense of $7 million and $321 thousand, respectively.
Segment Results of Operations
72
Investment Portfolio segment
The Investment Portfolio segment consists of our investments and third-party advisory services activities, and is comprised of our investments and financial assets including (i) MSR Related Investments, (ii) Real Estate Securities, (iii) Properties and Residential Mortgage Loans, (iv) Consumer loans and (v) certain ancillary investments and equity method investments, as well as associated financing, hedging, and various allocable expenses. These activities were previously reflected within our single reportable segment prior to the 2025 segment reevaluation.
Residential Origination segment
In conjunction with the HomeXpress Acquisition, the Residential Origination segment consists of our stand-alone mortgage origination business of HomeXpress that originates consumer Non-QM, investor business purpose, and other Non-Agency and Agency mortgage loan products, and includes the related goodwill, intangible assets, and direct expenses, plus HomeXpress-related residential whole loans and real estate owned.
The following presents, for each reportable segment, revenues, the measure of segment profit or loss, and significant segment expenses. Segment results are prepared on the same basis as our consolidated financial statements and are reconciled to consolidated amounts below:
73
| For the Year Ended | ||||||||||||||||||||
| December 31, 2025 | ||||||||||||||||||||
| (dollars in thousands) | ||||||||||||||||||||
| Investment Portfolio | Residential Origination | Total | ||||||||||||||||||
| Net interest income: | ||||||||||||||||||||
| Interest income | $ | 808,384 | $ | 12,959 | $ | 821,343 | ||||||||||||||
| Interest expense | 545,245 | 9,679 | 554,924 | |||||||||||||||||
| Net interest income | 263,139 | 3,280 | 266,419 | |||||||||||||||||
| Increase in provision for credit losses | 15,705 | — | 15,705 | |||||||||||||||||
| Other income (losses): | ||||||||||||||||||||
| Net unrealized gains (losses) on derivatives | 10,371 | — | 10,371 | |||||||||||||||||
| Realized losses on derivatives | (33,352) | — | (33,352) | |||||||||||||||||
| Periodic interest on derivatives, net | 20,375 | — | 20,375 | |||||||||||||||||
| Net gains (losses) on derivatives | (2,606) | — | (2,606) | |||||||||||||||||
| Investment management and advisory fees | 35,382 | — | 35,382 | |||||||||||||||||
| Interest income from investment in MSR financing receivables | 520 | — | 520 | |||||||||||||||||
| Net unrealized gains on financial instruments at fair value | 81,735 | — | 81,735 | |||||||||||||||||
| Net realized losses on sales of investments | (23,192) | — | (23,192) | |||||||||||||||||
| Gains on extinguishment of debt | 2,142 | — | 2,142 | |||||||||||||||||
| Other investment gains | 5,733 | — | 5,733 | |||||||||||||||||
| Gain on origination and sale of loans, net | — | 20,590 | 20,590 | |||||||||||||||||
| Total other income (losses) | 99,714 | 20,590 | 120,304 | |||||||||||||||||
| Other expenses: | ||||||||||||||||||||
| Compensation and benefits | 46,490 | 10,212 | 56,702 | |||||||||||||||||
| General and administrative expenses | 27,796 | 2,199 | 29,995 | |||||||||||||||||
| Servicing and asset manager fees | 27,737 | — | 27,737 | |||||||||||||||||
| Amortization of intangibles and depreciation expenses | 3,765 | 3,418 | 7,183 | |||||||||||||||||
| Transaction expenses | 16,634 | — | 16,634 | |||||||||||||||||
| Total other expenses | 122,422 | 15,829 | 138,251 | |||||||||||||||||
| Income before income taxes | 224,726 | 8,041 | 232,767 | |||||||||||||||||
| Income tax expense (benefit) | 2,721 | (453) | 2,268 | |||||||||||||||||
| Net income | 222,005 | 8,494 | 230,499 | |||||||||||||||||
| Dividends on preferred stock | 86,031 | — | 86,031 | |||||||||||||||||
| Net income available to common shareholders | $ | 135,974 | $ | 8,494 | $ | 144,468 | ||||||||||||||
Earnings Available for Distribution
Earnings available for distribution is a non-GAAP measure and is defined as GAAP net income (loss) excluding (i) unrealized gains or losses on financial instruments carried at fair value with changes in fair value recorded in earnings, (ii) realized gains or losses on the sales of investments, (iii) gains or losses on the extinguishment of debt, (iv) changes in the provision for credit losses, (v) unrealized gains or losses on derivatives, (vi) realized gains or losses on derivatives, (vii) transaction expenses, (viii) stock compensation expenses for retirement eligible awards, (ix) amortization of intangibles and depreciation expenses, net of any tax impact (x) non-cash imputed compensation expense related to business acquisitions, and (xi) other gains and losses on equity investments.
Non-cash imputed compensation expense reflects the portion of the consideration paid in the Palisades Acquisition that pursuant to the seller’s contractual arrangements is distributable to the seller’s legacy employees (who are now our employees) and that for GAAP purposes is recorded as non-cash imputed compensation expense with an offsetting entry recorded as non-cash contribution from a related party to our shareholder’s equity. The excluded amounts do not include any normal, recurring compensation paid to our employees.
74
Transaction expenses are primarily comprised of costs only incurred at the time of execution of our securitizations, certain structured secured financing agreements, and business combination transactions and include costs such as underwriting fees, legal fees, diligence fees, accounting fees, bank fees and other similar transaction-related expenses. These costs are all incurred prior to or at the execution of the transaction and do not recur. Recurring expenses, such as servicing fees, custodial fees, trustee fees and other similar ongoing fees are not excluded from Earnings available for distribution. We believe that excluding these costs is useful to investors as it is generally consistent with our peer group’s treatment of these costs in their non-GAAP measures presentation, mitigates period to period comparability issues tied to the timing of securitization and structured finance transactions, and is consistent with the accounting for the deferral of debt issuance costs prior to the fair value election option made by us. In addition, we believe it is important for investors to review this metric which is consistent with how management internally evaluates the performance of the Company. Stock compensation expense charges incurred on awards to retirement eligible employees is reflected as an expense over a vesting period (generally 36 months) rather than reported as an immediate expense.
We view Earnings available for distribution as one measure of our investment portfolio's ability to generate income for distribution to common stockholders. Earnings available for distribution is one of the metrics, but not the exclusive metric, that our Board of Directors uses to determine the amount, if any, of dividends on our common stock. Other metrics that our Board of Directors may consider when determining the amount, if any, of dividends on our common stock include, among others, REIT taxable income, dividend yield, book value, cash generated from the portfolio, reinvestment opportunities and other cash needs. To maintain our qualification as a REIT, U.S. federal income tax law generally requires that we distribute at least 90% of our REIT taxable income (subject to certain adjustments) annually. Earnings available for distribution, however, is different than REIT taxable income. For example, differences between Earnings available for distribution and REIT taxable income generally may result from whether the REIT uses mark-to-market accounting for GAAP purposes, accretion of market discount or OID and amortization of premium, and differences in the treatment of securitizations for GAAP and tax purposes, among other items. Further, REIT taxable income generally does not include earnings of our domestic TRSs unless such income is distributed from current or accumulated earnings and profits. The determination of whether we have met the requirement to distribute at least 90% of our annual REIT taxable income is not based on Earnings available for distribution and Earnings available for distribution should not be considered as an indication of our REIT taxable income, a guaranty of our ability to pay dividends, or as a proxy for the amount of dividends we may pay. We believe Earnings available for distribution helps us and investors evaluate our financial performance period over period without the impact of certain non-recurring transactions. Therefore, Earnings available for distribution should not be viewed in isolation and is not a substitute for or superior to net income or net income per basic share computed in accordance with GAAP. In addition, our methodology for calculating Earnings available for distribution may differ from the methodologies employed by other REITs to calculate the same or similar supplemental performance measures, and accordingly, our Earnings available for distribution may not be comparable to the Earnings available for distribution reported by other REITs.
The following table provides GAAP measures of net income and net income per diluted share available to common stockholders for the periods presented and details with respect to reconciling the line items to Earnings available for distribution and related per average diluted common share amounts. Earnings available for distribution is presented on an adjusted dilutive shares basis.
75
| For the Years Ended | |||||||||||
| December 31, 2025 | December 31, 2024 | December 31, 2023 | |||||||||
| (dollars in thousands, except per share data) | |||||||||||
| GAAP net income available to common stockholders | $ | 144,468 | $ | 90,329 | $ | 52,354 | |||||
Adjustments (1): | |||||||||||
| Net unrealized gains on financial instruments at fair value | (81,735) | (10,811) | (34,373) | ||||||||
| Net realized losses on sales of investments | 23,192 | 5,219 | 31,234 | ||||||||
| Gains on extinguishment of debt | (2,142) | — | (3,875) | ||||||||
| Increase in provision for credit losses | 15,705 | 9,838 | 11,371 | ||||||||
| Net unrealized (gains) losses on derivatives | (10,371) | (2,963) | 6,411 | ||||||||
| Realized losses on derivatives | 33,352 | 21,540 | 40,957 | ||||||||
| Transaction expenses | 16,634 | 7,091 | 15,379 | ||||||||
| Stock Compensation expense for retirement eligible awards | (24) | (125) | 966 | ||||||||
Amortization of intangibles and depreciation expenses (2) | 7,183 | 321 | — | ||||||||
HomeXpress acquisition intangible amortization tax impact (3) | (837) | — | — | ||||||||
| Non-cash imputed compensation related to business acquisition | 1,364 | 10,296 | — | ||||||||
| Other investment gains | (5,733) | (9,543) | (1,091) | ||||||||
| Earnings available for distribution | $ | 141,056 | $ | 121,192 | $ | 119,333 | |||||
| GAAP net income per diluted common share | $ | 1.72 | $ | 1.10 | $ | 0.68 | |||||
| Earnings available for distribution per adjusted diluted common share | $ | 1.68 | $ | 1.48 | $ | 1.53 | |||||
(1) As a result of the business combinations, we updated the determination of earnings available for distribution to exclude non-recurring acquisition-related transaction expenses, non-cash amortization of intangibles and depreciation expenses, and non-cash imputed compensation expenses. These expenses are excluded as they relate to our business combinations and are not directly related to our income generating activities.
(2) Non-cash amortization of intangibles and depreciation expenses related to acquisitions.
(3) Tax impact on non-cash amortization of intangibles and depreciation expenses related to business combinations.
The table below summarizes the reconciliation from weighted-average diluted shares under GAAP to the weighted average adjusted diluted shares used for Earnings available for distribution for the years ended December 31, 2025, 2024 and 2023.
| For the Years Ended | |||||||||||
| December 31, 2025 | December 31, 2024 | December 31, 2023 | |||||||||
| Weighted average diluted shares - GAAP | 83,942,704 | 82,157,622 | 77,539,289 | ||||||||
Potentially dilutive shares (1) | — | — | — | ||||||||
| Adjusted weighted average diluted shares - Earnings available for distribution | 83,942,704 | 82,157,622 | 77,539,289 | ||||||||
(1) Potentially dilutive shares related to restricted stock units and performance stock units excluded from the computation of weighted average GAAP diluted shares because their effect would have been anti-dilutive given the GAAP net loss available to common shareholders. There were no dilutive shares related to RSU/PSUs given the Company reported GAAP net income available to common shareholders for all periods.
76
| For the Quarters Ended | |||||||||||||||||
| December 31, 2025 | September 30, 2025 | June 30, 2025 | March 31, 2025 | December 31, 2024 | |||||||||||||
| (dollars in thousands, except per share data) | |||||||||||||||||
| GAAP net income (loss) available to common stockholders | $ | 6,501 | $ | (21,997) | $ | 14,024 | $ | 145,940 | $ | (168,275) | |||||||
Adjustments (1): | |||||||||||||||||
| Net unrealized (gains) losses on financial instruments at fair value | 17,138 | 36,995 | (6,971) | (128,895) | 181,197 | ||||||||||||
| Net realized (gains) losses on sales of investments | 23,268 | (1,991) | 1,915 | — | 1,468 | ||||||||||||
| Gains on extinguishment of debt | (20) | — | — | (2,122) | — | ||||||||||||
| Increase in provision for credit losses | 5,322 | 2,587 | 4,409 | 3,387 | 4,448 | ||||||||||||
| Net unrealized (gains) losses on derivatives | (27,303) | 7,907 | 2,554 | 6,469 | (276) | ||||||||||||
| Realized (gains) losses on derivatives | 17,495 | (2,015) | 17,954 | (82) | (641) | ||||||||||||
| Transaction expenses | 625 | 9,931 | 390 | 5,688 | 4,707 | ||||||||||||
| Stock Compensation expense for retirement eligible awards | (449) | (506) | (501) | 1,432 | (307) | ||||||||||||
Amortization of intangibles and depreciation expenses (2) | 4,332 | 948 | 949 | 951 | 321 | ||||||||||||
HomeXpress acquisition intangible amortization tax impact (3) | (837) | — | — | — | — | ||||||||||||
| Non-cash imputed compensation related to business acquisition | 341 | 341 | 341 | 341 | 10,296 | ||||||||||||
| Other investment (gains) losses | (1,252) | (1,945) | (2,953) | 417 | (2,490) | ||||||||||||
| Earnings available for distribution | $ | 45,161 | $ | 30,255 | $ | 32,111 | $ | 33,526 | $ | 30,448 | |||||||
| GAAP net income (loss) per diluted common share | $ | 0.08 | $ | (0.27) | $ | 0.17 | $ | 1.77 | $ | (2.07) | |||||||
| Earnings available for distribution per adjusted diluted common share | $ | 0.53 | $ | 0.37 | $ | 0.39 | $ | 0.41 | $ | 0.37 | |||||||
(1) As a result of the business combinations, we updated the determination of earnings available for distribution to exclude non-recurring acquisition-related transaction expenses, non-cash amortization of intangibles and depreciation expenses, and non-cash imputed compensation expenses. These expenses are excluded as they relate to our business combinations and are not directly related to our income generating activities.
(2) Non-cash amortization of intangibles and depreciation expenses related to acquisitions.
(3) Tax impact on non-cash amortization of intangibles and depreciation expenses related to business combinations.
The table below summarizes the reconciliation from weighted-average diluted shares under GAAP to the weighted-average adjusted diluted shares used for Earnings available for distribution for the periods reported below.
| For the Quarters Ended | |||||||||||||||||
| December 31, 2025 | September 30, 2025 | June 30, 2025 | March 31, 2025 | December 31, 2024 | |||||||||||||
| Weighted average diluted shares - GAAP | 83,942,704 | 81,507,492 | 82,600,108 | 82,394,218 | 81,266,223 | ||||||||||||
Potentially dilutive shares (1) | — | 1,377,857 | — | — | 1,263,734 | ||||||||||||
| Adjusted weighted average diluted shares - Earnings available for distribution | 83,942,704 | 82,885,349 | 82,600,108 | 82,394,218 | 82,529,957 | ||||||||||||
(1) Potentially dilutive shares related to restricted stock units and performance stock units excluded from the computation of weighted average GAAP diluted shares because their effect would have been anti-dilutive given the GAAP net loss available to common shareholders for the quarters ended September 30, 2025 and December 31, 2024.
Earnings available for distribution for the year ended December 31, 2025 were $141 million, or $1.68 per average diluted common share, and increased by $20 million, compared to $121 million, or $1.48 per average diluted common share for the year ended December 31, 2024. As discussed earlier, the increase in Earnings available for distribution was primarily due to our portfolio reallocation efforts, investment and asset management fee revenue and purchase of HomeXpress.
Net Income (Loss) and Return on Total Stockholders' Equity
The table below shows our Net income (loss) and Economic net interest income as a percentage of average stockholders' equity Earnings available for distribution as a percentage of average common stockholders' equity, and Average Tangible Common Equity. Return on average equity is defined as our GAAP net income (loss) as a percentage of average equity. Average equity is defined as the average of our beginning and ending stockholders' equity balance for the period reported. Economic net interest income and Earnings available for distribution are non-GAAP measures as defined in previous sections. Tangible Common Equity is a non-GAAP measure and is defined below.
77
| Return on Average Equity | Economic Net Interest Income/Average Equity (1) | Earnings available for distribution/Average Common Equity | Earnings available for distribution/Average Tangible Common Equity | |||||||||||
| (Ratios have been annualized) | ||||||||||||||
| For the Year Ended December 31, 2025 | 8.91 | % | 10.88 | % | 8.51 | % | 8.91 | % | ||||||
| For the Year Ended December 31, 2024 | 6.72 | % | 10.72 | % | 7.16 | % | 7.20 | % | ||||||
| For the Year Ended December 31, 2023 | 4.87 | % | 10.45 | % | 7.19 | % | 7.19 | % | ||||||
| For the Quarter Ended December 31, 2025 | 4.41 | % | 10.75 | % | 11.00 | % | 11.91 | % | ||||||
| For the Quarter Ended September 30, 2025 | (0.09) | % | 10.56 | % | 7.26 | % | 7.44 | % | ||||||
| For the Quarter Ended June 30, 2025 | 5.38 | % | 10.49 | % | 7.54 | % | 7.72 | % | ||||||
| For the Quarter Ended March 31, 2025 | 25.89 | % | 11.19 | % | 8.10 | % | 8.32 | % | ||||||
(1) Includes our Economic Net Interest Income and Average equity on our Investment Portfolio.
Return on average equity was 8.91% for year ended December 31, 2025, as compared to 6.72% for the year ended December 31, 2025. This increase was primarily driven by higher mark to market gains on our investment portfolio. Economic net interest income as a percentage of average equity on our in increased by 16 basis points for the year ended December 31, 2025 as compared to the year ended December 31, 2024. Earnings available for distribution as a percentage of average common equity increased by 135 basis points for the year ended December 31, 2025, as compared to the year ended December 31, 2024.
Tangible Common Equity is a non-GAAP measure and is defined as Total stockholders' equity available to common stockholders less intangible assets and goodwill related to the business acquisitions. We believe that this measure helps our management and investors understand our capital adequacy and changes from period to period in our common stockholders' equity exclusive of changes of intangible assets. The following table presents a reconciliation of Total Stockholders’ Equity to Tangible Common Equity as of December 31, 2025.
| For the Quarters Ended | |||||||||||||||||
| December 31, 2025 | September 30, 2025 | June 30, 2025 | March 31, 2025 | December 31, 2024 | |||||||||||||
| (dollars in thousands) | |||||||||||||||||
| Total stockholders' equity | $ | 2,572,694 | $ | 2,571,238 | $ | 2,624,530 | $ | 2,644,064 | $ | 2,526,189 | |||||||
| Less: Preferred Stock | (930,000) | (930,000) | (930,000) | (930,000) | (930,000) | ||||||||||||
| Total stockholders' equity available to common stockholders | $ | 1,642,694 | $ | 1,641,238 | $ | 1,694,530 | $ | 1,714,064 | $ | 1,596,189 | |||||||
| Less: Intangibles | (114,246) | (18,124) | (18,971) | (19,818) | (20,665) | ||||||||||||
| Less: Goodwill | (95,342) | (22,152) | (22,152) | (22,152) | (22,152) | ||||||||||||
| Total Intangibles & Goodwill | (209,588) | (40,276) | (41,123) | (41,970) | (42,817) | ||||||||||||
| Tangible Common Equity | $ | 1,433,106 | $ | 1,600,962 | $ | 1,653,407 | $ | 1,672,094 | $ | 1,553,372 | |||||||
Financial Condition
Portfolio Review
During the year ended December 31, 2025, we focused our efforts on taking advantage of relative value opportunities while simultaneously increasing our liquid securities allocation. During the year ended December 31, 2025, on an aggregate basis, we purchased $4.7 billion of investments and received $1.8 billion in principal payments related to our Agency MBS, Non-Agency RMBS and Loans held for investment portfolio.
The following table summarizes certain characteristics of our portfolio at December 31, 2025 and December 31, 2024.
| December 31, 2025 | December 31, 2024 | |||||||
| (dollars in thousands) | ||||||||
Interest earning assets at period-end (1) | $ | 15,017,791 | $ | 12,780,065 | ||||
| Interest bearing liabilities at period-end | $ | 13,070,591 | $ | 10,014,759 | ||||
| GAAP Leverage at period-end | 5.1:1 | 4.0:1 | ||||||
| GAAP Leverage at period-end (recourse) | 2.4:1 | 1.2:1 | ||||||
(1) Excludes cash and cash equivalents.
78
| December 31, 2025 | December 31, 2024 | December 31, 2025 | December 31, 2024 | ||||||||||||||
| Portfolio Composition | Amortized Cost | Fair Value | |||||||||||||||
| Non-Agency RMBS | 5.5 | % | 7.9 | % | 5.8 | % | 8.3 | % | |||||||||
| Senior | 2.9 | % | 3.7 | % | 3.6 | % | 4.8 | % | |||||||||
| Subordinated | 1.6 | % | 3.0 | % | 1.6 | % | 2.9 | % | |||||||||
| Interest-only | 1.0 | % | 1.2 | % | 0.6 | % | 0.6 | % | |||||||||
| Agency RMBS | 24.1 | % | 3.7 | % | 24.2 | % | 3.7 | % | |||||||||
| Pass-through | 21.6 | % | — | % | 21.8 | % | — | % | |||||||||
| CMO | 2.4 | % | 3.6 | % | 2.3 | % | 3.6 | % | |||||||||
| Interest-only | 0.1 | % | 0.1 | % | 0.1 | % | 0.1 | % | |||||||||
| Agency CMBS | 0.3 | % | 0.4 | % | 0.2 | % | 0.4 | % | |||||||||
| Project loans | 0.3 | % | 0.3 | % | 0.2 | % | 0.3 | % | |||||||||
| Interest-only | 0.0 | % | 0.1 | % | 0.1 | % | 0.1 | % | |||||||||
| Loans held for investment | 69.8 | % | 88.0 | % | 69.5 | % | 87.6 | % | |||||||||
| Interests in MSR financing receivables | 0.3 | % | N/A | 0.3 | % | N/A | |||||||||||
| Fixed-rate percentage of portfolio | 86.5 | % | 87.9 | % | 86.1 | % | 87.3 | % | |||||||||
| Adjustable-rate percentage of portfolio | 13.5 | % | 12.1 | % | 13.9 | % | 12.7 | % | |||||||||
GAAP leverage at period-end is calculated as a ratio of our secured financing agreements and securitized debt liabilities over GAAP book value. GAAP recourse leverage is calculated as a ratio of our secured financing agreements over stockholders' equity.
The following table presents details of each asset class in our portfolio, excluding interests in MSR financing receivables, at December 31, 2025 and December 31, 2024. The principal or notional value represents the interest income earning balance of each class. The weighted average figures are weighted by each investment’s respective principal/notional value in the asset class.
| December 31, 2025 | |||||||||||||||||||||||||||||||||||
| Principal or Notional Value at Period-End (dollars in thousands) | Weighted Average Amortized Cost Basis | Weighted Average Fair Value | Weighted Average Coupon | Weighted Average Yield at Period-End (1) | Weighted Average 3 Month Prepay Rate at Period-End | Weighted Average 12 Month Prepay Rate at Period-End | Weighted Average 3 Month CDR at Period-End | Weighted Average 12 Month CDR at Period-End | Weighted Average Loss Severity(2) | Weighted Average Credit Enhancement | |||||||||||||||||||||||||
| Non-Agency RMBS | |||||||||||||||||||||||||||||||||||
| Senior | $ | 852,887 | $ | 42.78 | $ | 59.21 | 5.7 | % | 20.3 | % | 4.5 | % | 4.6 | % | 2.4 | % | 2.2 | % | 23.6 | % | 1.1 | % | |||||||||||||
| Subordinated | 453,269 | 48.99 | 51.47 | 4.2 | % | 9.3 | % | 8.7 | % | 8.3 | % | 1.6 | % | 0.8 | % | 46.6 | % | 4.7 | % | ||||||||||||||||
| Interest-only | 2,428,976 | 6.03 | 3.25 | 0.8 | % | 4.4 | % | 5.1 | % | 5.1 | % | 1.4 | % | 1.2 | % | 43.5 | % | — | % | ||||||||||||||||
| Agency RMBS | |||||||||||||||||||||||||||||||||||
| Pass-through | 3,096,299 | 97.79 | 99.52 | 5.0 | % | 5.3 | % | 9.6 | % | 6.3 | % | N/A | N/A | N/A | N/A | ||||||||||||||||||||
| CMO | 330,871 | 99.94 | 100.31 | 5.1 | % | 5.1 | % | 18.7 | % | 12.3 | % | N/A | N/A | N/A | N/A | ||||||||||||||||||||
| Interest-only | 367,866 | 5.07 | 4.04 | 0.6 | % | 6.5 | % | 7.8 | % | 8.7 | % | N/A | N/A | N/A | N/A | ||||||||||||||||||||
| Agency CMBS | |||||||||||||||||||||||||||||||||||
| Project loans | 39,693 | 101.52 | 81.98 | 3.4 | % | 3.3 | % | — | % | — | % | N/A | N/A | N/A | N/A | ||||||||||||||||||||
| Interest-only | 123,375 | 2.67 | 2.11 | 0.7 | % | 13.0 | % | — | % | — | % | N/A | N/A | N/A | N/A | ||||||||||||||||||||
| Loans held for investment | |||||||||||||||||||||||||||||||||||
| Re-performing Loans | 8,946,869 | 97.86 | 98.21 | 5.2 | % | 5.5 | % | 6.7 | % | 6.6 | % | 0.6 | % | 0.4 | % | 34.4 | % | 9.3 | % | ||||||||||||||||
| Prime Loans | 386,617 | 90.91 | 94.50 | 4.3 | % | 5.9 | % | 5.9 | % | 4.1 | % | — | % | — | % | 37.8 | % | — | % | ||||||||||||||||
| Investor Loans | 569,775 | 102.11 | 104.20 | 7.5 | % | 7.1 | % | 18.2 | % | 12.9 | % | — | % | — | % | 32.4 | % | 12.4 | % | ||||||||||||||||
| Business Purpose Loans | 85,339 | 99.50 | 96.45 | 8.4 | % | 9.0 | % | 25.2 | % | 30.5 | % | 0.4 | % | 0.5 | % | 14.1 | % | — | % | ||||||||||||||||
(1) Bond Equivalent Yield at period-end. Weighted Average Yield is calculated using each investment's respective amortized cost.
(2) Calculated based on reported losses to date, utilizing widest data set available (i.e., life-time losses, 12-month loss, etc.)
79
| December 31, 2024 | |||||||||||||||||||||||||||||||||||
| Principal or Notional Value at Period-End (dollars in thousands) | Weighted Average Amortized Cost Basis | Weighted Average Fair Value | Weighted Average Coupon | Weighted Average Yield at Period-End (1) | Weighted Average 3 Month Prepay Rate at Period-End | Weighted Average 12 Month Prepay Rate at Period-End | Weighted Average 3 Month CDR at Period-End | Weighted Average 12 Month CDR at Period-End | Weighted Average Loss Severity(2) | Weighted Average Credit Enhancement | |||||||||||||||||||||||||
| Non-Agency RMBS | |||||||||||||||||||||||||||||||||||
| Senior | $ | 1,010,128 | $ | 45.11 | $ | 60.83 | 5.7 | % | 17.6 | % | 4.5 | % | 4.9 | % | 1.1 | % | 1.5 | % | 14.7 | % | 1.9 | % | |||||||||||||
| Subordinated | 648,977 | 59.18 | 57.99 | 4.5 | % | 8.0 | % | 7.4 | % | 7.0 | % | 1.1 | % | 0.8 | % | 29.7 | % | 6.8 | % | ||||||||||||||||
| Interest-only | 2,644,741 | 5.81 | 2.77 | 0.7 | % | 6.6 | % | 5.0 | % | 5.3 | % | 0.8 | % | 0.8 | % | 39.5 | % | — | % | ||||||||||||||||
| Agency RMBS | |||||||||||||||||||||||||||||||||||
| CMO | 464,640 | 99.97 | 99.36 | 5.8 | % | 5.8 | % | 15.7 | % | — | % | N/A | N/A | N/A | N/A | ||||||||||||||||||||
| Interest-only | 380,311 | 5.15 | 4.41 | 0.6 | % | 6.9 | % | 9.4 | % | 9.0 | % | N/A | N/A | N/A | N/A | ||||||||||||||||||||
| Agency CMBS | |||||||||||||||||||||||||||||||||||
| Project loans | 40,882 | 101.51 | 84.07 | 3.5 | % | 3.4 | % | — | % | — | % | N/A | N/A | N/A | N/A | ||||||||||||||||||||
| Interest-only | 449,437 | 1.36 | 1.43 | 0.5 | % | 8.9 | % | — | % | — | % | N/A | N/A | N/A | N/A | ||||||||||||||||||||
| Loans held for investment | |||||||||||||||||||||||||||||||||||
| Re-performing Loans | 10,322,156 | 98.05 | 96.14 | 5.5 | % | 5.6 | % | 6.7 | % | 6.2 | % | 0.7 | % | 0.7 | % | 25.1 | % | 8.3 | % | ||||||||||||||||
| Prime Loans | 420,446 | 90.75 | 92.50 | 4.3 | % | 5.9 | % | 6.0 | % | 4.1 | % | — | % | — | % | 37.8 | % | — | % | ||||||||||||||||
| Investor Loans | 573,748 | 102.04 | 98.64 | 6.5 | % | 6.4 | % | 12.6 | % | 9.8 | % | — | % | — | % | — | % | 14.7 | % | ||||||||||||||||
| Business Purpose Loans | 343,071 | 100.74 | 100.01 | 6.8 | % | 8.9 | % | 27.8 | % | 14.3 | % | 1.2 | % | 0.2 | % | 4.5 | % | 6.8 | % | ||||||||||||||||
(1) Bond Equivalent Yield at period-end. Weighted Average Yield is calculated using each investment's respective amortized cost.
(2) Calculated based on reported losses to date, utilizing widest data set available (i.e., life-time losses, 12-month loss, etc.)
Based on the projected cash flows for our Non-Agency RMBS that are not of high credit quality, a portion of the original purchase discount is designated as Accretable Discount, which reflects the purchase discount expected to be accreted into interest income, and a portion is designated as Non-Accretable Difference, which represents the contractual principal on the security that is not expected to be collected. The amount designated as Non-Accretable Difference may be adjusted over time, based on the actual performance of the security, its underlying collateral, actual and projected cash flow from such collateral, economic conditions and other factors. If the performance of a security is more favorable than previously estimated, a portion of the amount designated as Non-Accretable Difference may be transferred to Accretable Discount and accreted into interest income over time. Conversely, if the performance of a security is less favorable than previously estimated, a provision for credit loss may be recognized resulting in an increase in the amounts designated as Non-Accretable Difference.
The following table presents changes to Accretable Discount (net of premiums) as it pertains to our Non-Agency RMBS portfolio, excluding premiums on interest-only investments, during the previous five quarters.
| For the Quarters Ended | |||||||||||||||||
| (dollars in thousands) | |||||||||||||||||
| Accretable Discount (Net of Premiums) | December 31, 2025 | September 30, 2025 | June 30, 2025 | March 31, 2025 | December 31, 2024 | ||||||||||||
| Balance, beginning of period | $ | 89,297 | $ | 108,412 | $ | 110,861 | $ | 117,203 | $ | 123,953 | |||||||
| Accretion of discount | (8,795) | (10,803) | (8,253) | (7,705) | (8,855) | ||||||||||||
| Purchases | — | — | — | — | — | ||||||||||||
| Sales | (4,224) | (10,786) | 188 | — | — | ||||||||||||
| Elimination in consolidation | — | — | — | — | — | ||||||||||||
| Transfers from/(to) credit reserve, net | 3,144 | 2,474 | 5,616 | 1,363 | 2,105 | ||||||||||||
| Balance, end of period | $ | 79,422 | $ | 89,297 | $ | 108,412 | $ | 110,861 | $ | 117,203 | |||||||
Liquidity and Capital Resources
General
Liquidity measures our ability to meet cash requirements, including for ongoing borrowing commitments such as margin calls on non-MTM facilities, purchases of RMBS, residential mortgage loans and other assets for our portfolio, payment of dividends and other general business needs. Our principal sources of capital and funds for additional investments primarily include earnings, principal paydowns and sales from our investments, borrowings under securitizations and re-securitizations, secured financing agreements and other financing facilities, including warehouse facilities, and proceeds from equity or other securities
80
offerings. Over the past several months, we have deliberately positioned the portfolio to maintain flexibility and to meet liquidity needs as they arise, including the HomeXpress Acquisition that closed on October 1, 2025.
Our ability to fund our operations, meet financial obligations and finance target asset acquisitions may be impacted by our ability to secure and maintain our master secured financing agreements, warehouse facilities and secured financing agreement facilities with our counterparties. Because secured financing agreements and warehouse facilities are short-term commitments of capital, lenders may respond to market conditions making it more difficult for us to renew or replace on a continuous basis our maturing short-term borrowings and have and may continue to impose more onerous conditions when rolling forward such financings. If we are not able to renew our existing facilities or arrange for new financing on terms acceptable to us, or if we default on our covenants or are otherwise unable to access funds under our financing facilities, or if we are required to post more collateral or face larger haircuts, we may have to curtail our asset acquisition activities and dispose of assets.
To meet our short-term (one year or less) liquidity needs, we expect to continue to borrow funds in the form of secured financing agreements and, subject to market conditions, other types of financing. The terms of the secured financing transaction borrowings under our master secured financing agreement generally conform to the terms in the standard master secured financing agreement as published by the Securities Industry and Financial Markets Association, (“SIFMA”) or similar market accepted agreements, as to repayment and margin requirements. In addition, each lender typically requires that we include supplemental terms and conditions to the standard master secured financing agreement. Typical supplemental terms and conditions include changes to the margin maintenance requirements, net asset value, required “haircuts” (which are the difference expressed in percentage terms between the fair value of the collateral and the amount the counterpart will lend to us) purchase price maintenance requirements, and requirements that all disputes related to the secured financing agreement be litigated or arbitrated in a particular jurisdiction. These provisions may differ for each of our lenders.
To meet our longer-term liquidity needs (greater than one year), we expect our principal sources of capital and funds to continue to be provided by earnings, principal paydowns and sales from our investments, borrowings under securitizations and re-securitizations, secured financing agreements and other financing facilities, as well as proceeds from equity, debt or other securities offerings.
In addition to the principal sources of capital described above, we may enter into warehouse facilities and use longer-dated structured secured financing agreements. The use of any particular source of capital and funds will depend on market conditions, availability of these facilities, and the investment opportunities available to us.
Current Period
We held cash and cash equivalents of approximately $279 million and $84 million at December 31, 2025 and December 31, 2024, respectively. As a result of our operating, investing and financing activities described below, our cash position increased by $195 million from December 31, 2024 to December 31, 2025.
Our operating activities used net cash of approximately $249 million and provided $206 million for the year ended December 31, 2025 and 2024, respectively. The cash flows from operations were primarily driven by cash used of $374 million related to our mortgage origination activities offset in part by interest received in excess of interest paid of $265 million during the year ended December 31, 2025. The cash flows from operations were primarily driven by interest received in excess of interest paid of $282 million during the year ended December 31, 2024.
Our investing activities used cash of $1.7 billion and provided cash of $178 million for the year ended December 31, 2025 and 2024, respectively. During the year ended December 31, 2025, we used cash to purchase $4.2 billion of Agency MBS and $441 million of Loans held for investment, which were offset by cash received for principal repayments on Agency MBS, Non-Agency RMBS and Loans held for investment of $1.8 billion, collectively. We also used cash for the HomeXpress acquisition during the year ended December 31, 2025. During the year ended December 31, 2024, we used cash to purchase $1.1 billion Agency MBS, $657 million Loans held for investment and $96 million Non-Agency RMBS offset by cash received for principal repayments on Agency MBS, Non-Agency RMBS and Loans held for investment of $1.5 billion and from the sale of our Agency MBS of $569 million
Our financing activities provided cash of $2.1 billion and used cash of $522 million for the year ended December 31, 2025 and 2024, respectively. During the year ended December 31, 2025, we received cash from net proceeds on our secured financing agreements of $2.7 billion, and proceeds received from our secured debt borrowings of $1.0 billion. This cash received was offset in part by cash used for repayment of principal on our securitized debt of $1.5 billion, and payment of common and preferred dividends of $209 million. During the year ended December 31, 2024, we received cash from net proceeds on our secured financing agreements of $398 million, and issuance of unsecured notes of $134 million. This cash received was offset
81
in part by cash used for repayment of principal on our securitized debt of $1.2 billion, and payment of common and preferred dividends of $223 million.
Our recourse leverage increased at December 31, 2025 to 2.4:1 as compared to 1.2:1 at December 31, 2024. This increase was primarily driven by higher borrowings under secured financing agreements to finance our Agency RMBS purchases. Our recourse leverage excludes the securitized debt which can only be repaid from the proceeds on the assets securing this debt in their respective VIEs. Our recourse leverage is presented as a ratio of our secured financing agreements and long-term debt, which are recourse to our assets and our equity.
Based on our current portfolio, leverage ratio and available borrowing arrangements, we believe our assets will be sufficient to enable us to meet anticipated short-term liquidity requirements. However, if our cash resources are insufficient to satisfy our liquidity requirements, we may sell additional investments, reduce our dividends, or issue debt or additional common or preferred equity securities to meet our liquidity needs. As of December 31, 2025 and December 31, 2024, we had $249 million and $526 million of unencumbered assets available to us which can be pledged to access additional short-term financing or sold to raise additional cash, if necessary.
At December 31, 2025 and December 31, 2024, the remaining maturities and borrowing rates on our RMBS and loan secured financing agreements were as follows. The acquisition of HomeXpress added $802 million of secured financing that had a weighted average borrowing rate of 5.84%.
| December 31, 2025 | December 31, 2024 | ||||||||||||||||||||||
| (dollars in thousands) | |||||||||||||||||||||||
Principal (1) | Weighted Average Borrowing Rates | Range of Borrowing Rates | Principal | Weighted Average Borrowing Rates | Range of Borrowing Rates | ||||||||||||||||||
| Overnight | $ | — | N/A | N/A | $ | — | N/A | N/A | |||||||||||||||
| 1 to 29 days | 2,630,804 | 4.15% | 3.93% - 6.76% | 642,358 | 5.61% | 4.66% - 7.52% | |||||||||||||||||
| 30 to 59 days | 781,654 | 4.86% | 3.94% - 6.54% | 959,559 | 7.79% | 5.34% - 12.50% | |||||||||||||||||
| 60 to 89 days | 722,995 | 4.75% | 3.90% - 6.54% | 318,750 | 5.58% | 4.87% - 7.02% | |||||||||||||||||
| 90 to 119 days | 263,081 | 6.78% | 5.37% - 6.97% | 51,416 | 6.38% | 5.51% - 6.77% | |||||||||||||||||
| 120 to 180 days | 96,153 | 5.47% | 5.36% - 6.54% | 123,072 | 6.15% | 5.82% - 6.77% | |||||||||||||||||
| 180 days to 1 year | 810,443 | 6.03% | 4.77% - 8.38% | 409,760 | 6.79% | 5.80% - 7.49% | |||||||||||||||||
| 1 to 2 years | 733,206 | 6.79% | 4.98% - 8.15% | — | N/A | N/A | |||||||||||||||||
| 2 to 3 years | — | —% | —% - —% | 337,245 | 5.02% | 5.02% - 5.02% | |||||||||||||||||
| Total | $ | 6,038,336 | 5.02% | $ | 2,842,160 | 6.48% | |||||||||||||||||
(1) The values for secured financing agreements in the table above is net of $271 thousand of deferred financing costs as of December 31, 2025.
Average remaining maturity of Secured financing agreements secured by:
| December 31, 2025 | December 31, 2024 | |||||||
| Agency RMBS | 26 Days | 16 Days | ||||||
| Agency CMBS | 8 Days | 8 Days | ||||||
| Non-Agency RMBS and Loans held for investment | 278 Days | 237 Days | ||||||
We collateralize the secured financing agreements we use to finance our operations with our MBS investments and mortgage loans held in trusts controlled by us. Our counterparties negotiate a “haircut”, which is the difference expressed in percentage terms between the fair value of the collateral and the amount the counterparty will lend to us, when we enter into a financing transaction. The size of the haircut reflects the perceived risk and market volatility associated with holding the MBS by the lender. The haircut provides lenders with a cushion for daily market value movements that reduce the need for a margin call to be issued or margin to be returned as normal daily increases or decreases in MBS market values occur. At December 31, 2025, the weighted average haircut on the Company's secured financing agreements collateralized by Agency RMBS was 4.4%, Agency CMBS was 5.4%, Loans-held for sale was 7.3% and Non-Agency RMBS and Loans held for investment was 27.1%. At December 31, 2024, the weighted average haircut on the Company's secured financing agreements collateralized by Agency RMBS was 5.1%, Agency CMBS was 5.5% and Non-Agency RMBS and Loans held for investment was 26.0%.
Because the fair value of the Non-Agency MBS is more difficult to determine in current financial conditions, as well as more volatile period to period than Agency MBS, the Non-Agency MBS typically requires a larger haircut. In addition, when financing assets using the standard form of SIFMA Master Repurchase Agreements, the counterparty to the agreement typically
82
nets its exposure to us on all outstanding repurchase agreements and issues margin calls if movement of the fair values of the assets in the aggregate exceeds their allowable exposure to us. A decline in asset fair values could create a margin call or may create no margin call depending on the counterparty’s specific policy. In addition, counterparties consider a number of factors, including their aggregate exposure to us as a whole and the number of days remaining before the repurchase transaction closes prior to issuing a margin call. To minimize the risk of margin calls, as of December 31, 2025, we have entered into $890 million of financing arrangements for which the collateral cannot be adjusted as a result of changes in market value, minimizing the risk of a margin call as a result in price volatility. We refer to these agreements as non-MTM facilities. These non-MTM facilities generally have higher costs of financing, but lower the risk of a margin call which could result in sales of our assets at distressed prices. All non-MTM facilities are collateralized by Non-Agency RMBS collateral, which tends to have increased volatile price changes during periods of market stress. In addition we have entered into certain secured financing agreements that are not subject to additional margin requirement until the drop in fair value of collateral is greater than a threshold. We refer to these agreements as limited MTM facilities. As of December 31, 2025 we have $402 million of limited MTM facilities. We believe these non-MTM and limited MTM facilities significantly reduce our financing risks. See Note 6 to our consolidated financial statements for a discussion on how we determine the fair values of the RMBS collateralizing our secured financing agreements.
At December 31, 2025, the weighted average borrowing rates for our secured financing agreements collateralized by Agency RMBS was 4.0%, Agency CMBS was 4.0%, Loans held for sale was 5.84% and Non-Agency MBS and Loans held for investment was 6.4%. At December 31, 2024, the weighted average borrowing rates for our secured financing agreements collateralized by Agency RMBS was 4.8%, Agency CMBS was 4.8% and Non-Agency MBS and Loans held for investment was 6.8%.
We entered into a secured financing agreement during the fourth quarter of 2022 for which we have elected fair value option. We believe electing fair value for this financial instrument better reflects the transactional economics. The total principal balance outstanding on this secured financing at December 31, 2025 and December 31, 2024 was $306 million and $337 million, respectively. The fair value of collateral pledged was $360 million and $383 million as of December 31, 2025 and December 31, 2024, respectively. We carry this secured financing instrument at fair value of $299 million and $319 million as of December 31, 2025 and December 31, 2024, respectively. At December 31, 2025 and December 31, 2024, the weighted average borrowing rate on secured financing agreements at fair value was 5.0%. At December 31, 2025 and December 31, 2024, the haircut for the secured financing agreements at fair value was 7.5%. At December 31, 2025, the maturity on the secured financing agreements at fair value was two years.
The table below presents our average daily secured financing agreements balance and the secured financing agreements balance at each period end for the periods presented. Our balance at period-end tends to fluctuate from the average daily balances due to adjustments to the size of our portfolio resulting from the use of leverage. The acquisition of HomeXpress added $802 million of secured financing as of December 31, 2025 and this financing average $621 million during the quarter ending December 31, 2025.
| Period | Average secured financing agreements balances | Secured financing agreements balance at period end | ||||||
| (dollars in thousands) | ||||||||
| Quarter End December 31, 2025 | $ | 5,589,698 | $ | 6,031,182 | ||||
| Quarter End September 30, 2025 | $ | 4,799,281 | $ | 4,876,986 | ||||
| Quarter End June 30, 2025 | $ | 3,806,015 | $ | 4,563,063 | ||||
| Quarter End March 31, 2025 | $ | 2,925,366 | $ | 2,994,191 | ||||
| Quarter End December 31, 2024 | $ | 3,019,337 | $ | 2,824,371 | ||||
Our secured financing agreements do not require us to maintain any specific leverage ratio. We believe the appropriate leverage for the particular assets we are financing depends on the credit quality and risk of those assets. At December 31, 2025 and December 31, 2024, the carrying value of our total interest-bearing debt was approximately $13.1 billion and $9.9 billion, respectively, which represented a leverage ratio of approximately 5.1:1 and 4.0:1, respectively. We include our secured financing agreements, long term debt, and securitized debt in the numerator of our leverage ratio and stockholders’ equity as the denominator.
At December 31, 2025, we had secured financing agreements with 20 counterparties. All of our secured financing agreements are secured by Agency MBS, Non-Agency RMBS and Loans held for investment and cash. Under these secured financing agreements, we may not be able to reclaim our collateral but will still be obligated to pay our repurchase obligations. We mitigate this risk by ensuring our counterparties are rated financial institutions. As of December 31, 2025 and December 31,
83
2024, we had $7.4 billion and $4.1 billion, respectively, of securities or cash pledged against our secured financing agreements obligations.
We expect to enter into new secured financing agreements at maturity; however, there is a risk that we will not be able to renew our secured financing agreements when we desire to renew them or obtain favorable interest rates and haircuts as a result of uncertainty in the market including, but not limited to, uncertainty as a result of inflation and increases in the federal funds rate. We offset the interest rate risk of our repurchase agreements primarily through the use of derivatives, which primarily consist of interest rate swaps, Swap futures, swaptions, U.S. Treasury futures and interest rate caps. The average remaining maturities on our interest rate swaps at December 31, 2025 was less than six years. All of our swaps are cleared by a central clearing house. When our interest rate swaps are in a net loss position (expected cash payments are in excess of expected cash receipts on the swaps), we post collateral as required by the terms of our swap agreements. The average remaining maturities on our Swap futures at December 31, 2025 is three years. The Swap futures are exchange traded instrument. Similar to our interest rate swaps, we post collateral when we are in a net loss position. The interest rate cap has a two-year maturity with a potential payment every ninety days from the initial settlement date. The payment is dependent upon whether the compounded average market reference rate for the ninety day period is greater than the strike rate on the interest rate cap. We will receive a payment if the difference between the two amounts is positive.
Exposure to Financial Counterparties
We actively manage the number of secured financing counterparties to reduce counterparty risk and manage our liquidity needs. The following table summarizes our exposure to our secured financing agreements counterparties at December 31, 2025:
| December 31, 2025 | ||||||||||||||
| Country | Number of Counterparties | Secured Financing Agreement | Derivative Instruments at Fair Value | Exposure (1) | ||||||||||
| (dollars in thousands) | ||||||||||||||
| United States | 11 | $ | 3,521,181 | $ | (1,662) | $ | 596,133 | |||||||
| Japan | 3 | 1,339,792 | — | 515,065 | ||||||||||
| Canada | 2 | 586,543 | 21,235 | 95,715 | ||||||||||
| Spain | 1 | 35,757 | — | 1,737 | ||||||||||
| South Korea | 1 | 372,959 | — | 16,078 | ||||||||||
| France | 1 | 65,623 | — | 1,907 | ||||||||||
| United Kingdom | 1 | 116,481 | — | 8,969 | ||||||||||
| Total | 20 | $ | 6,038,336 | $ | 19,573 | $ | 1,235,604 | |||||||
(1) Represents the amount of securities and/or cash pledged as collateral to each counterparty less the aggregate of secured financing agreement.
HomeXpress represents $802 million of the counterparty balances and is spread among 7 counterparties. This represents 13% of the secured financing agreements as of December 31, 2025.
We regularly monitor our exposure to financing counterparties for credit risk and allocate assets to these counterparties based, in part, on the credit quality and internally developed metrics measuring counterparty risk. Our exposure to a particular counterparty is calculated as the excess collateral that is pledged relative to the secured financing agreement balance. If our exposure to our financing counterparties exceeds internally developed thresholds, we develop a plan to reduce the exposure to an acceptable level. At December 31, 2025, we had amounts at risk with Nomura of 18% of our equity related to the collateral posted on secured financing agreements. The weighted average maturities of the secured financing agreements with Nomura were 287 days. The amount at risk with Nomura was $459 million. At December 31, 2024, we had amounts at risk with Nomura of 20% of our equity related to the collateral posted on secured financing agreements. The weighted average maturities of the secured financing agreements with Nomura were 108 days. The amount at risk with Nomura was $512 million.
At December 31, 2025, we did not use credit default swaps or other forms of credit protection to hedge the exposures summarized in the table above.
Residential Origination Segment
In addition to warehouse bank covenants, we are also subject to liquidity and net worth requirements established by the FHFA for Freddie Mac seller/servicers and HUD. The FHFA and HUD have established minimum liquidity requirements and net worth requirements for their approved non-depository single-family sellers/servicers in the case of Freddie Mac and HUD:
84
•FHFA liquidity requirement is equal to 0.035% (3.5 basis points) of total Agency servicing UPB at the entity level plus an incremental 200 basis points of the amount by which total nonperforming Agency servicing UPB exceeds 6% of the applicable Agency servicing UPB. Allowable assets to satisfy liquidity requirement include cash and cash equivalents (unrestricted), certain investment-grade securities that are available for sale or held for trading including Agency mortgage-backed securities, obligations of Fannie Mae or Freddie Mac, and U.S. Treasury obligations, and unused and available portions of committed servicing advance lines.
•FHFA net worth requirement is a minimum net worth of $2.5 million plus 0.25% (25 basis points) of UPB at the entity level for total 1-4 unit residential mortgage loans serviced and a tangible net worth/total assets ratio greater than or equal to 6%.
•HUD net worth requirement is equal to $1.0 million plus 1% (100 basis points) of adjusted activity up to a $2.5 million net worth requirement.
These requirements are calculated based on standalone audited financial statements of HomeXpress and we are currently in compliance with the applicable Agency requirements.
Stockholders’ Equity
In January 2024, our Board of Directors updated the authorization of our share repurchase program (the “Share Repurchase Program”) to include our preferred stock and increased the authorization by $33 million back up to $250 million. Such authorization does not have an expiration date, and at present, there is no intention to modify or otherwise rescind such authorization. Shares of our common stock and preferred stock may be purchased in the open market, including through block purchases, through privately negotiated transactions, or pursuant to any trading plan that may be adopted in accordance with Rule 10b5-1 of the Securities Exchange Act of 1934, as amended (the “Exchange Act”). The timing, manner, price and amount of any repurchases will be determined at our discretion and the program may be suspended, terminated or modified at any time, for any reason. Among other factors, we intend to only consider repurchasing shares of our common stock when the purchase price is less than the last publicly reported book value per common share. In addition, we do not intend to repurchase any shares from directors, officers or other affiliates. The program does not obligate us to acquire any specific number of shares, and all repurchases will be made in accordance with Rule 10b-18, which sets certain restrictions on the method, timing, price and volume of stock repurchases.
We did not repurchase any of our common stock during the years ended December 31, 2025 and 2024. The approximate dollar value of shares that may yet be purchased under the Share Repurchase Program is $250 million as of December 31, 2025.
In 2022, we entered into separate Distribution Agency Agreements (the “Existing Sales Agreements”) with each of Credit Suisse Securities (USA) LLC, JMP Securities LLC, Goldman Sachs & Co. LLC, Morgan Stanley & Co. LLC and RBC Capital Markets, LLC. In February 2023, we amended the Existing Sales Agreements and entered into separate Distribution Agency Agreements (together with the Existing Sales Agreements, as amended, the “Sales Agreements”) with J.P. Morgan Securities LLC and UBS Securities LLC (replacing Credit Suisse Securities LLC) to include J.P. Morgan Securities LLC and UBS Securities LLC as additional sales agents. Pursuant to the terms of the Sales Agreements, we may offer and sell shares of our common stock, having an aggregate offering price of up to $500 million from time to time in “at the market offerings” through any of the sales agents under the Securities Act of 1933. We did not issue any shares under the at-the-market sales program during the years ended December 31, 2025 and 2024. The approximate dollar value of shares that may yet be issued under our at-the-market sales program is $426 million as of December 31, 2025.
We declared dividends to Series A preferred stockholders of $12 million, or $2.00 per preferred share, during the years ended December 31, 2025 and December 31, 2024, respectively.
We declared dividends to Series B preferred stockholders of $33 million, or $2.57 per preferred share, during the year ended December 31, 2025. We declared dividends to Series B preferred stockholders of $34 million, or $2.59 per preferred share, during the year ended December 31, 2024.
We declared dividends to Series C preferred stockholders of $21 million, or $2.02 per preferred share, during the year ended December 31, 2025. We declared dividends to Series C preferred stock holders of $20 million, or $1.94 per preferred share, during the year ended December 31, 2024.
We declared dividends to Series D preferred stockholders of $20 million, or $2.50 per preferred share, during the year ended December 31, 2025. We declared dividends to Series D preferred stockholders of $20 million, or $2.55 per preferred share, during the year ended December 31, 2024.
85
On October 30, 2021, all 5,800,000 issued and outstanding shares of Series A Preferred Stock with an outstanding liquidation preference of $145 million became callable at a redemption price equal to the liquidation preference plus accrued and unpaid dividends through, but not including, the redemption date.
On March 30, 2024, all 13,000,000 issued and outstanding shares of Series B Preferred Stock with an outstanding liquidation preference of $325 million became callable at a redemption price equal to the liquidation preference plus accrued and unpaid dividends through, but not including, the redemption date.
On March 30, 2024, all 8,000,000 issued and outstanding shares of Series D Preferred Stock with an outstanding liquidation preference of $200 million became callable at a redemption price equal to the liquidation preference plus accrued and unpaid dividends through, but not including, the redemption date.
On September 30, 2025, all 10,400,000 issued and outstanding shares of Series C Preferred Stock with an outstanding liquidation preference of $260 million became callable at a redemption price equal to the liquidation preference plus accrued and unpaid dividends through, but not including, the redemption date.
After June 30, 2023, all LIBOR tenors relevant to us ceased to be published or became no longer representative. We believe that the federal Adjustable Interest Rate (LIBOR) Act (the “Act”) and the related regulations promulgated thereunder are applicable to each of our Series B Preferred Stock, Series C Preferred Stock and Series D Preferred Stock. In light of the applicability of the Act to the aforementioned preferred stock, we believe, given all of the information available to us to date, that three-month CME Term SOFR plus the applicable tenor spread adjustment of 0.26% per annum have automatically replaced three-month LIBOR as the reference rate for calculations of the dividend rate payable on the relevant preferred stock for dividend periods from and after (i) March 30, 2024, in the case of the Series B Preferred Stock, (ii) September 30, 2025, in the case of the Series C Preferred Stock, and (iii) March 30, 2024, in the case of the Series D Preferred Stock.
Stock Based Compensation
On June 14, 2023, the Board of Directors recommended and shareholders approved, the Chimera Investment Corporation 2023 Equity Incentive Plan (the “Plan”). It authorized the issuance of up to 6,666,667 shares of our common stock for the grant of awards under the Plan (adjusted on a retroactive basis to reflect the Company's 1-for-3-reverse stock split effected on
May 21, 2024). The Plan replaced our 2007 Equity Incentive Plan, as amended and restated effective December 10, 2015 (the “Prior Plan”), and no new awards will be granted under the Prior Plan. Any awards outstanding under the Prior Plan will remain subject to and be paid under the Prior Plan. Any shares subject to outstanding awards under the Prior Plan that expire, terminate, or are surrendered or forfeited for any reason without issuance of shares will automatically become available for issuance under the Plan. Also, shares withheld for tax withholding requirements after stockholder approval of the Plan for full value awards originally granted under the Prior Plan (such as the RSUs and PSUs awarded to our named executive officers) will automatically become available for issuance under the Plan.
As of December 31, 2025, approximately 4 million shares were available for future grants under the Plan.
Awards under the Plan may include stock options, stock appreciation rights, restricted stock, dividend equivalent rights (“DERs”) and other share-based awards (including RSUs). Under the Plan, any of these awards may be performance awards that are conditioned on the attainment of performance goals.
The Compensation Committee had previously approved a Stock Award Deferral Program (the “Deferral Program”). The Deferral Program consisted of two distinct non-qualified deferred compensation plans within the meaning of Section 409A of the Code, as amended, one for non-employee directors (the “Director Plan”) and one for certain executive officers (the “Executive Officer Plan”). Under the Deferral Program, non-employee directors and certain executive officers could elect to defer payment of certain stock awards made pursuant to the Plan. Deferred awards are treated as deferred stock units and paid at the earlier of separation from service or a date elected by the participant who is separating. Payments are generally made in a lump sum or, if elected by the participant, in five annual installments. Deferred awards receive dividend equivalents during the deferral period in the form of additional deferred stock units. Amounts are paid at the end of the deferral period by delivery of shares from the Plan (plus cash for any fractional deferred stock units), less any applicable tax withholdings. Deferral elections do not alter any vesting requirements applicable to the underlying stock award. On November 5, 2024, the Compensation Committee irrevocably terminated the Executive Officer Plan and suspended new deferral elections under the Director Plan. The Executive Officer Plan was liquidated as of November 30, 2025, and all amounts outstanding under the Executive Officer Plan on the liquidation date were paid at that time in accordance with applicable tax rules. All deferrals previously made under the Director Plan will remain outstanding, and all deferrals pursuant to prior elections made by directors will be paid on the originally scheduled payment dates. At December 31, 2025 and December 31, 2024, there are approximately 92 thousand and 124 thousand shares for which payments have been deferred until separation or a date elected by the participant, respectively. At December 31, 2025 and December 31, 2024, there are approximately 269 thousand and 229 thousand DERs earned but not yet delivered, respectively.
86
Grants of RSUs
During the year ended December 31, 2025 and 2024, we granted RSU awards to senior management, employees and directors. These RSU awards are designed to reward our senior management, employees and directors for services provided to us. Generally, the RSU awards vest equally over a three-year period and will fully vest after three years. For employees who are retirement eligible, defined as years of service to us plus age that is equal to or greater than 65, the service period is considered to be fulfilled and all grants are expensed immediately. For senior management who are retirement eligible, defined as having attained age 55 and the sum of his or her age plus his or her years of service is equal or greater than 65, the service period is considered to be fulfilled and all grants are expensed immediately. The RSU awards are valued at the market price of our common stock on the grant date and generally the employees must be employed by us on the vesting dates to receive the RSU awards. We granted 1 million RSU awards during the year ended December 31, 2025 with a grant date fair value of $16 million which includes stock grants to both Chimera and HomeXpress employees for the 2025 performance year. We granted 245 thousand RSU awards during the year ended December 31, 2024 with a grant date fair value of $5 million for the 2024 performance year.
In addition, in connection with the HomeXpress Acquisition, the Compensation Committee adopted the Award Plan, pursuant to which we reserved 540,000 shares of Chimera’s common stock, $0.01 par value per share for issuance under the Award Plan solely to individuals who were not previously employees of Chimera or any subsidiary of Chimera (or who are returning to employment following a bona fide period of interruption of employment with Chimera), in accordance with NYSE Listed Company Manual Rule 303A.08. The Award Plan was approved by the Compensation Committee without shareholder approval pursuant to NYSE Listed Company Manual Rule 303A.08. The Compensation Committee also adopted a form of restricted stock unit award agreement for use with the Award Plan. We issued restricted stock units to certain employees of HomeXpress as a material inducement for such employees to continue their employment with HomeXpress following the completion of the HomeXpress Acquisition. In connection with this transaction, stock-based compensation expense of $7 million will be recognized on a straight-line basis over the three-year vesting period as it relates to the HomeXpress Acquisition.
Grants of Performance Share Units (“PSUs”)
PSU awards are designed to align compensation with the Company’s future performance. The PSU awards granted during the year ended December 31, 2025 and 2024, include a three-year performance period ending on December 31, 2027 and December 31, 2026, respectively. For the PSU awards granted during the year ended December 31, 2025, and 2024, the final number of shares awarded will be between 0% and 200% of the PSUs granted based equally on the Company Economic Return and share price performance compared to a peer group. Our three-year Company Economic Return is equal to the Company’s change in book value per common share plus common stock dividends. Share price performance equals change in share price plus common stock dividends. Compensation expense will be recognized on a straight-line basis over the three-year vesting period based on an estimate of our Economic Return and share price performance in relation to the entities in the peer group and will be adjusted each period based on our best estimate of the actual number of shares awarded. For the year ended December 31, 2025, we granted 296 thousand PSU awards to senior management with a grant date fair value of $4 million. For the year ended December 31, 2024, we granted 179 thousand PSU awards to senior management with a grant date fair value of $3 million.
We recognized stock-based compensation expense of $11 million which includes stock grants to both Chimera and HomeXpress employees for the year ended December 31, 2025. We recognized stock-based compensation expense of $8 million for the year ended December 31, 2024.
At December 31, 2025 and December 31, 2024, there were approximately $2 million and $1 million, respectively, unvested shares of RSUs and PSUs issued to our employees and directors.
Capital Raising Activity
During the third quarter of 2025, we issued $120 million aggregate principal amount (including the additional amount issued pursuant to the exercise of the over-allotment option) of 8.875% Senior Notes due 2030 that pay quarterly interest. After deducting the underwriting discount and other debt issuance costs we received approximately $116 million of proceeds. While we continue to favor securitized debt as a source of financing for our assets, the ability to issue unsecured debt helps us to further diversify our capital structure and provides long-term financing to support our investment activities
Contractual Obligations and Commitments
The following tables summarize our contractual obligations at December 31, 2025 and December 31, 2024. The estimated principal repayment schedule of the securitized debt is based on expected cash flows of the residential mortgage loans or RMBS, as adjusted for expected principal write-downs on the underlying collateral of the debt. The acquisition of HomeXpress added $802 million of uncommitted secured financing agreements that mature within one year.
87
| December 31, 2025 | |||||||||||||||||
| (dollars in thousands) | |||||||||||||||||
| Contractual Obligations | Within One Year | One to Three Years | Three to Five Years | Greater Than or Equal to Five Years | Total | ||||||||||||
| Secured financing agreements | $ | 5,305,130 | $ | 733,206 | $ | — | $ | — | $ | 6,038,336 | |||||||
| Securitized debt, collateralized by Non-Agency RMBS | 8 | 145 | 4 | 28 | 185 | ||||||||||||
| Securitized debt at fair value, collateralized by Loans held for investment | 1,194,768 | 1,960,648 | 1,802,112 | 2,123,842 | 7,081,370 | ||||||||||||
Interest expense on MBS secured financing agreements (1) | 31,990 | 3,946 | — | — | 35,935 | ||||||||||||
Interest expense on securitized debt (1) | 247,789 | 385,515 | 250,747 | 350,176 | 1,234,228 | ||||||||||||
| Total | $ | 6,779,685 | $ | 3,083,460 | $ | 2,052,862 | $ | 2,474,047 | $ | 14,390,054 | |||||||
(1) Interest is based on variable rates in effect as of December 31, 2025.
| December 31, 2024 | |||||||||||||||||
| (dollars in thousands) | |||||||||||||||||
| Contractual Obligations | Within One Year | One to Three Years | Three to Five Years | Greater Than or Equal to Five Years | Total | ||||||||||||
| Secured financing agreements | $ | 2,504,915 | $ | 337,245 | $ | — | $ | — | $ | 2,842,160 | |||||||
| Securitized debt, collateralized by Non-Agency RMBS | — | 13 | — | 13 | 26 | ||||||||||||
| Securitized debt at fair value, collateralized by Loans held for investment | 1,288,028 | 2,091,147 | 1,937,868 | 2,253,020 | 7,570,063 | ||||||||||||
Interest expense on MBS secured financing agreements (1) | 29,737 | 1,364 | — | — | 31,101 | ||||||||||||
Interest expense on securitized debt (1) | 255,162 | 394,250 | 257,323 | 292,081 | 1,198,816 | ||||||||||||
| Total | $ | 4,077,842 | $ | 2,824,019 | $ | 2,195,191 | $ | 2,545,114 | $ | 11,642,166 | |||||||
(1) Interest is based on variable rates in effect as of December 31, 2024.
Not included in the tables above are the unfunded construction loan commitments of $3 million and $5 million as of December 31, 2025 and December 31, 2024. We expect the majority of these commitments will be paid within one year and are reported under Payable for investments purchased in our Consolidated Statements of Financial Condition.
We have made a $75 million capital commitment to a fund managed by Kah Capital Management, LLC. During the quarter and year ended December 31, 2025, we funded an additional $637 thousand towards that commitment, which brought the total funding to $57 million, leaving an unfunded commitment of $18 million.
Capital Expenditure Requirements
At December 31, 2025 and December 31, 2024, we had no material commitments for capital expenditures.
Dividends
To maintain our qualification as a REIT, we must pay annual dividends to our stockholders of at least 90% of our taxable income (subject to certain adjustments). Before we pay any dividend, we must first meet any operating requirements and scheduled debt service on our financing facilities and other debt payable.
Critical Accounting Estimates
Accounting policies are integral to understanding our Management’s Discussion and Analysis of Financial Condition and Results of Operations. The preparation of financial statements in accordance with GAAP requires management to make certain judgments and assumptions, on the basis of information available at the time of the financial statements, in determining accounting estimates used in the preparation of these statements. Our significant accounting policies and accounting estimates are described in Note 2 to the consolidated financial statements. Critical accounting policies are described in this section. An accounting policy is considered critical if it requires management to make assumptions or judgments about matters that are highly uncertain at the time the accounting estimate was made or require significant management judgment in interpreting the accounting literature. If actual results differ from our judgments and assumptions, or other accounting judgments were made, this could have a significant and potentially adverse impact on our financial condition, results of operations and cash flows.
88
The accounting policies and estimates which we consider most critical relate to the recognition of revenue on our investments, including recognition of any losses, and the determination of fair value of our financial instruments. The consolidated financial statements include, on a consolidated basis, our accounts, the accounts of our wholly-owned subsidiaries, and variable interest entities (“VIEs”) for which we are the primary beneficiary. All significant intercompany balances and transactions have been eliminated in consolidation.
Use of Estimates
The preparation of financial statements in conformity with GAAP requires management to make estimates and assumptions that affect the reported amounts of assets and liabilities and disclosure of contingent assets and liabilities at the date of the financial statements and the reported amounts of revenues and expenses during the reporting period. Although our estimates contemplate current conditions and how we expect them to change in the future, it is reasonably possible that actual conditions could be different than anticipated in those estimates, which could materially adversely impact our results of operations and our financial condition. Management has made significant estimates in several areas, including current expected credit losses of Non-Agency RMBS, valuation of Loans held for investments, Agency and Non-Agency MBS, forward interest rates for interest rate swaps, and income recognition on Loans held for investments, Non-Agency RMBS, goodwill, intangibles and contingent earn-out liability. Actual results could differ materially from those estimates.
Recognition of Revenue
We primarily invest in pools of mortgage loans. All mortgage loans are carried at fair value with changes in fair value recognized in earnings. Our investments in mortgage loans pay principal and interest which is accrued when due. We also invest in MBS representing interests in obligations backed by pools of mortgage loans. Our investments in MBS includes investments in both Agency MBS and Non-Agency MBS. We delineate between (1) Agency MBS and (2) Non-Agency RMBS. The Agency MBS are mortgage pass-through certificates, CMOs, and other RMBS representing interests in or obligations backed by pools of residential mortgage loans issued or guaranteed as to principal and/or interest repayment by agencies of the U.S. Government or federally chartered corporations such as Ginnie Mae, Freddie Mac or Fannie Mae. The Non-Agency RMBS are not issued or guaranteed by Fannie Mae, Freddie Mac, or Ginnie Mae and are therefore subject to credit risk. We also invests in IO MBS strips which represent our right to receive a specified proportion of the contractual interest flows of the collateral.
Income on our investments is recognized based on an effective interest rate we expect to earn over the life of the investment. The effective interest rate is determined based on the cost of the investment and the expectation of future cash flows. To determine the future cash flows, we estimate the amount and timing of principal and interest, referred to as the repayment rate, and our expectations of defaults on payments of principal and interest. These estimates require significant judgment which change over time as our expectations change due to changes in market conditions and changes in our investments as principal and interest, other cash flows or losses are experienced. These estimates are compared to actual results of the investment and other similar investments on a regular basis and updated as necessary. These comparisons may result in a favorable or unfavorable change in the effective interest rate expected to be collected. Any favorable or unfavorable changes are reflected as a change in income. Our estimates of the timing and amount of principal and interest, including our expectation of defaults on payments of principal and interest are critical to accurately reporting interest income.
Our accounting policies for recognition of interest income and current expected credit losses related to MBS investments are described in further detail in Note 2 of the consolidated financial statements.
Revenue derived from our origination activities includes certain fees collected at the time of origination and gain or loss from the sale of LHFS. Loan origination income reflects the fees earned, net of lender credits from originating the loans. These consist of fees related to loan origination, discount points, underwriting, processing and other fees. Lender credits typically are related to rebates or concessions for certain loan origination costs.
Determination of Fair Value
Substantially all of our investments are carried at fair value. In accordance with current accounting guidance, fair value of our financial instruments represents the price that would be received to sell an asset or paid to transfer a liability in an orderly transaction between market participants at the financial statement reporting date. We use internally developed models to determine fair value of our investments.
We determine the fair value of all of our Non-Agency RMBS investment securities, including Non-Agency represented as securitized debt, based on discounted cash flows utilizing an internal pricing model that incorporates factors such as coupon, repayment speeds, expected losses, expected loss severity, discount rates and other factors. Estimates of repayment speeds, expected losses and expected loss severity, require significant judgment and are based on what we believe a market participant would use to determine the cash flows. To corroborate that the estimates of fair values generated by these internal models are
89
reflective of current market prices, we compare the fair values generated by the model to non-binding independent prices provided by an independent third-party pricing services.
We estimate the fair value of our Loans held for investment consisting of seasoned subprime residential mortgage loans on a loan-by-loan basis using an internally developed model which compares the loan held by us with a loan currently offered in the market. The loan price is adjusted in the model by considering the loan factors which would impact the value of a loan. These loan factors include loan coupon as compared to coupon currently available in the market, FICO, LTV ratios, delinquency history, owner occupancy, and property type, among other factors. A baseline is developed for each significant loan factor and adjusts the price up or down depending on how that factor for each specific loan compares to the baseline rate. Generally, the most significant impact on loan value is the loan interest rate as compared to interest rates currently available in the market and delinquency history. The determination of the baseline and the market expectation, requires significant judgment. To corroborate that the estimates of fair values generated by these internal models are reflective of current market prices, we compare the fair values generated by the model to non-binding independent prices provided by an independent third-party pricing service.
To the extent the inputs used to estimate fair value are observable, the values would be categorized in Level 2 of the fair value hierarchy; otherwise they would be categorized as Level 3. Our fair value estimation process utilizes inputs other than quoted prices that are observed in the market. Our estimates are deemed to be significant to the fair value measurement process, which renders the resulting Non-Agency fair value estimates Level 3 inputs in the fair value hierarchy. Level 3 assets represent approximately 70% of total assets measured at fair value on a recurring basis as of December 31, 2025 and 2024, respectively. Level 3 liabilities represent approximately 96% of total liabilities measured at fair value on a recurring basis as of December 31, 2025 and 2024, respectively.
Loans Held for Sale
LHFS are measured and reported at fair value. Our fair value election for its LHFS is intended to more accurately reflect the underlying economics of our operations. With the election of the fair value option for LHFS, loan origination fees, and the related direct loan origination costs associated with the origination of LHFS, are earned and expensed as incurred, respectively.
Interest Rate Lock Commitments
Interest rate lock commitments do not trade in an active market. Accordingly, the Company estimates the fair value of IRLCs based on the price an investor would be expected to pay to acquire such commitments, using current secondary market pricing for mortgage loans with similar characteristics.
The valuation incorporates observable market inputs, including loan type, underlying loan balance, borrower credit score, LTV ratio, note rate, loan program, expected loan sale date, and prevailing market conditions. The estimated fair value is adjusted at the individual loan level to reflect the servicing release premium, investor-specific pricing adjustments applicable to each loan, and the estimated direct costs required to convert the IRLC into a funded loan.
The resulting base value is further adjusted for the anticipated pull-through rate, which represents the probability that a locked loan will ultimately fund. The anticipated pull-through rate is an unobservable input derived from our historical funding experience and current pipeline characteristics. An increase in the anticipated pull-through rate results in an increase in the estimated fair value of IRLCs, while a decrease in the anticipated pull-through rate results in a decrease in estimated fair value. Due to the significance of this unobservable input, IRLCs are classified as Level 3 within the fair value hierarchy.
Our accounting policies for the determination of fair value of our investments are described in further detail in Note 2 and Note 7 of the consolidated financial statements.
VIEs
VIEs are defined as entities in which equity investors (i) do not have the characteristics of a controlling financial interest, and/or (ii) do not have sufficient equity at risk for the entity to finance its activities without additional subordinated financial support from other parties. The entity that consolidates a VIE is known as its primary beneficiary and is generally the entity with (i) the power to direct the activities that most significantly impact the VIE’s economic performance, and (ii) the right to receive benefits from the VIE or the obligation to absorb losses of the VIE that could be significant to the VIE. For VIEs’ that do not have substantial on-going activities, the power to direct the activities that most significantly impact the VIEs’ economic performance may be determined by an entity’s involvement with the design of the VIE.
Our Consolidated Statements of Financial Condition contain the assets and liabilities related to 36 consolidated variable interest entities or VIEs. Due to the non-recourse nature of these VIEs our net exposure to loss from investments in these entities is limited to our retained beneficial interests.
90
At December 31, 2025, we consolidated 34 residential mortgage loan securitizations and 2 RMBS re-securitization transactions which are VIEs. The residential mortgage loan securitizations contain jumbo prime and Non-QM residential mortgage loans. The RMBS re-securitization transactions contain Non-Agency RMBS comprised of primarily first lien mortgages of 2005-2007 vintages.
Our determination to consolidate these 36 VIEs was significantly influenced by management’s judgment related to the activities that most significantly impact the economic performance of these entities and the identification of the party with the power over such activities. For the residential mortgage loan securitizations, we determined that our ability to remove the servicer without cause resulted in us having the power that most significantly impacts the economic performance of the VIE. For the three consolidated RMBS re-securitization transactions, we determined that no party has power over any ongoing activities of the entities and therefore the determination of the primary beneficiary should be based on involvement with the initial design of the entity. Since we transferred the RMBS to the securitization entities, we determined we had the power over the design of the entity, which resulted in us being considered the primary beneficiary. This determination was influenced by the amount of economic exposure to the financial performance of the entity and required a significant management judgment in determining that we should consolidate these three entities.
Due to the consolidation of these VIEs, our actual ownership interests in the securitization and re-securitizations have been eliminated in consolidation and the Consolidated Statements of Financial Condition reflect both the assets held and non-recourse debt issued to third parties by these VIEs. In addition, our operating results and cash flows include the gross amounts related to the assets and liabilities of the VIEs as opposed to the actual economic interests we own in these VIEs. Our interest in these VIEs is restricted to the beneficial interests we retained in these transactions. We are not obligated to provide any financial support to these VIEs.
Our Consolidated Statements of Financial Condition separately present: (i) our direct assets and liabilities, and (ii) the assets and liabilities of our consolidated securitization vehicles net of intercompany eliminations representing securities from the securitization trusts retained by us. Assets of all consolidated VIEs can only be used to satisfy the obligations of those VIEs, and the liabilities of consolidated VIEs are non-recourse to us.
We have aggregated all the assets and liabilities of the consolidated securitization vehicles due to our determination that these entities are substantively similar and therefore a further disaggregated presentation would not be more meaningful. The notes to our consolidated financial statements describe our direct assets and liabilities and the assets and liabilities of our consolidated securitization vehicles. See Note 10 to our consolidated financial statements for additional information related to our investments in VIEs.
Recent Accounting Pronouncements
Refer to Note 2 in the Notes to consolidated financial statements for a discussion of accounting guidance we have recently adopted or expect to be adopted in the future.
Item 7A. Quantitative and Qualitative Disclosures about Market Risk
The primary components of our market risk are related to credit risk, interest rate risk, prepayment risk, extension risk, basis risk and market risk. While we do not seek to avoid risk completely, we believe the risk can be quantified from historical experience and we seek to actively manage that risk and to maintain capital levels consistent with the risks we undertake.
Additionally, refer to Item 1A, "“Risk Factors” included in this Annual Report on Form 10-K for the year ended December 31, 2025 for additional information on risks we face.
Credit Risk
We are subject to credit risk in connection with our investments in Non-Agency RMBS and residential mortgage loans and face more credit risk on assets we own that are rated below ‘‘AAA’’ or not rated. The credit risk related to these investments pertains to the ability and willingness of the borrowers to pay, which is assessed before credit is granted or renewed and periodically reviewed throughout the loan or security term. We believe that residential loan credit quality, and thus the quality of our assets, is primarily determined by the borrowers’ credit profiles and loan characteristics.
Through our Residential Origination, we are subject to credit risk related to loans originated prior to the sale to third parties. Loans that default prior to sale are withdrawn from the normal course offering process and are either sold to third-party distressed asset investors or subject to internal loss mitigation, workout, or foreclosure processes. Additionally, pursuant to the
91
terms of the related purchase and sale agreements with third party investors, we are exposed to risks of default after the sale due to certain repurchase obligations that are negotiated at the time of sale.
In connection with loan acquisitions, we or a third party perform an independent review of the mortgage file to assess the origination and servicing of the mortgage loan as well as our ability to enforce the contractual rights in the mortgage. Depending on the size of the loans, we may not review all of the loans in a pool, but rather a sample of loans for diligence review based upon specific risk-based criteria such as property location, loan size, effective LTV ratio, borrower’s characteristics and other criteria we believe to be important indicators of credit risk. Additionally, we obtain representations and warranties from each seller with respect to the residential mortgage loans, including the origination and servicing of the mortgage loan as well as the enforceability of the lien on the mortgaged property. A seller who breaches these representations and warranties in making a loan that we purchase may be obligated to repurchase the loan from us. Our resources include a portfolio management system, as well as third-party software systems. We utilize third-party due diligence firms to perform an independent mortgage loan file review to ensure compliance with existing guidelines. In addition to statistical sampling techniques, we create adverse credit and valuation samples, which we individually review.
Our lending activities also utilize third-party due diligence firms. However, to the extent loans are funded prior to review by the third-party review vendor, and there are adverse findings with respect to such loans, depending on the deficiency we may not be able to sell the loan, or may not be able to obtain a price for the loan that exceeds our cost to originate, in which case we may realize a loss.
Additionally, we closely monitor credit losses incurred, as well as how expectations of credit losses are expected to change on our Non-Agency RMBS and Loans held for investment portfolios. We estimate future credit losses based on historical experience, market trends, current delinquencies as well as expected recoveries. The net present value of these expected credit losses can change, sometimes significantly from period to period as new information becomes available. When credit loss experience and expectations improve, we will collect more principal on our investments. If credit loss experience deteriorates, we will collect less principal on our investments. The favorable or unfavorable changes in credit losses are reflected in the yield on our investments in mortgage loans and recognized in earnings over the remaining life of our investments. The following table presents changes to net present value of expected credit losses for our Non-Agency RMBS and Loans held for investment portfolios during the previous five quarters. Gross losses are discounted at the rate used to amortize any discounts or premiums on our investments into income. A decrease (negative balance) in the "Increase/(decrease)" line item in the tables below represents a favorable change in expected credit losses. An increase (positive balance) in the "Increase/(decrease)" line item in the tables below represents an unfavorable change in expected credit losses.
| For the Quarters Ended | |||||||||||||||||
| (dollars in thousands) | |||||||||||||||||
| Non-Agency RMBS | December 31, 2025 | September 30, 2025 | June 30, 2025 | March 31, 2025 | December 31, 2024 | ||||||||||||
| Balance, beginning of period | $ | 93,781 | $ | 90,565 | $ | 89,065 | $ | 85,305 | $ | 81,368 | |||||||
| Realized losses | (1,441) | (1,539) | (1,613) | (1,811) | (1,182) | ||||||||||||
| Accretion | 3,452 | 3,317 | 3,072 | 2,906 | 2,820 | ||||||||||||
| Losses on purchases | — | — | — | — | — | ||||||||||||
| Losses on sold/paid-off | (142) | (7,328) | — | — | 48 | ||||||||||||
| Increase/(decrease) | (167) | 8,766 | 41 | 2,665 | 2,251 | ||||||||||||
| Balance, end of period | $ | 95,483 | $ | 93,781 | $ | 90,565 | $ | 89,065 | $ | 85,305 | |||||||
| For the Quarters Ended | |||||||||||||||||
| (dollars in thousands) | |||||||||||||||||
| Loans held for investment | December 31, 2025 | September 30, 2025 | June 30, 2025 | March 31, 2025 | December 31, 2024 | ||||||||||||
| Balance, beginning of period | $ | 97,910 | $ | 102,727 | $ | 106,961 | $ | 143,228 | $ | 181,895 | |||||||
| Realized losses | (6,565) | (6,717) | (7,816) | (3,583) | (6,180) | ||||||||||||
| Accretion | 1,312 | 1,385 | 1,439 | 1,087 | 2,584 | ||||||||||||
| Losses on purchases | — | — | — | — | — | ||||||||||||
Increase/(decrease) | 2,202 | 515 | 2,143 | (33,771) | (35,071) | ||||||||||||
| Balance, end of period | $ | 94,859 | $ | 97,910 | $ | 102,727 | $ | 106,961 | $ | 143,228 | |||||||
Additionally, the Non-Agency RMBS which we acquire for our portfolio are reviewed by us to ensure that they satisfy our risk-based criteria. Our review of Non-Agency RMBS includes utilizing a portfolio management system. Our review of Non-Agency RMBS and other ABS is based on quantitative and qualitative analysis of the risk-adjusted returns on Non-Agency
92
RMBS and other ABS. This analysis includes an evaluation of the collateral characteristics supporting the RMBS such as borrower payment history, credit profiles, geographic concentrations, credit enhancement, seasoning, collateral value and other pertinent factors.
Interest Rate Risk
Our net interest income, borrowing activities and profitability could be negatively affected by volatility in interest rates factors that could lead the Federal Reserve to increase its federal funds rate, and a change in the spread between short- and long-term rates could further compress. A prolonged period of extremely volatile and unstable market conditions would likely increase our funding costs and negatively affect market risk mitigation strategies. Higher income volatility from changes in interest rates and spreads to benchmark indices could cause a loss of future net interest income and a decrease in the current fair market values of our assets. Fluctuations in interest rates will impact both the level of income and expense recorded on most of our assets and liabilities and the market value of all interest-earning assets and interest-bearing liabilities, which in turn could have a material adverse effect on our net income, operating results, or financial condition.
Interest rate risk is highly sensitive to many factors, including governmental, monetary and tax policies, domestic and international economic and political considerations and other factors beyond our control. We are subject to interest rate risk in connection with our investments and our related debt obligations, which are generally secured financing agreements and securitization trusts. Our secured financing agreements and warehouse facilities may be of limited duration that is periodically refinanced at current market rates. We typically mitigate this risk through utilization of derivative contracts, primarily interest rate swap agreements, swaptions, interest rate caps, and futures. While we may use interest rate hedges to mitigate risks related
to changes in interest rate, the hedges may not fully offset interest expense movements.
Interest Rate Effects on Mortgage Lending Operations
Higher interest rates may also impact our mortgage lending activities undertaken by HomeXpress. Rising interest rates generally have the effect of reducing housing demand and overall activity as it increases the cost of purchasing a home. Correspondingly, the demand for mortgage credit would likely decline, reducing HomeXpress loan origination volume and related earnings.
In the event that mortgage interest rates are trending lower, our lending operations may be exposed to risks related to early prepayments with respect to loans sold to third parties. In certain instances, pursuant to the terms of the purchase and sale agreements, we may be obliged to reimburse third-party investors that purchase our HomeXpress originated loans for the premium paid on loans that prepay shortly after sale, referred to as premium recapture. Early payoffs in excess of our reserves may adversely affect our earnings.
Interest Rate Effects on Net Interest Income
Our operating results depend, in large part, on differences between the income from our investments and our borrowing costs. Most of our warehouse facilities and secured financing agreements provide financing based on a floating rate of interest calculated on a fixed spread over SOFR. The fixed spread varies depending on the type of underlying asset that collateralizes the financing. During periods of rising interest rates, the borrowing costs associated with our investments tend to increase while the income earned from our investments may remain substantially unchanged or decrease. This will result in a narrowing of the net interest spread between the related assets and borrowings and may even result in losses. Further, defaults could increase and result in credit losses to us, which could adversely affect our liquidity and operating results. Such delinquencies or defaults could also have an adverse effect on the spread between interest-earning assets and interest-bearing liabilities. We generally do not hedge against credit losses. Hedging techniques are partly based on assumed levels of prepayments of our fixed-rate and hybrid adjustable-rate residential mortgage loans and RMBS. If prepayments are slower or faster than assumed, the life of the residential mortgage loans and RMBS will be longer or shorter, which would reduce the effectiveness of any hedging strategies we may use and may cause losses on such transactions. Similarly, if interest rates declined and the levels of prepayments increased, this would have the effect of shortening the life of our investments in MSR financing receivables and may reduce the cash and interest income related to such investments.
Interest Rate Effects on Fair Value
Another component of interest rate risk is the effect changes in interest rates will have on the fair value of the assets we acquire or originate. We face the risk that the fair value of our assets will increase or decrease at different rates than that of our liabilities, including our hedging instruments, if any. We primarily assess our interest rate risk by estimating the duration of our assets compared to the duration of our liabilities and hedges. Duration essentially measures the market price volatility of
93
financial instruments as interest rates change. We generally calculate duration using various financial models and empirical data. Different models and methodologies can produce different duration numbers for the same securities.
It is important to note that the impact of changing interest rates on fair value can change significantly when interest rates change beyond 100 basis points from current levels. Therefore, the volatility in the fair value of our assets could increase significantly when interest rates change beyond 100 basis points. In addition, other factors impact the fair value of our interest rate-sensitive investments and hedging instruments, such as the shape of the yield curve, market expectations as to future interest rate changes and other market conditions. Accordingly, in the event of changes in actual interest rates, the change in the fair value of our assets would likely differ from that shown below and such difference might be material and adverse to our stockholders.
Interest Rate Cap Risk
We may also invest in adjustable-rate residential mortgage loans and RMBS. These are mortgages or RMBS in which the underlying mortgages are typically subject to periodic and lifetime interest rate cap and floors, which limit the amount by which the security’s interest yield may change during any given period. However, our borrowing costs pursuant to our financing agreements will not be subject to similar restrictions. Therefore, in a period of increasing interest rates, interest rate costs on our borrowings could increase without limitation by caps, while the interest-rate yields on our adjustable-rate residential mortgage loans and RMBS would effectively be limited. This problem will be magnified to the extent we acquire adjustable-rate RMBS that are not based on mortgages which are fully indexed. In addition, the mortgages or the underlying mortgages in an RMBS may be subject to periodic payment caps that result in some portion of the interest being deferred and added to the principal outstanding. This could result in our receipt of less cash income on our adjustable-rate mortgages or RMBS than we need in order to pay the interest cost on our related borrowings. These factors could lower our net interest income or cause a net loss during periods of rising interest rates, which would harm our financial condition, cash flows and results of operations.
Interest Rate Mismatch Risk
We fund a substantial portion of the acquisitions of our investments with borrowings that have interest rates based on indices and re-pricing terms similar to, but of somewhat shorter maturities than, the interest rate indices and re-pricing terms of the mortgages and MBS we purchase. In most cases the interest rate indices and re-pricing terms of our mortgage assets and our funding sources will not be identical, thereby creating an interest rate mismatch between assets and liabilities. Our cost of funds would likely rise or fall more quickly than would our earnings rate on assets. During periods of changing interest rates, such interest rate mismatches could negatively impact our financial condition, cash flows and results of operations. To mitigate interest rate mismatches, we may utilize the hedging strategies discussed above. Our analysis of risks is based on our experience, estimates, models and assumptions. These analyses rely on models which utilize estimates of fair value and interest rate sensitivity. Actual economic conditions or implementation of investment decisions by our management may produce results that differ significantly from the estimates and assumptions used in our models and the projected results.
To mitigate potential interest rate mismatches, we have entered into agreements for longer term, non-MTM financing facilities at rates that are higher than short-term secured financing agreements. These longer term agreements are primarily on our less liquid Non-Agency RMBS assets. Having non-MTM financing facilities may be useful in this market to prevent significant margin calls or collateral liquidation in a volatile market. If the market normalizes and repurchase rates fall, we may be locked into long term and higher interest expenses than are otherwise available in the market to finance our portfolio.
Our profitability and the value of our investment portfolio, including derivatives may be adversely affected during any period as a result of changing interest rates. The following table quantifies the potential changes in net interest income and market value on the assets we retain and derivatives, if interest rates go up or down 50 and 100 basis points, assuming parallel movements in the yield curves. All changes in income and value are measured as percentage changes from the projected net interest income and the value of the assets we retain at the base interest rate scenario. The base interest rate scenario assumes interest rates at December 31, 2025 and various estimates regarding prepayment and all activities are made at each level of rate change. Actual results could differ significantly from these estimates.
94
December 31, 2025 (1) | ||||||||
| Change in Interest Rate | Projected Percentage Change in Net Interest Income (2) | Projected Percentage Change in Market Value (3) | ||||||
| -100 Basis Points | 8.13 | % | 3.20 | % | ||||
| -50 Basis Points | 4.98 | % | 1.73 | % | ||||
| Base Interest Rate | — | — | ||||||
| +50 Basis Points | (5.61) | % | (1.94) | % | ||||
| +100 Basis Points | (12.32) | % | (3.94) | % | ||||
(1) The retained securities are securities retained by us from securitization VIEs included in our portfolio and not the consolidated assets and liabilities of the VIEs. Our Consolidated Statements of Financial Condition include assets of consolidated VIEs that can only be used to settle obligations and liabilities of the VIEs for which creditors do not have recourse to us.
(2) Includes preferred stock dividend expense.
(3) Projected Percentage Change in Market Value is based on instantaneous moves in interest rates.
Prepayment & Extension Risk - Investment Portfolio
As we receive prepayments of principal on these investments, premiums and discounts on such investments will be amortized or accreted into interest income. In general, an increase in actual or expected prepayment rates will accelerate the amortization of purchase premiums, thereby reducing the interest income earned on the investments. Conversely, discounts on such investments are accelerated and accreted into interest income, increasing interest income when prepayments increase. Actual prepayment results may be materially different from the assumptions we use for our portfolio.
Management computes the projected weighted-average life of our investments based on assumptions regarding the rate at which borrowers will prepay the underlying mortgages. When fixed-rate or hybrid adjustable-rate residential mortgage loans or RMBS are acquired via borrowings, we carefully assess the potential impact of prepayment and extension risk. If prepayment rates decrease in a rising interest rate environment, the life of the fixed-rate portion of the related assets could extend beyond expectations. This extension risk may result in a mismatch between the duration of the borrowings and the fixed-rate portion of the related assets, which could impact our net interest spread. In such cases, the income earned on the fixed-rate assets may remain stable, while borrowing costs could rise, potentially negatively affecting our results from operations. Additionally, in extreme situations, we may be forced to sell assets to maintain adequate liquidity, which could result in losses.
Basis Risk - Investment Portfolio
We may seek to limit our interest rate risk by hedging portions of our portfolio through interest rate swaps or other types of hedging instruments. Basis risk relates to the risk of the spread between our hedged assets and hedges widening. Such a widening may cause a decline in the fair value of our assets that is greater than the increase in fair value of our hedges resulting in a net decline in book value.
Market Risk
Market Value Risk
Certain of our securities classified as available-for-sale are reflected at their estimated fair value with unrealized gains and losses excluded from earnings and reported in other comprehensive income. The estimated fair value of these securities fluctuates primarily due to changes in interest rates, prepayment speeds, market liquidity, credit quality, and other factors. Generally, in a rising interest rate environment, the estimated fair value of these securities would be expected to decrease; conversely, in a decreasing interest rate environment, the estimated fair value of these securities would be expected to increase. As market volatility increases or liquidity decreases, the fair value of our investments may be adversely impacted.
Real Estate Market Risk
We own assets secured by real property and may own real property directly. Residential property values are subject to volatility and may be affected adversely by a number of factors, including, but not limited to, national, regional and local economic conditions and unemployment (which may be adversely affected by industry slowdowns and other factors); local real estate conditions (such as housing supply and demand); changes or continued weakness in specific industry segments; construction quality, age and design; demographic factors; natural disasters and other acts of God; and retroactive changes to building or similar codes. In addition, decreases in property values reduce the value of the collateral and the potential proceeds available to a borrower to repay our loans, which could also cause us to incur losses.
95
Risk Management - Investment Portfolio
Subject to maintaining our REIT status, we seek to manage risk exposure to protect our portfolio of residential mortgage loans, RMBS, and other assets and related debt against the effects of major interest rate changes. We generally seek to manage risk by:
•monitoring and adjusting, if necessary, the reset index and interest rate related to our RMBS and our financings;
•attempting to structure our financing agreements to have a range of different maturities, terms, amortizations and interest rate adjustment periods, rights to post both cash and collateral for margin calls and provisions for non-MTM financing facilities;
•using derivatives, financial futures, swaps, options, caps, floors and forward sales to adjust the interest rate sensitivity of our investments and our borrowings;
•using securitization financing to receive the benefit of attractive financing terms for an extended period of time in contrast to short term financing and maturity dates of the investments not included in the securitization; and
•actively managing, through assets selection, on an aggregate basis, the interest rate indices, interest rate adjustment periods, and gross reset margins of our investments and the interest rate indices and adjustment periods of our financings.
Our efforts to manage our assets and liabilities are focused on the timing and magnitude of the re-pricing of assets and liabilities. We attempt to control risks associated with interest rate movements. Methods for evaluating interest rate risk include an analysis of our interest rate sensitivity “gap,” which is the difference between interest-earning assets and interest-bearing liabilities maturing or re-pricing within a given time period. A gap is considered positive when the amount of interest-rate sensitive assets exceeds the amount of interest-rate sensitive liabilities. A gap is considered negative when the amount of interest-rate sensitive liabilities exceeds interest-rate sensitive assets. During a period of rising interest rates, a negative gap would tend to adversely affect net interest income, while a positive gap would tend to result in an increase in net interest income. During a period of falling interest rates, a negative gap would tend to result in an increase in net interest income, while a positive gap would tend to affect net interest income adversely. Because different types of assets and liabilities with the same or similar maturities may react differently to changes in overall market rates or conditions, changes in interest rates may affect net interest income positively or negatively even if an institution were perfectly matched in each maturity category.
The following table sets forth the estimated maturity or re-pricing of our interest-earning assets and interest-bearing liabilities at December 31, 2025. The amounts of assets and liabilities shown within a particular period were determined in accordance with the contractual terms of the assets and liabilities, and securities are included in the period in which their interest rates are first scheduled to adjust and not in the period in which they mature and includes the effect of the interest rate swaps, if any. The interest rate sensitivity of our assets and liabilities in the table could vary substantially based on actual prepayments.
| December 31, 2025 | |||||||||||||||||
| (dollars in thousands) | |||||||||||||||||
| Within 3 Months | 3-12 Months | 1 Year to 3 Years | Greater than 3 Years | Total | |||||||||||||
| Rate sensitive assets | $ | 733,745 | $ | 5,792,936 | $ | 593,690 | $ | 6,988,456 | $ | 14,108,826 | |||||||
| Cash equivalents | 232,292 | — | — | — | 232,292 | ||||||||||||
| Total rate sensitive assets | $ | 966,037 | $ | 5,792,936 | $ | 593,690 | $ | 6,988,456 | $ | 14,341,118 | |||||||
| Rate sensitive liabilities | 5,548,529 | 3,687,776 | 523,453 | 2,243,324 | 12,003,082 | ||||||||||||
| Interest rate sensitivity gap | $ | (4,582,492) | $ | 2,105,160 | $ | 70,237 | $ | 4,745,132 | $ | 2,338,036 | |||||||
| Cumulative rate sensitivity gap | $ | (4,582,492) | $ | (2,477,332) | $ | (2,407,095) | $ | 2,338,037 | |||||||||
| Cumulative interest rate sensitivity gap as a percentage of total rate sensitive assets | (32) | % | (17) | % | (17) | % | 16 | % | |||||||||
Our analysis of risks is based on our management’s experience, estimates, models and assumptions. These analyses rely on models which utilize estimates of fair value and interest rate sensitivity. Actual economic conditions or implementation of investment decisions by our management may produce results that differ significantly from the estimates and assumptions used in our models and the projected results shown in the above tables. These analyses contain certain forward-looking statements
96
and are subject to the safe harbor statement set forth under the heading, “Special Note Regarding Forward-Looking Statements.”
Enterprise Risk Management
We employ a “Three Layers of Defense Approach” to Enterprise Risk Management designed to assess and manage our operational, strategic, and financial risks. The “First Layer of Defense” consists of assessing key risks indicators facing each respective business unit within the Company. Our risk management unit is a separate group that acts as the “Second Layer of Defense”. The risk management unit partners with various business units to enhance their understanding, monitoring, managing and escalating risks as appropriate. The financial reporting unit operates under the requirements of the Sarbanes Oxley. The “Third Layer of Defense” consists of many of our internal controls which are subject to an independent evaluation by our third-party internal auditors. As an independent third party, the mandate of the internal auditor is to objectively assess the adequacy and effectiveness of our internal control environment to improve risk management, control and governance processes. Periodic reporting from the risk management unit is provided to executive management and to the Audit Committee of the Board of Directors.
Cybersecurity Risk
Our cybersecurity risk management and strategy is incorporated into our Enterprise Risk Management process. Our Board of Directors, in coordination with the Audit Committee and the Risk Committee, oversees management of cybersecurity risk. Please refer to Item 1C, “Cybersecurity” in our Annual Report on Form 10-K for additional information about our cybersecurity risk management, strategy and governance.
Business Continuity Plans
Our Business Continuity Plans are prepared with the intent of providing guidelines to facilitate (i) employee safety and relocation; (ii) preparedness for carrying out activities and receiving communication; (iii) resumption and restoration of systems and business processes and (iv) the protection and integrity of the Company’s assets.
Our Business Continuity Plans are designed to facilitate business process resilience in a broad range of scenarios with dedicated disaster recovery teams which are comprised of executive management and professionals across our various business units. Our Business Continuity Plans identify the critical systems and processes necessary for business operations as well as the resources, employees, and planning needed to support these systems and processes. Our Business Continuity Plans provide guidelines to aid in the timely resumption of business operations and for communication with employees, service providers and other key stakeholders needed to support these operations. Our Business Continuity Plans are a “living process” that evolve with the input and guidance of the key stakeholders, subject matter experts and industry best practices and is reviewed and updated at least annually.
Item 8. Financial Statements and Supplementary Data
Our consolidated financial statements and the related notes, together with the Reports of Independent Registered Public Accounting Firm thereon, are set forth in Part IV of this 2025 Form 10-K.
Item 9. Changes in and Disagreements with Accountants on Accounting and Financial Disclosure
None.
Item 9A. Controls and Procedures
(a) Evaluation of Disclosure Controls and Procedures
As of the end of the period covered by this report, an evaluation of the effectiveness of the design and operation of the Company’s disclosure controls and procedures (as defined in Rule 13a-15(e) under the Exchange Act) was performed under the supervision and with the participation of the Company’s senior management, including the Chief Executive Officer and the Chief Financial Officer. Based on that evaluation, the Company’s management, including the Chief Executive Officer and the Chief Financial Officer, concluded that the Company’s disclosure controls and procedures were effective as of the end of the period covered by this report.
(b) Management’s Report on Internal Control Over Financial Reporting
97
Our management is responsible for establishing and maintaining adequate internal control over financial reporting. Internal control over financial reporting is defined in Rule 13a-15(f) and 15d-15(f) under the Exchange Act, as a process designed by, or under the supervision of, our principal executive and principal financial officers and effected by our Board of Directors, management and other personnel to provide reasonable assurance regarding the reliability of financial reporting and the preparation of financial statements for external purposes in accordance with accounting principles generally accepted in the United States and includes those policies and procedures that:
•pertain to the maintenance of records that in reasonable detail accurately and fairly reflect the transactions and dispositions of our assets;
•provide reasonable assurance that transactions are recorded as necessary to permit preparation of financial statements in accordance with accounting principles generally accepted in the United States, and that our receipts and expenditures are being made only in accordance with authorizations of our management and directors; and
•provide reasonable assurance regarding prevention or timely detection of unauthorized acquisition, use or disposition of our assets that could have a material effect on the financial statements.
Because of its inherent limitations, internal control over financial reporting may not prevent or detect all misstatements. Projections of any evaluation of effectiveness to future periods are subject to the risks that controls may become inadequate because of changes in conditions or that the degree of compliance with the policies or procedures may deteriorate. Management assessed the effectiveness of our internal control over financial reporting as of December 31, 2025. In making this assessment, management used the criteria set forth by the Committee of Sponsoring Organizations of the Treadway Commission in the 2013 Internal Control-Integrated Framework. Based on this assessment, management concluded that, as of December 31, 2025, our internal control over financial reporting was effective.
Ernst & Young LLP, our independent registered public accounting firm, has issued an attestation report on the effectiveness of our internal control over financial reporting as of December 31, 2025, included in their report under Item 8. “Financial Statements and Supplementary Data” of this Annual Report on Form 10-K.
The Company acquired HomeXpress during the fourth quarter of 2025, and management excluded from its assessment of the effectiveness of the Company’s internal control over financial reporting as of December 31, 2025, HomeXpress’ internal control over financial reporting associated with 10.9% and 3.7% of total net assets and net income, respectively, included in the consolidated financial statements of the Company as of December 31, 2025.
(c) Changes in Internal Control over Financial Reporting
As required by Rule 13a-15(d) under the Exchange Act, the Company’s management, including its Chief Executive Officer and the Chief Financial Officer, has evaluated the Company’s internal control over financial reporting to determine whether any changes occurred during the fourth quarter of 2024 that have materially affected, or are reasonably likely to materially affect, our internal control over financial reporting. Based on that evaluation, there has been no such changes, during the quarter ended December 31, 2025.
Item 9B. Other Information
Item 9C. Disclosure Regarding Foreign Jurisdictions that Prevent Inspections
Not applicable.
PART III
Item 10. Directors, Executive Officers and Corporate Governance
We expect to file with the SEC, in April 2026 (and, in any event, no later than 120 days after the close of our last fiscal year), a definitive proxy statement, or the Proxy Statement, pursuant to SEC Regulation 14A in connection with our Annual Meeting of Stockholders to be held on or about June 10, 2026. The information to be included in the Proxy Statement regarding our
98
directors, executive officers, and certain other matters required by Item 401 of Regulation S-K is incorporated herein by reference.
The information to be included in the Proxy Statement regarding compliance with Section 16(a) of the Exchange Act required by Item 405 of Regulation S-K is incorporated herein by reference.
The information to be included in the Proxy Statement regarding our Code of Business Conduct and Ethics required by Item 406 of Regulation S-K is incorporated herein by reference.
The information to be included in the Proxy Statement regarding certain matters pertaining to our corporate governance required by Item 407(c)(3), (d)(4) and (d)(5) of Regulation S-K is incorporated by reference.
Insider Trading Policies and Procedures
Item 11. Executive Compensation
The information to be included in the Proxy Statement regarding executive compensation and other compensation related matters required by Items 402 and 407(e)(4) and (e)(5) of Regulation S-K is incorporated herein by reference.
Item 12. Security Ownership of Certain Beneficial Owners and Management and Related Stockholder Matters
The tables to be included in the Proxy Statement, which will contain information relating to securities authorized for issuance under equity compensation plans and beneficial ownership of our capital stock required by Items 201(d) and 403 of Regulation S-K, are incorporated herein by reference.
Item 13. Certain Relationships and Related Transactions and Director Independence
The information to be included in the Proxy Statement regarding transactions with related persons, promoters and certain control persons and director independence required by Items 404 and 407(a) of Regulation S-K is incorporated herein by reference.
Item 14. Principal Accountant Fees and Services
The information to be included in the Proxy Statement concerning principal accounting fees and services and the Audit Committee’s pre-approval policies and procedures required by Item 9(e) of Schedule 14A is incorporated herein by reference.
Item 15. Exhibits
| EXHIBIT INDEX | |||||
| Exhibit Number | Description | ||||
| 2.1 | |||||
| 2.2 | |||||
| 3.1 | |||||
| 3.2 | |||||
99
| 3.3 | |||||
| 3.4 | |||||
| 3.5 | |||||
| 3.6 | |||||
| 3.7 | |||||
| 3.8 | |||||
| 3.9 | |||||
| 3.10 | |||||
| 3.11 | |||||
| 3.12 | |||||
| 3.13 | |||||
| 3.14 | |||||
| 4.1 | |||||
| 4.2 | |||||
| 4.3 | |||||
| 4.4 | |||||
| 4.5 | |||||
| 4.6 | |||||
| 4.7 | |||||
| 4.8 | |||||
100
| 4.9 | |||||
| 4.10 | |||||
| 4.11 | |||||
| 4.12 | |||||
| 4.13 | |||||
| 10.1† | Registration Rights Agreement, dated August 5, 2025, by and among Chimera Investment Corporation and the Holders as defined therein.(filed as Exhibit 10.2 to the Company's Report on Form 10-Q on August 6, 2025 and incorporated herein by reference). | ||||
| 10.2† | |||||
| 10.3† | |||||
| 10.4† | |||||
| 10.5† | |||||
| 10.6† | |||||
| 10.7† | |||||
| 10.8† | |||||
| 10.9† | |||||
| 10.10† | |||||
| 10.11† | |||||
| 10.12† | |||||
| 10.13† | |||||
| 10.14† | |||||
| 10.15† | |||||
| 19 | |||||
| 21.1 | |||||
| 23.1 | |||||
| 31.1 | |||||
| 31.2 | |||||
| 32.1 | |||||
101
| 32.2 | |||||
| 97† | |||||
| 101.INS | XBRL Instance Document - The instance document does not appear in the interactive data file because its XBRL tags are embedded within the inline XBRL document. | ||||
| 101.SCH | XBRL Taxonomy Extension Schema Document | ||||
| 101.CAL | XBRL Taxonomy Extension Calculation Linkbase Document | ||||
| 101.LAB | XBRL Taxonomy Extension Labels Linkbase Document | ||||
| 101.PRE | XBRL Taxonomy Extension Presentation Linkbase Document | ||||
| 101.DEF | XBRL Taxonomy Extension Definition Linkbase Document | ||||
| 104 | Cover Page Interactive Data File (formatted as Inline XBRL and contained in Exhibit 101) | ||||
† Represents a management contract or compensatory plan or arrangement
102
CHIMERA INVESTMENT CORPORATION
FINANCIAL STATEMENTS
Reports of Independent Registered Public Accounting Firm (PCAOB ID No. | 79 | ||||
| Consolidated Financial Statements | |||||
| Consolidated Statements of Financial Condition as of December 31, 2025 and 2024 | |||||
| Consolidated Statements of Operations for the years ended December 31, 2025, 2024 and 2023 | |||||
| Consolidated Statements of Comprehensive Income (Loss) for the years ended December 31, 2025, 2024 and 2023 | |||||
| Consolidated Statements of Changes in Stockholders' Equity for the years ended December 31, 2025, 2024 and 2023 | |||||
| Consolidated Statements of Cash Flows for the years ended December 31, 2025, 2024 and 2023 | |||||
| Notes to Consolidated Financial Statements | |||||
103
Report of Independent Registered Public Accounting Firm
To the Stockholders and the Board of Directors of Chimera Investment Corporation
Opinion on the Financial Statements
We have audited the accompanying consolidated statements of financial condition of Chimera Investment Corporation (the Company) as of December 31, 2025 and 2024, the related consolidated statements of operations, comprehensive income (loss), changes in stockholders' equity and cash flows for each of the three years in the period ended December 31, 2025, and the related notes (collectively referred to as the “consolidated financial statements”). In our opinion, the consolidated financial statements present fairly, in all material respects, the financial position of the Company at December 31, 2025 and 2024, and the results of its operations and its cash flows for each of the three years in the period ended December 31, 2025, in conformity with U.S. generally accepted accounting principles.
We also have audited, in accordance with the standards of the Public Company Accounting Oversight Board (United States) (PCAOB), the Company's internal control over financial reporting as of December 31, 2025, based on criteria established in Internal Control—Integrated Framework issued by the Committee of Sponsoring Organizations of the Treadway Commission (2013 framework), and our report dated February 18, 2026 expressed an unqualified opinion thereon.
Basis for Opinion
These financial statements are the responsibility of the Company's management. Our responsibility is to express an opinion on the Company’s financial statements based on our audits. We are a public accounting firm registered with the PCAOB and are required to be independent with respect to the Company in accordance with the U.S. federal securities laws and the applicable rules and regulations of the Securities and Exchange Commission and the PCAOB.
We conducted our audits in accordance with the standards of the PCAOB. Those standards require that we plan and perform the audit to obtain reasonable assurance about whether the financial statements are free of material misstatement, whether due to error or fraud. Our audits included performing procedures to assess the risks of material misstatement of the financial statements, whether due to error or fraud, and performing procedures that respond to those risks. Such procedures included examining, on a test basis, evidence regarding the amounts and disclosures in the financial statements. Our audits also included evaluating the accounting principles used and significant estimates made by management, as well as evaluating the overall presentation of the financial statements. We believe that our audits provide a reasonable basis for our opinion.
Critical Audit Matter
The critical audit matter communicated below is a matter arising from the current period audit of the financial statements that was communicated or required to be communicated to the audit committee and that: (1) relates to accounts or disclosures that are material to the financial statements and (2) involved our especially challenging, subjective or complex judgments. The communication of the critical audit matter does not alter in any way our opinion on the consolidated financial statements, taken as a whole, and we are not, by communicating the critical audit matter below, providing a separate opinion on the critical audit matter or on the accounts or disclosures to which it relates.
104
| Valuation of certain financial instruments using significant unobservable inputs | ||||||||
| Description of the Matter | As of December 31, 2025, the Company had recognized on its consolidated statement of financial condition the following financial instruments that are categorized as Level 3 in the fair value hierarchy (Level 3 financial instruments): $817 billion of Non-Agency RMBS, at fair value; $9.7 billion of Loans held for investment, at fair value; and $6.7 billion of Securitized debt at fair value, collateralized by Loans held for investment. Management determines the fair value of these Level 3 financial instruments by applying the methodologies described in Note 6 to the financial statements and using significant unobservable inputs. Determining the fair value of each Level 3 financial instrument requires management to make significant judgments about the valuation methodologies, including the unobservable inputs and other assumptions and estimates used in the measurements. Auditing the fair value of the Company's Level 3 financial instruments including Non-Agency RMBS, at fair value, Loans held for investment, at fair value, and Securitized debt at fair value, collateralized by Loans held for investment was complex due to the judgment and estimation uncertainty used by the Company in determining the fair value of the financial instruments. In particular, to value its Level 3 financial instruments, the Company used significant unobservable assumptions, such as discount rates, prepayment speeds, default rates, and loss severities which are significant to the valuation of these Level 3 financial instruments. | |||||||
| How We Addressed the Matter in Our Audit | We obtained an understanding, evaluated the design and tested the operating effectiveness of internal controls over the Company's financial instrument valuation process. This included controls over management's review of the appropriateness of the significant assumptions and data inputs and the validation of fair values developed by the Company through comparison to information from third party pricing services, as well as controls over management’s review and approval of the fair value estimates. Our audit procedures included, among others, evaluating the valuation methodologies used by the Company. With the assistance of our valuation specialists, we independently developed a range of fair value estimates for a sample of financial instruments based on market data and compared them to the Company's estimates. In addition, we evaluated information that corroborates or contradicts the Company's fair value estimates. We read the Company’s disclosures related to fair value estimates and assessed the accuracy of the fair value hierarchy as disclosed. | |||||||
/s/ Ernst & Young LLP
We have served as the Company’s auditor since 2012.
February 18, 2026
105
Report of Independent Registered Public Accounting Firm
To the Stockholders and the Board of Directors of Chimera Investment Corporation
Opinion on Internal Control Over Financial Reporting
We have audited Chimera Investment Corporation’s internal control over financial reporting as of December 31, 2025, based on criteria established in Internal Control—Integrated Framework issued by the Committee of Sponsoring Organizations of the Treadway Commission 2013 framework (the COSO criteria). In our opinion, Chimera Investment Corporation (the Company) maintained, in all material respects, effective internal control over financial reporting as of December 31, 2025, based on the COSO criteria.
As indicated in the accompanying Management’s Report on Internal Control Over Financial Reporting, management’s assessment of and conclusion on the effectiveness of internal control over financial reporting did not include the internal controls of HomeXpress Mortgage Corp., which is included in the 2025 consolidated financial statements of the Company and constituted 10.9% of total net assets as of December 31, 2025 and 3.7% of net income for the year then ended. Our audit of internal control over financial reporting of the Company also did not include an evaluation of the internal control over financial reporting of HomeXpress Mortgage Corp.
We also have audited, in accordance with the standards of the Public Company Accounting Oversight Board (United States) (PCAOB), the consolidated statements of financial condition of the Company as of December 31, 2025 and 2024, the related consolidated statements of operations, comprehensive income (loss), changes in stockholders’ equity and cash flows for each of the three years in the period ended December 31, 2025, and the related notes and our report dated February 18, 2026 expressed an unqualified opinion thereon.
Basis for Opinion
The Company’s management is responsible for maintaining effective internal control over financial reporting and for its assessment of the effectiveness of internal control over financial reporting included in the accompanying Management’s Report on Internal Control Over Financial Reporting. Our responsibility is to express an opinion on the Company’s internal control over financial reporting based on our audit. We are a public accounting firm registered with the PCAOB and are required to be independent with respect to the Company in accordance with the U.S. federal securities laws and the applicable rules and regulations of the Securities and Exchange Commission and the PCAOB.
We conducted our audit in accordance with the standards of the PCAOB. Those standards require that we plan and perform the audit to obtain reasonable assurance about whether effective internal control over financial reporting was maintained in all material respects.
Our audit included obtaining an understanding of internal control over financial reporting, assessing the risk that a material weakness exists, testing and evaluating the design and operating effectiveness of internal control based on the assessed risk, and performing such other procedures as we considered necessary in the circumstances. We believe that our audit provides a reasonable basis for our opinion.
Definition and Limitations of Internal Control Over Financial Reporting
A company’s internal control over financial reporting is a process designed to provide reasonable assurance regarding the reliability of financial reporting and the preparation of financial statements for external purposes in accordance with generally accepted accounting principles. A company’s internal control over financial reporting includes those policies and procedures that (1) pertain to the maintenance of records that, in reasonable detail, accurately and fairly reflect the transactions and dispositions of the assets of the company; (2) provide reasonable assurance that transactions are recorded as necessary to permit preparation of financial statements in accordance with generally accepted accounting principles, and that receipts and expenditures of the company are being made only in accordance with authorizations of management and directors of the company; and (3) provide reasonable assurance regarding prevention or timely detection of unauthorized acquisition, use, or disposition of the company’s assets that could have a material effect on the financial statements.
Because of its inherent limitations, internal control over financial reporting may not prevent or detect misstatements. Also, projections of any evaluation of effectiveness to future periods are subject to the risk that controls may become inadequate because of changes in conditions, or that the degree of compliance with the policies or procedures may deteriorate.
/s/ Ernst & Young LLP
New York, New York
February 18, 2026
106
| CHIMERA INVESTMENT CORPORATION | ||||||||
| CONSOLIDATED STATEMENTS OF FINANCIAL CONDITION | ||||||||
| (dollars in thousands, except share and per share data) | ||||||||
| December 31, 2025 | December 31, 2024 | |||||||
| Assets: | ||||||||
| Cash and cash equivalents | $ | $ | ||||||
Non-Agency RMBS, at fair value (net of allowance for credit losses of $ | ||||||||
| Agency MBS, at fair value | ||||||||
| Loans held for investment, at fair value | ||||||||
| Loans held-for-sale, at fair value | ||||||||
| Accrued interest receivable | ||||||||
| Other assets | ||||||||
| Interests in MSR financing receivables | ||||||||
| Derivatives, at fair value, net | ||||||||
Total assets (1) | $ | $ | ||||||
| Liabilities: | ||||||||
Secured financing agreements ($ | $ | $ | ||||||
Securitized debt, collateralized by Non-Agency RMBS ($ | ||||||||
Securitized debt at fair value, collateralized by Loans held for investment ($ | ||||||||
| Long term debt | ||||||||
| Payable for investments purchased | ||||||||
| Accrued interest payable | ||||||||
| Dividends payable | ||||||||
| Accounts payable and other liabilities | ||||||||
| Derivatives, at fair value, net | ||||||||
Total liabilities (1) | $ | $ | ||||||
| Commitments and Contingencies (See Note 18) | ||||||||
| Stockholders' Equity: | ||||||||
Preferred Stock, par value of $ | ||||||||
| $ | $ | |||||||
Common stock: par value $ | ||||||||
| Additional paid-in-capital | ||||||||
| Accumulated other comprehensive income | ||||||||
| Cumulative earnings | ||||||||
| Cumulative distributions to stockholders | ( | ( | ||||||
| Total stockholders' equity | $ | $ | ||||||
| Total liabilities and stockholders' equity | $ | $ | ||||||
(1) The Company's Consolidated Statements of Financial Condition include assets of consolidated variable interest entities, or V IEs, that can only be used to settle obligations and liabilities of the VIE for which creditors do not have recourse to the primary beneficiary (Chimera Investment Corporation). As of December 31, 2025, and December 31, 2024, total assets of consolidated VIEs were $9,215,343 and $9,970,094 , respectively, and total liabilities of consolidated VIEs were $6,533,891 and $6,766,505 , respectively. See Note 10 for further discussion.
See accompanying notes to the consolidated financial statements.
107
`
| CHIMERA INVESTMENT CORPORATION | |||||||||||
| CONSOLIDATED STATEMENTS OF OPERATIONS | |||||||||||
| (dollars in thousands, except share and per share data) | |||||||||||
| For the Years Ended | |||||||||||
| December 31, 2025 | December 31, 2024 | December 31, 2023 | |||||||||
| Net interest income: | |||||||||||
Interest income (1) | $ | $ | $ | ||||||||
Interest expense (2) | |||||||||||
| Net interest income | |||||||||||
| Increase in provision for credit losses | |||||||||||
| Other income (losses): | |||||||||||
| Net unrealized gains (losses) on derivatives | ( | ||||||||||
| Realized losses on derivatives | ( | ( | ( | ||||||||
| Periodic interest on derivatives, net | |||||||||||
| Net gains (losses) on derivatives | ( | ( | |||||||||
| Investment management and advisory fees | |||||||||||
Interest income from investment in MSR financing receivables, net (3) | |||||||||||
| Net unrealized gains on financial instruments at fair value | |||||||||||
| Net realized losses on sales of investments | ( | ( | ( | ||||||||
| Gains on extinguishment of debt | |||||||||||
| Other investment gains | |||||||||||
| Gain on origination and sale of loans, net | |||||||||||
| Total other income (losses) | ( | ||||||||||
| Other expenses: | |||||||||||
Compensation and benefits (4) | |||||||||||
| General and administrative expenses | |||||||||||
| Servicing and asset manager fees | |||||||||||
| Amortization of intangibles and depreciation expenses | |||||||||||
| Transaction expenses | |||||||||||
| Total other expenses | |||||||||||
| Income before income taxes | |||||||||||
| Income tax expense | |||||||||||
| Net income | $ | $ | $ | ||||||||
| Dividends on preferred stock | |||||||||||
| Net income available to common shareholders | $ | $ | $ | ||||||||
| Net income per share available to common shareholders: | |||||||||||
| Basic | $ | $ | $ | ||||||||
| Diluted | $ | $ | $ | ||||||||
| Weighted average number of common shares outstanding: | |||||||||||
| Basic | |||||||||||
| Diluted | |||||||||||
(1) Includes interest income of consolidated V IEs of $557,046 , $640,499 and $593,384 for the years ended December 31, 2025, 2024, and 2023 respectively. See Note 10 for further discussion.
(2) Includes interest expense of consolidated VIEs of $283,722 , $293,509 , and $282,542 for the years ended December 31, 2025, 2024, and 2023, respectively. See Note 10 for further discussion.
(3) Includes interest income from investment in MSR financing receivables of a consolidated VIE of $709 , $0 and $0 for the years ended December 31, 2025, 2024 and 2023, respectively. See Note 10 for further discussion.
(4) Includes a related-party, non-cash imputed compensation expense from the Palisades Acquisition of $1,364 , $10,296 , and $0 for the years ended December 31, 2025, 2024 and 2023, respectively.
See accompanying notes to the consolidated financial statements.
108
| CHIMERA INVESTMENT CORPORATION | |||||||||||
| CONSOLIDATED STATEMENTS OF COMPREHENSIVE INCOME (LOSS) | |||||||||||
| (dollars in thousands, except share and per share data) | |||||||||||
| For the Years Ended | |||||||||||
| December 31, 2025 | December 31, 2024 | December 31, 2023 | |||||||||
| Comprehensive income (loss): | |||||||||||
| Net income | $ | $ | $ | ||||||||
| Other comprehensive loss: | |||||||||||
| Unrealized losses on available-for-sale securities, net | ( | ( | ( | ||||||||
| Reclassification adjustment for net losses included in net income for other-than-temporary credit impairment losses | |||||||||||
| Other comprehensive loss | $ | ( | $ | ( | $ | ( | |||||
| Comprehensive income before preferred stock dividends | $ | $ | $ | ||||||||
| Dividends on preferred stock | $ | $ | $ | ||||||||
| Comprehensive income available to common stock shareholders | $ | $ | $ | ||||||||
See accompanying notes to the consolidated financial statements.
109
| CHIMERA INVESTMENT CORPORATION | ||||||||||||||||||||||||||||||||
| CONSOLIDATED STATEMENTS OF CHANGES IN STOCKHOLDERS' EQUITY | ||||||||||||||||||||||||||||||||
| (dollars in thousands, except per share data) | ||||||||||||||||||||||||||||||||
For the Year Ended December 31, 2025 | ||||||||||||||||||||||||||||||||
| Series A Preferred Stock Par Value | Series B Preferred Stock Par Value | Series C Preferred Stock Par Value | Series D Preferred Stock Par Value | Common Stock Par Value | Additional Paid-in Capital | Accumulated Other Comprehensive Income | Cumulative Earnings | Cumulative Distributions to Stockholders | Total | |||||||||||||||||||||||
| Balance, December 31, 2024 | $ | $ | $ | $ | $ | $ | $ | $ | $ | ( | $ | |||||||||||||||||||||
| Net income | — | — | — | — | — | — | — | — | ||||||||||||||||||||||||
| Other comprehensive income (loss) | — | — | — | — | — | — | ( | — | — | ( | ||||||||||||||||||||||
| Issuance of common stock | — | — | — | — | — | — | — | |||||||||||||||||||||||||
| Stock based compensation | — | — | — | — | — | — | — | |||||||||||||||||||||||||
| Non-cash contribution from related party | — | — | — | — | — | — | — | — | ||||||||||||||||||||||||
| Common dividends declared | — | — | — | — | — | — | — | — | ( | ( | ||||||||||||||||||||||
| Preferred dividends declared | — | — | — | — | — | — | — | — | ( | ( | ||||||||||||||||||||||
| Balance, December 31, 2025 | $ | $ | $ | $ | $ | $ | $ | $ | $ | ( | $ | |||||||||||||||||||||
For the Year Ended December 31, 2024 | ||||||||||||||||||||||||||||||||
| Series A Preferred Stock Par Value | Series B Preferred Stock Par Value | Series C Preferred Stock Par Value | Series D Preferred Stock Par Value | Common Stock Par Value | Additional Paid-in Capital | Accumulated Other Comprehensive Income | Cumulative Earnings | Cumulative Distributions to Stockholders | Total | |||||||||||||||||||||||
| Balance, December 31, 2023 | $ | $ | $ | $ | $ | $ | $ | $ | $ | ( | $ | |||||||||||||||||||||
| Net income | — | — | — | — | — | — | — | — | ||||||||||||||||||||||||
| Other comprehensive income (loss) | — | — | — | — | — | — | ( | — | — | ( | ||||||||||||||||||||||
| Stock based compensation | — | — | — | — | — | — | — | |||||||||||||||||||||||||
| Non-cash contribution from related party | — | — | — | — | — | — | — | — | ||||||||||||||||||||||||
| Common dividends declared | — | — | — | — | — | — | — | — | ( | ( | ||||||||||||||||||||||
| Preferred dividends declared | — | — | — | — | — | — | — | — | ( | ( | ||||||||||||||||||||||
| Balance, December 31, 2024 | $ | $ | $ | $ | $ | $ | $ | $ | $ | ( | $ | |||||||||||||||||||||
For the Year Ended December 31, 2023 | ||||||||||||||||||||||||||||||||
| Series A Preferred Stock Par Value | Series B Preferred Stock Par Value | Series C Preferred Stock Par Value | Series D Preferred Stock Par Value | Common Stock Par Value | Additional Paid-in Capital | Accumulated Other Comprehensive Income | Cumulative Earnings | Cumulative Distributions to Stockholders | Total | |||||||||||||||||||||||
| Balance, December 31, 2022 | $ | $ | $ | $ | $ | $ | $ | $ | $ | ( | $ | |||||||||||||||||||||
| Net income | — | — | — | — | — | — | — | — | ||||||||||||||||||||||||
| Other comprehensive income (loss) | — | — | — | — | — | — | ( | — | — | ( | ||||||||||||||||||||||
| Repurchase of common stock | — | — | — | — | ( | ( | — | — | — | ( | ||||||||||||||||||||||
| Issuance of common stock | — | — | — | — | — | — | — | |||||||||||||||||||||||||
| Stock based compensation | — | — | — | — | — | — | — | |||||||||||||||||||||||||
| Common dividends declared | — | — | — | — | — | — | — | — | ( | ( | ||||||||||||||||||||||
| Preferred dividends declared | — | — | — | — | — | — | — | — | ( | ( | ||||||||||||||||||||||
| Balance, December 31, 2023 | $ | $ | $ | $ | $ | $ | $ | $ | $ | ( | $ | |||||||||||||||||||||
See accompanying notes to the consolidated financial statements.
110
| CHIMERA INVESTMENT CORPORATION | |||||||||||
| CONSOLIDATED STATEMENTS OF CASH FLOWS | |||||||||||
| (dollars in thousands) | |||||||||||
| For the Years Ended | |||||||||||
| December 31, 2025 | December 31, 2024 | December 31, 2023 | |||||||||
| Cash Flows From Operating Activities: | |||||||||||
| Net income | $ | $ | $ | ||||||||
| Adjustments to reconcile net income to net cash provided by (used in) operating activities: | |||||||||||
| (Accretion) Amortization of investment discounts/premiums, net | ( | ||||||||||
| Accretion of deferred financing costs, debt issuance costs, and Securitized debt discounts/premiums, net | |||||||||||
| Net unrealized (gains) losses on derivatives | ( | ( | |||||||||
| Proceeds (payments) for derivative settlements | ( | ||||||||||
| Margin (paid) received on derivatives | ( | ( | |||||||||
| Net unrealized (gains) losses on financial instruments at fair value | ( | ( | ( | ||||||||
| Net realized losses (gains) on sales of investments | |||||||||||
| Other investment (gains) losses | ( | ( | ( | ||||||||
| Net increase in provision for credit losses | |||||||||||
| Amortization of intangibles and depreciation expenses | |||||||||||
| Gain on origination sale, net | |||||||||||
| (Gain) loss on extinguishment of debt | ( | ( | |||||||||
| Equity-based compensation expense | |||||||||||
| Non-cash imputed compensation related to business acquisition | |||||||||||
| Origination of mortgage loans held-for-sale | ( | ||||||||||
| Sales, settlements and proceeds from sale of loans held-for-sale | |||||||||||
| Fair Value adjustment on mortgage loans held-for-sale | ( | ||||||||||
| Changes in operating assets: | |||||||||||
| (Increase) decrease in accrued interest receivable, net | ( | ( | |||||||||
| Decrease (increase) in other assets | ( | ( | |||||||||
| Changes in operating liabilities: | |||||||||||
| (Decrease) increase in accounts payable and other liabilities | ( | ( | |||||||||
| Increase in accrued interest payable, net | ( | ||||||||||
| Net cash (used in) provided by operating activities | $ | ( | $ | $ | |||||||
| Cash Flows From Investing Activities: | |||||||||||
| Agency MBS portfolio: | |||||||||||
| Purchases | $ | ( | $ | ( | $ | ( | |||||
| Sales | |||||||||||
| Principal payments | |||||||||||
| Non-Agency RMBS portfolio: | |||||||||||
| Purchases | ( | ( | |||||||||
| Sales | |||||||||||
| Principal payments | |||||||||||
| Loans held for investment: | |||||||||||
| Purchases | ( | ( | ( | ||||||||
| Sales | |||||||||||
| Principal payments | |||||||||||
| Purchase of HomeXpress | ( | ||||||||||
| Purchase of Palisades | ( | ||||||||||
| MSR: | |||||||||||
| Payments on purchases of investment in MSR financing receivables | ( | ||||||||||
| Net cash (used in) provided by investing activities | $ | ( | $ | $ | |||||||
| Cash Flows From Financing Activities: | |||||||||||
111
| Proceeds from secured financing agreements | $ | $ | $ | ||||||||
| Payments on secured financing agreements | ( | ( | ( | ||||||||
| Payments on repurchase of common stock | ( | ||||||||||
| Proceeds on issuance of common stock | |||||||||||
| Proceeds from securitized debt borrowings, collateralized by Loans held for investment | |||||||||||
| Payments on securitized debt borrowings, collateralized by Loans held for investment | ( | ( | ( | ||||||||
| Payments on securitized debt borrowings, collateralized by Non-Agency RMBS | ( | ( | ( | ||||||||
| Net proceeds from issuance of unsecured debt | |||||||||||
| Common dividends paid | ( | ( | ( | ||||||||
| Preferred dividends paid | ( | ( | ( | ||||||||
| Net cash provided by (used in) financing activities | $ | $ | ( | $ | ( | ||||||
| Net increase (decrease) in cash, cash equivalents and restricted cash | ( | ( | |||||||||
| Cash, cash equivalents and restricted cash at beginning of period | |||||||||||
| Cash, cash equivalents and restricted cash at end of period | $ | $ | $ | ||||||||
| Supplemental disclosure of cash flow information: | |||||||||||
| Interest received | $ | $ | $ | ||||||||
| Interest paid | $ | $ | $ | ||||||||
| Income taxes paid | $ | $ | $ | ||||||||
| Change in fair value of contingent earn-out liability | $ | $ | $ | ||||||||
| Non-cash investing activities: | |||||||||||
| Payable for investments purchased | $ | $ | $ | ||||||||
| Net change in unrealized gain (loss) on available-for sale securities | $ | ( | $ | ( | $ | ( | |||||
| Non-Cash Consideration paid for HomeXpress | $ | $ | $ | ||||||||
| Non-cash financing activities: | |||||||||||
| Dividends declared, not yet paid | $ | $ | $ | ||||||||
See accompanying notes to the consolidated financial statements.
112
| CHIMERA INVESTMENT CORPORATION | ||||||||||||||
| NOTES TO CONSOLIDATED FINANCIAL STATEMENTS | ||||||||||||||
1. Organization
Chimera Investment Corporation, or the Company, was incorporated in Maryland on June 1, 2007 and started trading on the New York Stock Exchange (“NYSE”) in November 2007. The Company elected to be taxed as a real estate investment trust, or REIT, under the Internal Revenue Code of 1986, as amended, and regulations promulgated thereunder, or the Code.
The Company is an internally managed REIT whose principal business objective is to provide attractive risk-adjusted returns and distributable income through investment performance linked to mortgage credit fundamentals. Through its mortgage lending, investment management, and advisory services platforms, the Company operates as a fully integrated mortgage business that originates, manages, and invests in a diversified range of mortgage assets. The Company invests, directly or indirectly, generally on a levered basis across a spectrum of mortgage assets, including residential mortgage loans, Non-Agency RMBS, Agency RMBS, Agency CMBS, MSRs, business purpose and investor loans, including RTLs, and other real estate-related assets. Through its subsidiary, it also originates consumer Non-QM, investor business purpose, and other Non-Agency and Agency mortgage loan products.
The Company conducts its operations through various subsidiaries including subsidiaries it treats as taxable REIT subsidiaries, or TRSs. In general, a TRS may hold assets and engage in activities that the Company cannot hold or engage in directly and generally may engage in any real estate or non-real estate related business. The Company currently has thirteen wholly-owned direct subsidiaries: Chimera RMBS Whole Pool LLC and Chimera RMBS LLC formed in June 2009; CIM Trading Company LLC, or CIM Trading, formed in July 2010; Chimera Funding TRS LLC, or CIM Funding TRS, a TRS formed in October 2013; Chimera CMBS Whole Pool LLC and Chimera RMBS Securities LLC formed in March 2015; Chimera RR Holding LLC formed in April 2016; NYH Funding LLC, a TRS formed in May 2019; Kali 2020 Holdings LLC formed in May 2020; Varuna Capital Partners LLC formed in September 2020; Aarna Holdings LLC formed in November 2020; CIM Advisory Holding TRS LLC formed in October 2024; and CIM XSMSR LLC formed in July 2025.
On December 2, 2024, the Company acquired The Palisades Group, LLC (“TPG”), Palisades Advisory Services, LLC (“PAS”), Palisades Technology Holdings, LLC, and their respective subsidiaries (the “Palisades Acquisition”). As a result of the Palisades Acquisition, the Company began providing investment management and advisory services primarily through TPG and PAS (together with TPG, “Palisades”). TPG is registered with the SEC as an investment adviser under the Investment Advisers Act of 1940 (the “Advisers Act”), and PAS is a relying adviser with respect to TPG’s investment adviser registration. PAS is the asset manager for certain securitizations sponsored by the Company and received $127 thousand in asset manager fees for the year ended December 31, 2025.
On July 31, 2025, the Company entered into purchase agreements to acquire base and excess servicing compensation rights, also known as MSRs, associated with a $6.5 billion portfolio of mortgage loans from a licensed, GSE-approved residential mortgage loan servicer, which enables the Company to garner the economic return of an investment in an MSR purchased by the mortgage servicing counterparty through an MSR financing transaction. CIM Funding TRS, through a direct and wholly owned subsidiary, entered into a Reference Spread Agreement for Agency Loans (“RESPA”) to purchase the base servicing fee on the mortgage servicing loans at a rate of 12.5 basis points less the cost of servicing and other ancillary fees and income. A consolidated VIE of the Company entered into a True Excess Spread Agreement for FNMA Loans (“TESPA”) to purchase the servicing spread in excess of the 12.5 basis point base servicing fee. The Company's investment in MSRs, net of any related financing obtained by the mortgage loan servicer, was $38 million.
On October 1, 2025, the Company acquired HomeXpress Mortgage Corp. (“HomeXpress”). HomeXpress is a leading originator of consumer Non-QM, investor business purpose, and other non-Agency mortgage loan products, as well as an originator of Agency mortgage loans with a nationwide presence across 46 states and D.C. Upon the terms and subject to the conditions of the Stock Purchase Agreement, at the closing of the transactions contemplated by the Stock Purchase Agreement (the “Closing”), CIM Funding TRS acquired (i) all of the outstanding equity interests in HX Holdco Corp., a Delaware corporation and parent of HomeXpress (“HX Holdco”), from the Holdco Sellers (as defined in the Stock Purchase Agreement), and (ii) the remaining outstanding equity interests in HomeXpress held by the Management Sellers (as defined in the Stock Purchase Agreement). Immediately following the Closing, CIM Funding TRS assigned the equity interests in HomeXpress acquired from the Management Sellers to HX Holdco so that HomeXpress became a wholly-owned subsidiary of HX Holdco. On October 1, 2025, the Company completed the acquisition of HomeXpress (the “HomeXpress Acquisition”) for total consideration of $272 million, which consisted of (i) cash of $124 million, representing the Adjusted Book Value of HomeXpress as of September 30, 2025, (ii) cash premium of $120 million, and (iii) issuance of 2,077,151 shares of the Company's common stock.
113
On May 18, 2022, the Company made a $75 million capital commitment to a fund managed by Kah Capital Management, LLC. During the year ended December 31, 2025, the Company funded $637 57 million, leaving an unfunded commitment of $18 million. The Company's investment in this fund is accounted for as an equity method investment in Other assets on the Consolidated Statements of Financial Condition. The Company records any gains and losses associated with its equity method investments in Other investment gains (losses) on the Consolidated Statements of Operations. Kah Capital Management ceased to provide asset servicing oversight as of the end of the first quarter of 2025. The Company paid $118 thousand for mortgage asset servicing oversight fees to Kah Capital Management during the year ended December 31, 2025. The Company paid $520 thousand for mortgage asset servicing oversight fees to Kah Capital Management during the year ended December 31, 2024. These fees are reported within Other expenses on the Consolidated Statements of Operations.
2. Summary of the Significant Accounting Policies
(a) Basis of Presentation and Consolidation
The accompanying consolidated financial statements and related notes of the Company have been prepared in accordance with accounting principles generally accepted in the United States, or GAAP. In the opinion of the Company, all normal and recurring adjustments considered necessary for a fair presentation of its financial position, results of operations and cash flows have been included. Investment transactions are recorded on the trade date. All per share amounts, common shares outstanding and restricted shares for periods 2023 and 2024 presented, reflect the Company's 1-for-3 reverse stock split, which was effective after the close of trading on May 21, 2024.
The consolidated financial statements include the Company’s accounts, the accounts of its wholly-owned subsidiaries, and variable interest entities, or VIEs, in which the Company is the primary beneficiary. All intercompany balances and transactions have been eliminated in consolidation.
The Company uses securitization trusts considered to be VIEs in its securitization transactions. Additionally, the Company owns variable interests in entities that invest in Interests in MSR financing receivables. VIEs are defined as entities in which equity investors (i) do not have the characteristics of a controlling financial interest, or (ii) do not have sufficient equity at risk for the entity to finance its activities without additional subordinated financial support from other parties. The entity that consolidates a VIE is known as its primary beneficiary and is generally the entity with (i) the power to direct the activities that most significantly impact the VIEs’ economic performance, and (ii) the right to receive benefits from the VIE or the obligation to absorb losses of the VIE that could be significant to the VIE. For VIEs that do not have substantial on-going activities, the power to direct the activities that most significantly impact the VIEs’ economic performance may be determined by an entity’s involvement with the design and structure of the VIE.
The trusts are structured as entities that receive principal and interest on the underlying collateral and distribute those payments to the security holders. The assets held by the securitization entities are restricted in that they can only be used to fulfill the obligations of the securitization entity. The Company’s risks associated with its involvement with these VIEs are limited to its risks and rights as a holder of the security it has retained as well as certain risks associated with being the sponsor and depositor of and the seller, directly or indirectly to, the securitizations entities.
Determining the primary beneficiary of a VIE requires judgment. The Company determined that for the securitizations it consolidates, its ownership provides the Company with the obligation to absorb losses or the right to receive benefits from the VIE that could be significant to the VIE. In addition, the Company has the power to direct the activities of the VIEs that most significantly impact the VIEs’ economic performance, or power, such as rights to replace the servicer without cause, or the Company was determined to have power in connection with its involvement with the structure and design of the VIE.
The Company’s interest in the assets held by these securitization vehicles, which are consolidated on the Company’s Consolidated Statements of Financial Condition, is restricted by the structural provisions of these trusts, and a recovery of the Company’s investment in the vehicles will be limited by each entity’s distribution provisions. Generally, the securities retained by the Company are the most subordinate in the capital structure, which means those securities receive distributions after the senior securities have been paid. The liabilities of the securitization vehicles, which are also consolidated on the Company’s Consolidated Statements of Financial Condition, are non-recourse to the Company, and can only be satisfied using proceeds from each securitization vehicle’s respective asset pool.
(b) Statements of Financial Condition Presentation
114
(c) Cash and Cash Equivalents
Cash and cash equivalents include cash on hand and cash deposited overnight in money market funds, which are not bank deposits and are not insured or guaranteed by the Federal Deposit Insurance Corporation, and short-term highly liquid investments that are readily convertible to known amounts of cash and have original maturities generally of three months or less.
Cash consists of cash balances that have no restrictions as to the Company’s ability to withdraw funds. Cash balances that have restrictions as to the Company’s ability to withdraw funds are considered restricted cash. The restricted cash balances of $6 million as of December 31, 2025, disclosed in Other assets on our Consolidated Statement of Financial Condition, are due to the terms of the Company’s warehouse lines of credit and escrow funds to be returned from recent loan originations to individual borrowers.
Reconciliation of cash, cash equivalents and restricted cash: The following table provides a reconciliation of cash, cash equivalents and restricted cash reported on the statement of financial condition that sum to the total of the same such amounts shown in the statement of cash flows.
| For the Year Ended | |||||
| December 31, 2025 | |||||
| (dollars in thousands) | |||||
| Cash and cash equivalents | $ | ||||
| Restricted cash | |||||
| Total cash, cash equivalents and restricted cash shown in the statement of cash flow | $ | ||||
(d) Agency and Non-Agency Mortgage-Backed Securities
The Company invests in mortgage-backed securities, or MBS, representing interests in obligations backed by pools of mortgage loans. The Company’s investments in MBS includes investments in both Agency MBS and Non-Agency MBS. The Company delineates between Agency MBS and Non-Agency MBS as follows: (1) Agency MBS are mortgage pass-through certificates, collateralized mortgage obligations, or CMOs, and other MBS representing interests in or obligations backed by pools of mortgage loans issued or guaranteed by agencies of the U.S. Government, such as Ginnie Mae, or federally chartered corporations such as Freddie Mac or Fannie Mae where principal and interest repayments are guaranteed by the respective agency of the U.S. Government or federally chartered corporation; and (2) Non-Agency MBS are not issued or guaranteed by a U.S. Government Agency or other institution and are subject to credit risk. Repayment of principal and interest on Non-Agency MBS is not guaranteed and it is subject to the performance of the mortgage loans or MBS collateralizing the obligation. Agency MBS collectively refers to include Agency CMBS and Agency RMBS.
The Company also invests in Interest Only Agency MBS strips and Interest Only Non-Agency RMBS strips, or IO MBS strips. IO MBS strips represent the Company’s right to receive a specified proportion of the contractual interest flows of the collateral.
The Company classifies its MBS as available-for-sale (AFS) or in accordance with the fair-value option (FVO). MBS classified as AFS are recorded on the Consolidated Statements of Financial Condition at fair value with changes in fair value recorded in Other comprehensive income (OCI). MBS classified as FVO are recorded on the Consolidated Statements of Financial Condition at fair value with changes in fair value recorded in earnings. See Note 6 of these consolidated financial statements for further discussion of MBS classified as FVO and how the Company determines fair value. From time to time, as part of the overall management of its portfolio, the Company may sell any of its investments and recognize a realized gain or loss as a component of earnings in the Consolidated Statements of Operations utilizing the average cost method.
The Company’s accounting policy for interest income and an allowance for credit losses related to its MBS is as follows:
115
Interest Income Recognition and Allowance for Credit Losses
Investments in Non-agency RMBS securities
The Company considers its investments in Non-Agency RMBS as beneficial interests. Beneficial interests give the Company the right to receive all or portions of specified cash flows received by a trust or other entity. Beneficial interests held by the Company are created in connection with securitization transactions such as those involving mortgage loan obligations. Beneficial interests are accounted for in accordance with guidance Financial Accounting Standards Board (FASB) Accounting Standards Codification, 325-40, Beneficial Interests in Securitized Financial Assets, (ASC 325-40) as amended by the accounting standards update No. 2016-13, Measurement of Credit Losses on Financial Instruments (ASU 2016-13).
Interest income on the Company’s beneficial interests is recognized using the interest method based on the Company's estimates of cash flows expected to be collected. The effective interest rate on these securities is based on the Company's estimate for each security of the projected cash flows, which are estimated based on observation of current market information and include assumptions related to fluctuations in prepayment speeds and the timing and amount of credit losses. On a quarterly basis, the Company reviews and, if appropriate, adjusts its cash flow projections based on inputs and analyses received from external sources, internal models, and the Company’s judgments about prepayment rates, the timing and amount of credit losses, and other factors. Changes in the amount or timing of cash flows from those originally projected, or from those estimated at the last evaluation date, are considered to be either favorable changes or adverse changes.
Adverse changes in the timing or amount of cash flows on beneficial interests classified as AFS could result in the Company recording an increase in the allowance for credit losses. The allowance for credit losses is calculated using a discounted cash flow (DCF) approach and is measured as the difference between the beneficial interest’s amortized cost and the estimate of cash flows expected to be collected discounted at the effective interest rate used to accrete the beneficial interest. The allowance for credit losses is recorded as a contra-asset and a reduction in earnings. The allowance for credit losses will be limited to the amount of the unrealized losses on the beneficial interest. Any allowance for credit losses in excess of the unrealized losses on the beneficial interests are accounted for as a prospective reduction of the effective interest rate. No allowance is recorded for beneficial interests in an unrealized gain position. Favorable changes in the DCF will result in a reduction in the allowance for credit losses, if any. Any reduction in allowance for credit losses is recorded in earnings. If there is no allowance for credit losses, or if the allowance for credit losses has been reduced to zero, the remaining favorable changes are reflected as a prospective increase to the effective interest rate.
Beneficial interests for which other than temporary impairment (OTTI) had been recognized prior to the effective date of ASU 2016-13 shall apply the guidance in the update on a prospective basis. In addition, the yield used to accrete the beneficial interest on beneficial interests with prior OTTI will remain unchanged as a result of the adoption of ASU 2016-13. Recoveries of amounts previously written off relating to improvements in cash flows shall be recorded in income in the period received. Therefore, subsequent favorable changes in the DCF of the beneficial interests with prior OTTI will not be reflected as an adjustment to their yield used to accrete the discount. Subsequent adverse changes in the DCF will result in an increase to the allowance for credit losses, limited to the amount of the unrealized losses on the beneficial interest.
Credit losses recognized on beneficial interests will be accreted on a monthly basis at the rate used to recognize interest income, the effective interest rate. The accretion will be recorded as a reduction to interest income in the statement of operations.
The Company presents separately all accrued interest on the statement of financial position. Interest is accrued on all beneficial interests when due. Interest which is not received at the due date is written off when it becomes delinquent. As all interest not received when due is charged off against interest income, no allowance for accrued interest is required.
No allowances for credit losses are recognized on beneficial interests for which the Company has elected the fair value option. All favorable or adverse changes in the Company's estimates of cash flows expected to be collected results in a prospective increase or decrease in the effective interest rate used to recognize interest income.
Investments in Agency Securities
The Company invests in pass-through mortgage-backed securities guaranteed by Ginnie Mae (GNMA), Fannie Mae (FNMA)
and Freddie Mac (FHLMC) (collectively “Agency Securities”).
Interest income for Agency Securities for which changes in fair value are recorded in OCI, including premiums and discounts associated with the acquisition of these securities, is recognized over the life of such securities using the interest method based on the cash flows of the security. In applying the interest method, the Company considers estimates of future principal prepayments in the calculation of the effective yield. Differences that arise between previously anticipated prepayments and actual prepayments received, as well as changes in future prepayment assumptions, result in a recalculation of the effective
116
yield on the security. This recalculation of the effective yield is updated on a monthly basis. Upon a recalculation of the effective yield, the investment in the security is adjusted to the amount that would have existed had the new effective yield been retrospectively applied since acquisition with a corresponding charge or credit to interest income. This adjustment is accounted for as a change in estimate with a cumulative effect adjustment on interest income as a result in the change in the yield. Prepayments are estimated using models generally accepted in the industry. Agency CMOs are generally purchased at par and do not involve significant premiums or discounts. As a result, the floating rate coupon of the Agency CMO is used as the effective yield for revenue recognition purposes.
All securities carried at fair value with changes in fair value recorded in OCI need to be evaluated for expected losses, even if the risk of loss is considered remote. However, the Company is not required to measure expected credit losses on securities in which historical credit loss information adjusted for current conditions and reasonable and supportable forecasts results in an expectation that incurring a credit loss is zero. Based on the current facts and circumstances, the Company believes its investments in Agency Securities would qualify for zero expected credit losses. The factors considered in reaching this conclusion include the long history of zero credit losses, the explicit guarantee by the US government (although limited for FNMA and FHLMC securities) and yields that, while not risk-free, generally trade based on market views of prepayment and liquidity risk (not credit risk).
Interest income on Agency Securities for which changes in fair value are recorded in earnings is recognized using the interest method based on the Company's estimates of cash flows expected to be collected. The effective interest rate on these securities is based on the Company's estimate of the projected cash flows. Changes in the amount or timing of cash flows as a result of changes in expected prepayments from those originally projected, or from those estimated at the last evaluation date, are reflected prospectively as an adjustment to the effective interest rate used to recognize interest income. This recalculation of the effective interest rate is updated on a monthly basis.
(e) Loans Held for Investment
The Company's Loans held for investments is primarily comprised of seasoned residential mortgage loans that are not guaranteed as to repayment of principal or interest. These loans are serviced and may be modified by a third-party servicer. Additionally, in certain cases, the Company has the ability to remove the servicer with or without cause upon prior notice. These residential mortgage loans are designated as held for investment and are carried at fair value with changes in fair value recorded in earnings. Interest income on loans held for investment is recognized over the expected life of the loans using the interest method with changes in yield reflected in earnings on a prospective basis.
The Company estimates the fair value of securitized loans as described in Note 6 of these consolidated financial statements.
Interest is accrued on all loans held for investment when due. Interest which is not received at the due date is written off when it becomes delinquent. Nonrefundable fees and costs related to acquiring the Company’s residential mortgage loans are recognized as expenses in the Consolidated Statements of Operations. Income recognition is suspended for loans when, based on information from the servicer, a full recovery of interest or principal becomes doubtful.
(f) Real estate owned
(g) Loans Held for Sale
Loans held for sale (“LHFS”) consist of mortgage loans originated or acquired by the Company with the intent to sell into the secondary market. LHFS are measured and reported at fair value.
Revenue derived from the Company’s mortgage lending activities includes certain fees collected at the time of origination and gain or loss from the sale of LHFS. Loan origination income reflects the fees earned, net of lender credits from originating the
117
loans. These consist of fees related to loan origination, discount points, underwriting, processing and other fees. Lender credits typically are related to rebates or concessions for certain loan origination costs.
Gain or loss from the sale and mark-to-market of LHFS includes both realized and unrealized gains and losses and are included in Gain on origination and sale of loans, net, in the accompanying Consolidated Statements of Operations. The valuation of LHFS approximates a whole-loan sales value, which includes the value of the related mortgage servicing rights. When LHFS are sold, servicing rights are released. The Company principally sells its LHFS to private investors. The Company evaluates its loan sales for sales treatment. To the extent the transfer of loans qualifies as a sale, the Company derecognizes the loans and records the gain or loss on the sale date. In the event the Company determines that the transfer of loans does not qualify as a sale, the transfer would be treated as a secured borrowing.
Interest income on LHFS is recognized as earned based on the contractual interest rates of the underlying mortgage loans and is recorded in interest income within the Consolidated Statements of Operations on the accrual basis. Interest income is accrued from the date of loan origination through the date the loan is sold to an investor.
The Company receives interest payments from borrowers while loans are held for sale. Although the Company does not retain servicing rights upon sale of the loans, it performs interim servicing activities for a short period from loan origination until loan sale. Interest income recognized during this interim period represents compensation for the use of the loan principal outstanding
Interest accruals cease upon sale of the loans, and any interest due to the Company is settled through the loan sale proceeds.
LHFS are placed on non-accrual status when any portion of the principal or interest is 90 days past due or earlier if factors indicate that the ultimate collectability of the principal or interest is not probable. Interest received from loans on non-accrual status is recorded as income when collected. Loans return to accrual status when the principal and interest become current, and it is probable that the amounts are fully collectible.
(h) Secured Financing Agreements
Secured financing agreements include short-term repurchase agreements with original maturity dates of less than one year, long-term financing agreements with original maturity dates of more than one year, loan warehouse credit facilities collateralized by loans acquired by the Company that are classified as repurchase agreements, and loan warehouse credit facilities used to fund, and secured by, the residential mortgage loans originated by the Company which are classified as loans held-for-sale. The Company accounts for repurchase agreements and other similar collateralized financing arrangements as secured borrowings. Under its repurchase agreements and other forms of collateralized financing, the Company pledges financial assets as collateral to secure the related borrowings, generally in an amount equal to a specified percentage of the fair value of the pledged assets. The Company retains beneficial ownership of the pledged assets, including the right to receive principal and interest cash flows, subject to the terms of the respective agreements.
The Company has elected the fair value option on certain of its repurchase agreements. These agreements are reported at their fair value, with changes in fair value being recorded in earnings each period, fees paid at inception related to repurchase agreements at fair value are expensed as incurred. Interest expense is recorded based on the current interest rate in effect for the related agreement. Refer to Note 7 Secured Financing Agreements for further details.
(i) Securitized Debt, collateralized by Non-Agency RMBS and Securitized Debt, collateralized by Loans held for investment
Certain re-securitization transactions classified as securitized debt, collateralized by Non-Agency RMBS, reflect the transfer to a trust of fixed or adjustable rate MBS which are classified as Non-Agency RMBS that pay interest and principal to the debt holders of that re-securitization. Re-securitization transactions completed by the Company that did not qualify as sales are accounted for as secured borrowings. The associated securitized debt is carried at amortized cost, net of any unamortized premiums or discounts.
Certain transactions involving residential mortgage loans are accounted for as secured borrowings and are recorded as Securitized loans held for investment and the corresponding debt as Securitized debt, collateralized by loans held for investment in the Consolidated Statements of Financial Condition. These securitizations are collateralized by residential adjustable or fixed rate mortgage loans that have been placed in a trust and pay interest and principal to the debt holders of that securitization. The securitized debt, collateralized by loans held for investment, is carried at fair value.
The Company recognizes interest expense on securitized debt over the contractual life of the debt using the interest method with changes in yield reflected in earnings on a retrospective basis. For securitized debt, where the Company has elected fair value option, the interest expense is recognized using the interest method with changes in yield reflected in earnings on a prospective
118
basis. The Company recognizes a gain or loss on extinguishment of debt when it acquires its outstanding debt at discount or premium.
The Company estimates the fair value of its securitized debt as described in Note 6 to these consolidated financial statements.
(j) Fair Value
The Company carries the majority of its financial instruments at fair value. The Company has elected fair value option on certain Non-Agency RMBS, Agency MBS, Loans held for investment, Loans held for sale, certain secured financing agreements and securitized debt, collateralized by loans held for investment. The Company believes the fair value option election will provide its financial statements user with reduced complexity, greater consistency, understandability and comparability.
Agency MBS:
The Company has elected to account for Agency MBS investments acquired on or after July 1, 2017 under the fair value option. Under the fair value option, these investments will be carried at fair value, with changes in fair value reported in earnings (included as part of “Net unrealized gains on financial instruments at fair value”). Consistent with all other investments for which the Company has elected the fair value option, the Company will recognize revenue on a prospective basis in accordance with guidance in ASC 325-40.
All Agency MBS investments acquired prior to July 1, 2017 are carried at fair value with changes in fair value reported in other comprehensive income (OCI) as available-for-sale investments. All revenue recognition for these Agency MBS investments owned prior to July 1, 2017 will be in accordance with ASC 310-20, per the Company’s accounting practices.
Non-Agency RMBS:
The Company has elected to account for all Non-Agency RMBS investments acquired on or after January 1, 2019 under the fair value option. Under the fair value option, these investments will be carried at fair value, with changes in fair value reported in earnings (included as part of “Net unrealized gains (losses) on financial instruments at fair value”). Consistent with all other investments for which the Company has elected the fair value option, the Company will recognize revenue on a prospective basis in accordance with guidance in ASC 325-40.
The Company has elected the fair value option for certain interests in Non-Agency RMBS which it refers to as the overcollateralization classes. The cash flows for these holdings are generally subordinate to all other interests of the trusts and generally only pay out funds when certain ratios are met and excess cash holdings, as determined by the trustee, are available for distribution to the overcollateralization class. Many of the investments in this group have no current cash flows and may not ever pay cash flows, depending on the loss experience of the collateral group supporting the investment. Estimating future cash flows for this group of Non-Agency RMBS investments is highly subjective and uncertain; therefore, the Company records these holdings at fair value with changes in fair value reflected in earnings. Changes in fair value of the overcollateralization classes are presented in Net unrealized gains (losses) on financial instruments at fair value on the Consolidated Statements of Operations.
Interest-Only MBS:
The Company accounts for the IO MBS strips at fair value with changes in fair value reported in earnings. The IO MBS strips are included in MBS, at fair value, on the accompanying Consolidated Statements of Financial Condition.
Loans Held for Investment:
The Company’s Loans held for investment are carried at fair value with changes in fair value reflected in earnings. The Company carries Loans held for investment at fair value as it may resecuritize these loans in the future. Additionally, the fair value option allows both the loans and related financing to be consistently reported at fair value and to achieve operational and valuation simplifications.
Changes in fair value of Loans held for investment are presented in Net unrealized gains (losses) on financial instruments at fair value on the Consolidated Statements of Operations.
119
Loans Held for Sale:
LHFS are measured and reported at fair value with changes in fair value reflected in earnings. The Company’s fair value election for its LHFS is intended to more accurately reflect the underlying economics of the Company’s operations. With the election of the fair value option for LHFS, loan origination fees, and the related direct loan origination costs associated with the origination of LHFS, are earned and expensed as incurred, respectively.
Changes in fair value of Loans held for sale are presented in Gain on origination and sale of loans, net, on the Consolidated Statements of Operations.
Secured Financing Agreements:
Certain of the Company's repurchase agreements are carried at fair value with changes in fair value reflected in earnings. These secured financing agreements were entered into to finance certain Loans held for investments which are carried at fair value with changes in fair value reflected in earnings (or OCI, to the extent the change results from a change in instrument specific credit risk). The fair value option allows both the loans and secured financing to be consistently reported at fair value and to achieve operational and valuation simplifications.
The carrying amount of warehouse lines of credit utilized for LHFS approximates fair value due to the short-term nature of the liabilities.
Securitized Debt, Collateralized by Loans Held for Investment:
The Company’s securitized debt, collateralized by loans held for investment, is carried at fair value with changes in fair value reflected in earnings. The Company has elected the fair value option for these financings as it may call or restructure these debt financings in the future. Additionally, the fair value option allows both the loans and related financing to be consistently reported at fair value and to achieve operational and valuation simplifications. Changes in fair value of securitized debt, collateralized by loans held for investment are presented in Net unrealized gains (losses) on financial instruments at fair value on the Consolidated Statements of Operations.
Fair Value Disclosure
A complete discussion of the methodology utilized by the Company to estimate the fair value of its financial instruments is included in Note 6 to these consolidated financial statements.
(k) Derivative Financial Instruments
The Company’s investment policies permit it to enter into derivative contracts, including interest rate swaps, swaptions, mortgage options, futures, and interest rate caps to manage its interest rate risk and, from time to time, enhance investment returns. The Company’s derivatives are recorded as either assets or liabilities in the Consolidated Statements of Financial Condition and measured at fair value. These derivative financial instrument contracts are not designated as hedges for GAAP; therefore, all changes in fair value are recognized in earnings. The Company estimates the fair value of its derivative instruments as described in Note 6 of these consolidated financial statements. Net payments on derivative instruments are included in the Consolidated Statements of Cash Flows as a component of net income. Unrealized gains (losses) on derivatives are removed from net income to arrive at cash flows from operating activities.
The Company elects to net the fair value of its derivative contracts by counterparty when appropriate. These contracts contain legally enforceable provisions that allow for netting or setting off of all individual derivative receivables and payables with each counterparty and therefore, the fair values of those derivative contracts are reported net by counterparty. The credit support annex provisions of the Company’s derivative contracts allow the parties to mitigate their credit risk by requiring the party which is in a net payable position to post collateral. As the Company elects to net by counterparty the fair value of derivative contracts, it also nets by counterparty any cash collateral exchanged as part of the derivative. Refer to Note 12 Derivative Instruments for further details.
(l) Interest Rate Lock Commitments
The Company enters into interest rate lock commitments (“IRLCs”) with prospective borrowers to originate mortgage loans at a specified interest rate. These IRLCs are accounted for as derivative instruments. The fair values of IRLCs utilize current secondary market prices for the underlying loans and estimated servicing value with similar coupons, maturity and credit quality, estimated remaining direct expense and market adjusted investor discounts, subject to the anticipated loan funding probability (“Pull-through Rate”). The fair value of IRLCs is subject to change primarily due to changes in interest rates, credit
120
spreads and the estimated Pull-through Rate. The Company reports IRLCs within Derivatives, at fair value, net, in the accompanying Consolidated Statements of Financial Condition with changes in fair value being recorded in the accompanying Consolidated Statements of Operations within Gain on origination and sale of loans, net.
The Company hedges the changes in fair value associated with changes in interest rates related to IRLCs and uncommitted LHFS by utilizing a combination of derivatives related to two-year and five-year U.S. Treasury futures for its Non-QM loans, and 30-year uniform mortgage-backed securities (“UMBS”) futures contracts for its FHA, VA, and Freddie Mac-insured loans (collectively the "Hedging Instruments") until committed to an investor. The Hedging Instruments are typically entered into at the time the IRLC is made. The fair value of Hedging Instruments is subject to change primarily due to changes in interest rates. The Company reports Hedging Instruments at fair value within Derivatives, at fair value, net, in the accompanying Consolidated Statements of Financial Condition with changes in fair value recorded in the accompanying Consolidated Statements of Operations within Gain on origination and sale of loans, net.
(m) Sales, Securitizations, and Re-Securitizations
The Company periodically enters into transactions in which it sells financial assets, such as MBS and mortgage loans. Gains and losses on sales of assets are calculated using the average cost method whereby the Company records a gain or loss on the difference between the average amortized cost of the asset and the proceeds from the sale. In addition, the Company from time to time securitizes or re-securitizes assets and sells tranches in the newly securitized assets. These transactions may be recorded as either sales, whereby the assets contributed to the securitization are removed from the Consolidated Statements of Financial Condition and a gain or loss is recognized, or as secured borrowings whereby the assets contributed to the securitization are not derecognized but rather the debt issued by the securitization entity are recorded to reflect the term financing of the assets. In these securitizations and re-securitizations, the Company may retain senior or subordinated interests in the securitized or re-securitized assets. In transfers that are considered secured borrowings, no gain or loss is recognized. Any difference in the proceeds received and the carrying value of the transferred asset is recorded as a premium or discount and amortized into earnings as an adjustment to yield.
(n) Income Taxes
The Company has elected to be taxed as a REIT and intends to comply with the provision of the Code, with respect thereto. Accordingly, the Company will generally not be subject to U.S. federal, state or local income taxes to the extent that qualifying distributions are made to stockholders and as long as certain asset, income, distribution and stock ownership tests are met. If the Company failed to qualify as a REIT and did not qualify for certain statutory relief provisions, the Company would be subject to U.S. federal, state and local income taxes and may be precluded from qualifying as a REIT for the subsequent four taxable years following the year in which the REIT qualification was lost.
A tax position is recognized only when, based on management’s judgment regarding the application of income tax laws, it is more likely than not that the tax position will be sustained upon examination. The Company does not have any material unrecognized tax positions that would affect its financial statements or require disclosure. No accruals for penalties and interest were necessary as of December 31, 2025 and 2024.
Deferred Income Taxes
The Company accounts for income taxes under the provisions of FASB ASC 740, which requires recognition of deferred tax liabilities and assets for the expected future tax consequences of events that have been included in the consolidated financial statements or tax returns. Under this method, deferred tax liabilities and assets are determined based on the difference between the financial statement and tax bases of assets and liabilities using enacted tax rates for the year in which the differences are expected to reverse.
(o) Stock-Based Compensation
Compensation expense for equity based awards granted to the Company’s independent directors and stock based compensation awards granted to employees of the Company subject only to service condition is recognized on a straight-line basis over the vesting period of such awards, based upon the fair value of such awards at the grant date. For employees who are retirement eligible, defined as years of service to the Company plus age that is equal to or greater than 65, the service period is considered to be fulfilled and all grants are expensed immediately. The Company recognizes forfeitures when they occur and does not adjust the fair value of the grants for estimated forfeitures. For awards subject to vesting on a straight line basis, the total amount of expense is at least equal to the measured expense of each vested tranche. Awards subject to only a service condition are valued according to the market price for the Company’s common stock at the date of grant. For certain awards based on the performance of the Company, it engages an independent appraisal company to determine the value of the award at the date of grant and for other awards it estimates the value of the grant based on its expected performance relative to an established peer
121
group. The Company considers the underlying contingency risks associated with the performance criteria. The values of these grants are expensed ratably over their respective vesting periods (irrespective of achievement of the performance criteria) adjusted, as applicable, for forfeitures.
(p) Use of Estimates
The preparation of financial statements in conformity with GAAP requires the Company to make estimates and assumptions that affect the reported amounts of assets and liabilities and disclosure of contingent assets and liabilities at the date of the financial statements and the reported amounts of revenues and expenses during the reporting period. Although the Company’s estimates contemplate current conditions and how it expects them to change in the future, it is reasonably possible that actual conditions could be materially different than anticipated in those estimates, which could have a material adverse impact on the Company’s results of operations and its financial condition.
The Company has made significant estimates including in accounting for income recognition on Agency MBS, Non-Agency RMBS, IO MBS (Note 3) and residential mortgage loans (Note 4), valuation of Agency MBS and Non-Agency RMBS (Notes 3 and 6), residential mortgage loans (Notes 4 and 6), secured financing agreements (Notes 6 and 7), securitized debt (Notes 6 and 8), interests in MSR financing receivables (Notes 6 and 11), goodwill and intangibles included in Other assets, contingent earn-out liability included in Accounts payable and other liabilities on the Company’s Consolidated Statements of Financial Condition. Actual results could differ materially from those estimates.
(q) Long Term Debt
The Company's Long Term Debt is comprised of unsecured senior notes. Unsecured senior notes are carried at their unpaid principal balance net of any unamortized deferred issuance costs. Interest on the notes is payable quarterly until such time the notes mature. Any debt discounts or premiums are reported as an adjustment to the carrying amount of the debt liability and amortized into interest expense using the effective interest method. Deferred debt issuance costs are expenses associated with the issuance of long-term debt. These expenses typically include underwriting, legal, accounting, and other fees. Deferred debt issuance costs are included in the carrying value of the related long-term debt issued and are amortized as an adjustment to interest expense using the effective interest method, based upon the actual and estimated repayment schedules of the related long-term debt issued.
(r) Investment Management and Advisory Fees
The Company earns advisory fees relating to the terms of investment management agreements entered into with its investment partnerships and privately offered pooled investment vehicles, insurance companies, and other institutional clients (collectively “Clients”).The Company recognizes revenue in accordance with ASC 606, Revenue from Contracts with Customers. The Company’s performance obligation consists primarily of providing continuous investment management and advisory services. Revenue is recognized over time in accordance with ASC 606, as the Clients simultaneously receive and consume the benefits of the Company’s performance as the services are provided. Advisory fees are generally earned based on contractual percentages of (i) assets under management, (ii) unpaid principal balance of underlying assets, or (iii) other defined asset bases, as specified in the applicable client agreements. Fees are typically calculated and billed monthly or periodically in accordance with the contractual terms. The Company applies “right to invoice” practical expedient under ASC 606, as the invoiced amounts correspond directly with the value of services transferred to Clients.
Certain client agreements provide for incentive or transaction-based fees tied to the performance, monetization, or disposition of underlying portfolio assets. Such fees represent variable consideration under ASC 606. The Company estimates variable consideration using the most likely amount method and includes such amounts in revenue only to the extent it is probable that s significant reversal will not occur when the uncertainty associated with the variable consideration is subsequently resolved. Incentive or transaction-based fees are generally recognized upon completion of the underlying transaction or achievement of specified performance thresholds, when the Company’s performance obligation has been satisfied and the amount is no longer subject to significant reversal, including under applicable Clawback provisions.
Invoices for advisory and transaction-based services are generally due upon receipt or within a short period following issuance. The Company’s contracts do not contain significant financing components, as the period between performance and payment is typically very short.
Accounts receivable related to investment management and advisory fees represent trade receivables and are recorded at the invoiced amount, net of an allowance for expected credit losses, if any. These receivables are included in other assets on the Consolidated Statements of Financial Condition. The Company evaluates these receivables for expected credit losses in accordance with ASC 326, Financial Instruments – Credit Losses. The evaluation considers historical loss experience, current conditions, and reasonable and supportable forecasts. As of December 31, 2025, no allowance for credit losses was recorded, as
122
receivables are primarily due from institutional counterparties, are subject to short collection cycles, and the Company has not historically experienced credit losses related to these balances. Interest income is not recognized on these trade receivables.
(s) Business Combinations
In accordance with ASC 805, Business Combinations, acquired assets and liabilities assumed as part of a business acquisition are generally recorded at their fair value at the date of acquisition. Goodwill is calculated as the amount by which the purchase consideration exceeds the net identifiable assets acquired. It reflects the anticipated future economic benefits from the acquired assets that cannot be individually identified or do not meet the criteria for separate recognition.
Determining fair value of identifiable assets, particularly intangibles, and liabilities acquired also requires management to make estimates, which are based on all available information and in some cases assumptions with respect to the timing and amount of future revenues and expenses associated with an asset.
(t) Goodwill & Intangible Assets
At December 31, 2025, the Company recorded goodwill of $95 million, which represents the excess of the fair value of consideration paid over the fair value of net assets acquired in connection with the Palisades and HomeXpress acquisitions, and other intangible assets of $114 million (net of amortization), primarily comprised of asset management contracts and internally developed software, recognized as part of the Palisades Acquisition, and trade names, broker relationships, developed technology, and licenses recognized as part of the HomeXpress acquisition. The intangible assets are amortized over their expected useful lives, which range from to ten years . Goodwill, which is not subject to amortization, and intangible assets are assessed for impairment at least annually, or more frequently under certain circumstances. Through December 31, 2025, the Company had not recognized any impairment against its goodwill or intangible assets. Goodwill and intangible assets are included in Other assets on the Company’s Consolidated Statements of Financial Condition.
(u) Contingent earn-out liability considerations
In connection with the Palisades Acquisition, the Company may be required to make future earnout payments based on the acquired entities achieving certain financial targets over a five-year period. The fair value of this contingent earnout liability is estimated using a Monte Carlo simulation and is considered to be a Level 3 Liability. This approach incorporates a projection of the acquired entities' future revenues, discounted to present value using assumptions such as a discount rate and volatility derived from companies with a similar profile. Earnout payment amounts associated with these revenues are then estimated based on simulations that leverage key market inputs, including a risk-free rate and a credit spread for companies with a similar credit profile to the Company.
The Company believes its assumptions are reasonable based on available information, its experience, knowledge, and judgments. Changes in assumptions and estimates used in our analysis, or future results that vary from assumptions used in the analysis, could affect the fair value of the contingent earn-out and could result in material changes in future periods. The Company recorded $18 million contingent earn-out liability included in Accounts payable and other liabilities on the Company’s Consolidated Statements of Financial Condition.
(v) MSR Financing Receivables
The Company invests in MSR financing receivables which represent the contractual right to receive cash flows associated with MSRs through a structured transaction and related financing arrangement. In these arrangements, a licensed servicer holds legal title to the MSRs and is responsible for performing all servicing activities, while the Company provides financing or capital support and, in return, receives the economic benefits of an excess servicing spread and related servicing cash flows.
Interests in MSR financing receivables
The Company classifies its Interests in MSR financing receivables as Level 3 in the fair value measurements hierarchy. Fair value estimates for these investments are obtained from models, which use significant unobservable inputs in their valuations. These valuations primarily utilize discounted cash flow models that incorporate unobservable market data inputs including interest rates, discount rates, and prepayment rates.
Interest income from investment in MSR financing receivables, net
Recurring servicing fees, ancillary income, recapture income, and float earnings associated with MSRs are recognized on a cash basis when earned and received and included within Interest income from investment in MSR financing receivables, net, on the Consolidated Statements of Operations. The Company does not apply the effective interest method or a level-yield approach in the recognition of interest income on these investments.
123
(w) Segment Reporting
The Company has two reportable segments under the guidance of ASC 280, Segment Reporting: (i) Investment Portfolio, and (ii) Residential Origination. The Investment Portfolio segment consists of the Company’s investments and third-party advisory services activities. The Residential Origination segment consists of the stand-alone mortgage origination business of HomeXpress that originates consumer Non-QM, investor business purpose, and other Non-Agency and Agency mortgage loan products.
The Company's Chief Executive Officer is the Chief Operating Decision Maker (“CODM”). The CODM uses net income and total assets in evaluating performance and determining how to allocate resources of the Company to each of its segments. Refer to Note 20 Segment Reporting.
(x) Adopted Accounting Pronouncements
In December 2023, the FASB issued ASU 2023-09, Income Taxes (Topic 740): Improvements to Income Tax Disclosures. This standard requires entities to provide additional information about federal, state and foreign incomes taxes and reconciling items in the rate reconciliation table, and to disclose further disaggregation of income taxes paid (net of refunds received) by federal (national), state and foreign taxes by jurisdiction. For public business entities, the ASU is effective for fiscal years beginning after December 15, 2024, with early adoption permitted. The guidance should be applied prospectively, but entities have the option to apply it retrospectively for each period presented. The Company adopted ASU 2023-09 for the year ended December 31, 2025. See Note 16 for additional information.
In November 2024, the FASB issued ASU 2024-04, Debt—Debt with Conversion and Other Options (Subtopic 470-20). This standard provides guidance on the accounting treatment for induced conversions of convertible debt. Companies must recognize and measure the impact of incentives offered to induce early conversion of convertible debt separately from existing debt liability. For public business entities, the ASU is effective for fiscal years beginning after December 15, 2025, with early adoption permitted. The guidance should be applied prospectively, but entities have the option to apply it retrospectively for each period presented. The Company adopted ASU 2024-04 as of December 31, 2025, and has determined that this ASU does not have a material effect on the Company’s consolidated financial statements and related disclosures.
(y) Recent Accounting Pronouncements
In January 2025, the FASB issued ASU 2025-01, Income Statement-Reporting Comprehensive Income-Expense Disaggregation Disclosures (Subtopic 220-40). This standard clarifies the effective date for ASU 2024-03, which requires that an entity disclose, in the notes to the financial statements, additional information about specific expenses categories. The amendments in this update are effective for annual reporting periods beginning after December 15, 2026, and interim reporting periods beginning after December 15, 2027. Early adoption of Update 2024-03 is permitted. The Company is still evaluating the impact of this standard but does not expect the adoption of the new standard to have a material effect on its consolidated financial statements.
In August 2025, the FASB issued ASU 2025‑05, Credit Losses on Accounts Receivable (Subtopic 310-10), which updates the guidance for recognizing and measuring credit losses on accounts receivable and other financial assets. The amendments are effective for fiscal years beginning after December 15, 2027, and interim periods beginning after that date. Early adoption is permitted. The Company is currently evaluating the impact of this standard but does not expect its adoption to have a material effect on its consolidated financial statements.
In August 2025, the FASB issued ASU 2025‑06, Intangibles—Goodwill and Other—Internal-Use Software (Subtopic 350‑40), which updates the guidance for capitalizing internal-use software development costs. The amendments are effective for fiscal years beginning after December 15, 2027, and interim periods beginning after that date. Early adoption is permitted. The Company is currently evaluating the impact of this standard but does not expect its adoption to have a material effect on its consolidated financial statements.
In August 2025, the FASB issued ASU 2025-08, Financial Instruments—Credit Losses (Topic 326), which updates the guidance for measuring expected credit losses on financial instruments. The amendments are effective for fiscal years beginning after December 15, 2026, and interim periods beginning after that date. Early adoption is permitted. The Company is currently evaluating the impact of this standard but does not expect its adoption to have a material effect on its consolidated financial statements.
In September 2025, the FASB issued ASU 2025‑07, Derivatives and Hedging (Topic 815) and Revenue From Contracts With Customers (Topic 606): Derivatives Scope Refinements and Scope Clarification for Share‑Based Noncash Consideration From a Customer in a Revenue Contract, which clarifies the scope of derivative accounting and the treatment of share‑based noncash
124
consideration from customers. The amendments are effective for fiscal years beginning after December 15, 2026, including interim periods, with early adoption permitted. The Company is evaluating the impact but does not expect it to have a material effect on its consolidated financial statements.
In November 2025, the FASB issued ASU 2025-09, Derivatives and Hedging (Topic 815): Hedge Accounting Improvements, which updates the guidance related to hedge accounting to better align hedge accounting with entities’ risk management activities. The amendments are effective for fiscal years beginning after December 15, 2026, and interim periods within those annual reporting periods for public business entities, and fiscal years beginning after December 15, 2027, and interim periods within those annual reporting periods for entities other than public business entities. Early adoption is permitted. The Company is currently evaluating the impact of this standard but does not expect its adoption to have a material effect on its consolidated financial statements.
3. Mortgage-Backed Securities
The Company classifies its Non-Agency RMBS as senior, subordinated, or Interest-only. The Company also invests in Agency MBS which it classifies as Agency RMBS, to include residential and residential interest-only MBS, Pass-through securities, residential CMO, and Agency CMBS to include commercial and commercial interest-only MBS. Senior interests in Non-Agency RMBS are generally entitled to the first principal repayments in their pro-rata ownership interests at the acquisition date. The tables below present amortized cost, allowance for credit losses, fair value and unrealized gains/losses of the Company's MBS investments as of December 31, 2025 and December 31, 2024.
| December 31, 2025 | |||||||||||||||||||||||||||||
| (dollars in thousands) | |||||||||||||||||||||||||||||
| Principal or Notional Value | Total Premium | Total Discount | Amortized Cost | Allowance for Credit Loss | Fair Value | Gross Unrealized Gains | Gross Unrealized Losses | Net Unrealized Gain/(Loss) | |||||||||||||||||||||
| Non-Agency RMBS | |||||||||||||||||||||||||||||
| Senior | $ | $ | $ | ( | $ | $ | ( | $ | $ | $ | ( | $ | |||||||||||||||||
| Subordinated | ( | ( | ( | ||||||||||||||||||||||||||
| Interest-only | ( | ( | |||||||||||||||||||||||||||
| Agency RMBS | |||||||||||||||||||||||||||||
| Pass-through | ( | ( | |||||||||||||||||||||||||||
| CMO | ( | ( | |||||||||||||||||||||||||||
| Interest-only | ( | ( | |||||||||||||||||||||||||||
| Agency CMBS | |||||||||||||||||||||||||||||
| Project loans | ( | ( | |||||||||||||||||||||||||||
| Interest-only | ( | ( | |||||||||||||||||||||||||||
| Total | $ | $ | $ | ( | $ | $ | ( | $ | $ | $ | ( | $ | |||||||||||||||||
125
| December 31, 2024 | |||||||||||||||||||||||||||||
| (dollars in thousands) | |||||||||||||||||||||||||||||
| Principal or Notional Value | Total Premium | Total Discount | Amortized Cost | Allowance for Credit Loss | Fair Value | Gross Unrealized Gains | Gross Unrealized Losses | Net Unrealized Gain/(Loss) | |||||||||||||||||||||
| Non-Agency RMBS | |||||||||||||||||||||||||||||
| Senior | $ | $ | $ | ( | $ | $ | ( | $ | $ | $ | ( | $ | |||||||||||||||||
| Subordinated | ( | ( | ( | ( | |||||||||||||||||||||||||
| Interest-only | ( | ( | |||||||||||||||||||||||||||
| Agency RMBS | |||||||||||||||||||||||||||||
| CMO | ( | ( | ( | ||||||||||||||||||||||||||
| Interest-only | ( | ( | |||||||||||||||||||||||||||
| Agency CMBS | |||||||||||||||||||||||||||||
| Project loans | ( | ( | |||||||||||||||||||||||||||
| Interest-only | ( | ||||||||||||||||||||||||||||
| Total | $ | $ | $ | ( | $ | $ | ( | $ | $ | $ | ( | $ | |||||||||||||||||
The following tables present the gross unrealized losses and estimated fair value of the Company’s Agency and Non-Agency MBS by length of time that such securities have been in a continuous unrealized loss position at December 31, 2025 and December 31, 2024. All Non-Agency RMBS held as available-for-sale, and not accounted under the fair value option election in an unrealized loss position, have been evaluated by the Company for current expected credit losses.
| December 31, 2025 | |||||||||||||||||||||||||||||||||||
| (dollars in thousands) | |||||||||||||||||||||||||||||||||||
| Unrealized Loss Position for Less than 12 Months | Unrealized Loss Position for 12 Months or More | Total | |||||||||||||||||||||||||||||||||
| Estimated Fair Value | Unrealized Losses | Number of Positions | Estimated Fair Value | Unrealized Losses | Number of Positions | Estimated Fair Value | Unrealized Losses | Number of Positions | |||||||||||||||||||||||||||
| Non-Agency RMBS | |||||||||||||||||||||||||||||||||||
| Senior | $ | $ | ( | $ | $ | ( | $ | $ | ( | ||||||||||||||||||||||||||
| Subordinated | ( | ( | ( | ||||||||||||||||||||||||||||||||
| Interest-only | ( | ( | ( | ||||||||||||||||||||||||||||||||
| Agency RMBS | |||||||||||||||||||||||||||||||||||
| Pass-through | ( | ( | |||||||||||||||||||||||||||||||||
| CMO | ( | ( | |||||||||||||||||||||||||||||||||
| Interest-only | ( | ( | ( | ||||||||||||||||||||||||||||||||
| Agency CMBS | |||||||||||||||||||||||||||||||||||
| Project loans | ( | ( | ( | ||||||||||||||||||||||||||||||||
| Interest-only | ( | ( | |||||||||||||||||||||||||||||||||
| Total | $ | $ | ( | $ | $ | ( | $ | $ | ( | ||||||||||||||||||||||||||
126
| December 31, 2024 | |||||||||||||||||||||||||||||||||||
| (dollars in thousands) | |||||||||||||||||||||||||||||||||||
| Unrealized Loss Position for Less than 12 Months | Unrealized Loss Position for 12 Months or More | Total | |||||||||||||||||||||||||||||||||
| Estimated Fair Value | Unrealized Losses | Number of Positions | Estimated Fair Value | Unrealized Losses | Number of Positions | Estimated Fair Value | Unrealized Losses | Number of Positions | |||||||||||||||||||||||||||
| Non-Agency RMBS | |||||||||||||||||||||||||||||||||||
| Senior | $ | $ | ( | $ | $ | ( | $ | $ | ( | ||||||||||||||||||||||||||
| Subordinated | ( | ( | ( | ||||||||||||||||||||||||||||||||
| Interest-only | ( | ( | ( | ||||||||||||||||||||||||||||||||
| Agency RMBS | |||||||||||||||||||||||||||||||||||
| CMO | ( | ( | |||||||||||||||||||||||||||||||||
| Interest-only | ( | ( | ( | ||||||||||||||||||||||||||||||||
| Agency CMBS | |||||||||||||||||||||||||||||||||||
| Project loans | ( | ( | ( | ||||||||||||||||||||||||||||||||
| Interest-only | ( | ( | ( | ||||||||||||||||||||||||||||||||
| Total | $ | $ | ( | $ | $ | ( | $ | $ | ( | ||||||||||||||||||||||||||
At December 31, 2025, the Company did not intend to sell any of its Agency and Non-Agency MBS classified as available-for-sale that were in an unrealized loss position, and it was not more likely than not that the Company would be required to sell these MBS investments before recovery of their amortized cost basis, which may be at their maturity. During the period, the Company sold certain securities, resulting in reductions to the unrealized losses associated with these securities totaling $858 thousand. With respect to RMBS held by consolidated VIEs, the ability of any entity to cause the sale by the VIE prior to the maturity of these RMBS is either expressly prohibited, not probable, or is limited to specified events of default, none of which have occurred as of December 31, 2025.
Gross unrealized losses on the Company’s Non-Agency RMBS (excluding Non-Agency RMBS which are reported at fair value with changes in fair value recorded in earnings), net of any allowance for credit losses, were $7 million and $15 million, at December 31, 2025 and December 31, 2024, respectively. After evaluating the securities and recording any allowance for credit losses, the Company concluded that the remaining unrealized losses reflected above were non-credit related and would be recovered from the securities' estimated future cash flows. The Company considered a number of factors in reaching this conclusion, including that it did not intend to sell the securities, it was not considered more likely than not that it would be required to sell the securities prior to recovering the amortized cost, and there were no material credit events that would have caused the Company to otherwise conclude that it would not recover the amortized cost. The allowance for credit losses are calculated by comparing the estimated future cash flows of each security discounted at the yield determined as of the initial acquisition date or, if since revised, as of the last date previously revised, to the net amortized cost basis. Significant judgment is used in projecting cash flows for Non-Agency RMBS.
The Company has reviewed its Non-Agency RMBS that are in an unrealized loss position to identify those securities with losses that are credit related based on an assessment of changes in cash flows expected to be collected for such RMBS, which considers recent bond performance and expected future performance of the underlying collateral. A summary of the credit losses allowance on available-for-sale securities for the years ended December 31, 2025 and December 31, 2024 are presented below.
| For the Years Ended | ||||||||
| December 31, 2025 | December 31, 2024 | |||||||
| (dollars in thousands) | ||||||||
| Beginning allowance for credit losses | $ | $ | ||||||
| Additions to the allowance for credit losses on securities for which credit losses were not previously recorded | ||||||||
| Allowance on purchased financial assets with credit deterioration | ||||||||
| Reductions for the securities sold during the period | ( | |||||||
| Increase/(decrease) on securities with an allowance in the prior period | ||||||||
| Write-offs charged against the allowance | ( | ( | ||||||
| Recoveries of amounts previously written off | ||||||||
| Ending allowance for credit losses | $ | $ | ||||||
127
The following table presents significant credit quality indicators used for the credit loss allowance on our Non-Agency RMBS investments as of December 31, 2025 and December 31, 2024.
| December 31, 2025 | ||||||||||||||
| (dollars in thousands) | ||||||||||||||
| Prepay Rate | CDR | Loss Severity | ||||||||||||
| Amortized Cost | Weighted Average | Weighted Average | Weighted Average | |||||||||||
| Non-Agency RMBS | ||||||||||||||
| Senior | $ | |||||||||||||
| Subordinated | $ | |||||||||||||
| December 31, 2024 | ||||||||||||||
| (dollars in thousands) | ||||||||||||||
| Prepay Rate | CDR | Loss Severity | ||||||||||||
| Amortized Cost | Weighted Average | Weighted Average | Weighted Average | |||||||||||
| Non-Agency RMBS | ||||||||||||||
| Senior | $ | |||||||||||||
| Subordinated | $ | |||||||||||||
The increase in the allowance for credit losses for the year ended December 31, 2025, is primarily due to a deterioration in cashflows on certain investments, compared to the same period of 2024. In addition, certain Non-Agency RMBS positions now have higher unrealized losses and resulted in the recognition of an allowance for credit losses which was previously limited by unrealized gains on these investments.
The following tables present a summary of unrealized gains and losses at December 31, 2025 and December 31, 2024.
| December 31, 2025 | ||||||||||||||||||||
| (dollars in thousands) | ||||||||||||||||||||
| Gross Unrealized Gain Included in Accumulated Other Comprehensive Income | Gross Unrealized Gain Included in Cumulative Earnings | Total Gross Unrealized Gain | Gross Unrealized Loss Included in Accumulated Other Comprehensive Income | Gross Unrealized Loss Included in Cumulative Earnings | Total Gross Unrealized Loss | |||||||||||||||
| Non-Agency RMBS | ||||||||||||||||||||
| Senior | $ | $ | $ | $ | ( | $ | $ | ( | ||||||||||||
| Subordinated | ( | ( | ( | |||||||||||||||||
| Interest-only | ( | ( | ||||||||||||||||||
| Agency RMBS | ||||||||||||||||||||
| Pass-through | ( | ( | ||||||||||||||||||
| CMO | ( | ( | ||||||||||||||||||
| Interest-only | ( | ( | ||||||||||||||||||
| Agency CMBS | ||||||||||||||||||||
| Project loans | ( | ( | ||||||||||||||||||
| Interest-only | ( | ( | ||||||||||||||||||
| Total | $ | $ | $ | $ | ( | $ | ( | $ | ( | |||||||||||
128
| December 31, 2024 | ||||||||||||||||||||
| (dollars in thousands) | ||||||||||||||||||||
| Gross Unrealized Gain Included in Accumulated Other Comprehensive Income | Gross Unrealized Gain Included in Cumulative Earnings | Total Gross Unrealized Gain | Gross Unrealized Loss Included in Accumulated Other Comprehensive Income | Gross Unrealized Loss Included in Cumulative Earnings | Total Gross Unrealized Loss | |||||||||||||||
| Non-Agency RMBS | ||||||||||||||||||||
| Senior | $ | $ | $ | $ | ( | $ | ( | $ | ( | |||||||||||
| Subordinated | ( | ( | ( | |||||||||||||||||
| Interest-only | ( | ( | ||||||||||||||||||
| Agency RMBS | ||||||||||||||||||||
| CMO | ( | ( | ||||||||||||||||||
| Interest-only | ( | ( | ||||||||||||||||||
| Agency CMBS | ||||||||||||||||||||
| Project loans | ( | ( | ||||||||||||||||||
| Interest-only | ( | ( | ||||||||||||||||||
| Total | $ | $ | $ | $ | ( | $ | ( | $ | ( | |||||||||||
Changes in prepayments, actual cash flows, and cash flows expected to be collected, among other items, are affected by the collateral characteristics of each asset class. The Company chooses assets for the portfolio after carefully evaluating each investment’s risk profile.
The following tables provide a summary of the Company’s MBS portfolio at December 31, 2025 and December 31, 2024;
| December 31, 2025 | |||||||||||||||||
| Principal or Notional Value at Period-End (dollars in thousands) | Weighted Average Amortized Cost Basis | Weighted Average Fair Value | Weighted Average Coupon | Weighted Average Yield at Period-End (1) | |||||||||||||
| Non-Agency RMBS | |||||||||||||||||
| Senior | $ | $ | $ | % | % | ||||||||||||
| Subordinated | % | % | |||||||||||||||
| Interest-only | % | % | |||||||||||||||
| Agency RMBS | |||||||||||||||||
| Pass-through | % | % | |||||||||||||||
| CMO | % | % | |||||||||||||||
| Interest-only | % | % | |||||||||||||||
| Agency CMBS | |||||||||||||||||
| Project loans | % | % | |||||||||||||||
| Interest-only | % | % | |||||||||||||||
(1) Bond Equivalent Yield at period end.
129
| December 31, 2024 | |||||||||||||||||
| Principal or Notional Value at Period-End (dollars in thousands) | Weighted Average Amortized Cost Basis | Weighted Average Fair Value | Weighted Average Coupon | Weighted Average Yield at Period-End (1) | |||||||||||||
| Non-Agency RMBS | |||||||||||||||||
| Senior | $ | $ | $ | % | % | ||||||||||||
| Subordinated | % | % | |||||||||||||||
| Interest-only | % | % | |||||||||||||||
| Agency RMBS | |||||||||||||||||
| CMO | % | % | |||||||||||||||
| Interest-only | % | % | |||||||||||||||
| Agency CMBS | |||||||||||||||||
| Project loans | % | % | |||||||||||||||
| Interest-only | % | % | |||||||||||||||
(1) Bond Equivalent Yield at period end.
Actual maturities of MBS are generally shorter than the stated contractual maturities. Actual maturities of the Company’s MBS are affected by the underlying mortgages, periodic payments of principal, realized losses and prepayments of principal. The following tables provide a summary of the fair value and amortized cost of the Company’s MBS at December 31, 2025 and December 31, 2024 according to their estimated weighted-average life classifications. The weighted-average lives of the MBS in the tables below are based on lifetime expected prepayment rates using the Company's prepayment assumptions for the Agency MBS and Non-Agency RMBS. The prepayment model considers a variety of factors, including but not limited to current interest rates, forward interest rate projections, shape and steepness of the interest rate curve, current mortgage rates, mortgage rates of the outstanding loan, and other borrower, loan, property, or market-related characteristics that may influence prepayment behavior.
130
| December 31, 2025 | |||||||||||||||||
| (dollars in thousands) | |||||||||||||||||
| Weighted Average Life | |||||||||||||||||
| Less than one year | Greater than one year and less than five years | Greater than five years and less than ten years | Greater than ten years | Total | |||||||||||||
| Fair value | |||||||||||||||||
| Non-Agency RMBS | |||||||||||||||||
| Senior | $ | $ | $ | $ | $ | ||||||||||||
| Subordinated | |||||||||||||||||
| Interest-only | |||||||||||||||||
| Agency RMBS | |||||||||||||||||
| Pass-through | |||||||||||||||||
| CMO | |||||||||||||||||
| Interest-only | |||||||||||||||||
| Agency CMBS | |||||||||||||||||
| Project loans | |||||||||||||||||
| Interest-only | |||||||||||||||||
| Total fair value | $ | $ | $ | $ | $ | ||||||||||||
| Amortized cost | |||||||||||||||||
| Non-Agency RMBS | |||||||||||||||||
| Senior | $ | $ | $ | $ | $ | ||||||||||||
| Subordinated | |||||||||||||||||
| Interest-only | |||||||||||||||||
| Agency RMBS | |||||||||||||||||
| Pass-through | |||||||||||||||||
| CMO | |||||||||||||||||
| Interest-only | |||||||||||||||||
| Agency CMBS | |||||||||||||||||
| Project loans | |||||||||||||||||
| Interest-only | |||||||||||||||||
| Total amortized cost | $ | $ | $ | $ | $ | ||||||||||||
131
| December 31, 2024 | |||||||||||||||||
| (dollars in thousands) | |||||||||||||||||
| Weighted Average Life | |||||||||||||||||
| Less than one year | Greater than one year and less than five years | Greater than five years and less than ten years | Greater than ten years | Total | |||||||||||||
| Fair value | |||||||||||||||||
| Non-Agency RMBS | |||||||||||||||||
| Senior | $ | $ | $ | $ | $ | ||||||||||||
| Subordinated | |||||||||||||||||
| Interest-only | |||||||||||||||||
| Agency RMBS | |||||||||||||||||
| CMO | |||||||||||||||||
| Interest-only | |||||||||||||||||
| Agency CMBS | |||||||||||||||||
| Project loans | |||||||||||||||||
| Interest-only | |||||||||||||||||
| Total fair value | $ | $ | $ | $ | $ | ||||||||||||
| Amortized cost | |||||||||||||||||
| Non-Agency RMBS | |||||||||||||||||
| Senior | $ | $ | $ | $ | $ | ||||||||||||
| Subordinated | |||||||||||||||||
| Interest-only | |||||||||||||||||
| Agency RMBS | |||||||||||||||||
| CMO | |||||||||||||||||
| Interest-only | |||||||||||||||||
| Agency CMBS | |||||||||||||||||
| Project loans | |||||||||||||||||
| Interest-only | |||||||||||||||||
| Total amortized cost | $ | $ | $ | $ | $ | ||||||||||||
The Non-Agency RMBS investments are secured by pools of mortgage loans which are subject to credit risk. The following table summarizes the delinquency, bankruptcy, foreclosure and real estate owned, or REO, total of the pools of mortgage loans securing the Company’s investments in Non-Agency RMBS at December 31, 2025 and December 31, 2024. When delinquency rates increase, it is expected that the Company will incur additional credit losses.
| December 31, 2025 | 30 Days Delinquent | 60 Days Delinquent | 90+ Days Delinquent | Bankruptcy | Foreclosure | REO | Total | ||||||||||||||||
| % of Unpaid Principal Balance | % | % | % | % | % | % | % | ||||||||||||||||
| December 31, 2024 | 30 Days Delinquent | 60 Days Delinquent | 90+ Days Delinquent | Bankruptcy | Foreclosure | REO | Total | ||||||||||||||||
| % of Unpaid Principal Balance | % | % | % | % | % | % | % | ||||||||||||||||
The Non-Agency RMBS in the Portfolio have the following collateral characteristics at December 31, 2025 and December 31, 2024.
| December 31, 2025 | December 31, 2024 | |||||||||||||
| Weighted average maturity (years) | ||||||||||||||
Weighted average amortized loan to value (1) | % | % | ||||||||||||
Weighted average FICO (2) | ||||||||||||||
| Weighted average loan balance (in thousands) | $ | $ | ||||||||||||
| Weighted average percentage owner-occupied | % | % | ||||||||||||
| Weighted average percentage single family residence | % | % | ||||||||||||
| Weighted average current credit enhancement | % | % | ||||||||||||
| Weighted average geographic concentration of top four states | CA | % | CA | % | ||||||||||
| NY | % | NY | % | |||||||||||
| FL | % | FL | % | |||||||||||
| NJ | % | NJ | % | |||||||||||
(1) Value represents appraised value of the collateral at the time of loan origination.
(2) FICO as determined at the time of loan origination.
132
The table below presents the origination year of the underlying loans related to the Company’s portfolio of Non-Agency RMBS at December 31, 2025 and December 31, 2024.
| Origination Year | December 31, 2025 | December 31, 2024 | ||||||
| 2003 and prior | % | % | ||||||
| 2004 | % | % | ||||||
| 2005 | % | % | ||||||
| 2006 | % | % | ||||||
| 2007 | % | % | ||||||
| 2008 - 2017 | % | % | ||||||
| 2018 | % | % | ||||||
| 2019 | % | % | ||||||
| 2020 | % | % | ||||||
| 2021 | % | % | ||||||
| 2022 | % | % | ||||||
| 2023 | % | % | ||||||
| 2024 | % | % | ||||||
| 2025 and later | % | % | ||||||
| Total | % | % | ||||||
Gross realized gains and losses are recorded in “Net realized losses on sales of investments” on the Company’s Consolidated Statements of Operations. The proceeds and gross realized gains and gross realized losses from sales of investments for the years ended December 31, 2025, 2024, and 2023 are as follows:
| For the Years Ended | |||||||||||
| December 31, 2025 | December 31, 2024 | December 31, 2023 | |||||||||
| (dollars in thousands) | |||||||||||
| Proceeds from sales: | |||||||||||
| Non-Agency RMBS | $ | $ | $ | ||||||||
| Agency RMBS | |||||||||||
| Agency CMBS | |||||||||||
| Gross realized gains: | |||||||||||
| Non-Agency RMBS | |||||||||||
| Agency RMBS | |||||||||||
| Agency CMBS | |||||||||||
| Gross realized losses: | |||||||||||
| Non-Agency RMBS | ( | ||||||||||
| Agency RMBS | ( | ( | |||||||||
| Agency CMBS | ( | ( | ( | ||||||||
| Net realized gain (loss) | $ | ( | $ | ( | $ | ( | |||||
4. Loans Held for Investment
The Loans held for investment are comprised primarily of seasoned reperforming residential mortgages. Additionally, it includes jumbo prime loans, investor loans and business purpose loans.
The investor loans are loans to individuals securing non-primary residences as well as to individuals or businesses who rent out the residential properties secured by such loans. The Company purchases qualified mortgages, or QM, and non-qualified mortgages, or Non-QM, investor loans and securitizes them under its loan securitization program. The business purpose loans are loans to businesses that are secured by real property which will be renovated by the borrower. The business purpose loans tend to be short duration, often less than one year, and generally the coupon rate is higher than residential mortgage loans.
At December 31, 2025 and December 31, 2024, all Loans held for investment are carried at fair value. See Note 6 for a discussion on how the Company determines the fair values of the Loans held for investment. As changes in the fair value of these loans are reflected in earnings, the Company does not estimate or record a loan loss provision. The total amortized cost of the Company's Loans held for investment was $9.8 billion and $11.4 billion as of December 31, 2025 and December 31, 2024,
133
respectively. The total unpaid principal balance of the Company's Loans held for investment was $10.0 billion and $11.7 billion as of December 31, 2025 and December 31, 2024, respectively.
The following table provides a summary of the changes in the carrying value of Loans held for investment at fair value at December 31, 2025 and December 31, 2024:
| For the Year Ended | ||||||||
| December 31, 2025 | December 31, 2024 | |||||||
| (dollars in thousands) | ||||||||
| Balance, beginning of period | $ | $ | ||||||
| Purchases | ||||||||
| Principal paydowns | ( | ( | ||||||
| Sales and settlements | ( | ( | ||||||
| Net periodic accretion (amortization) | ( | ( | ||||||
| Realized gains (losses) on sales and settlements | ( | |||||||
| Change in fair value | ||||||||
| Balance, end of period | $ | $ | ||||||
The primary cause of the change in fair value is due to market demand, interest rates and changes in credit risk of mortgage loans. The Company did no
Residential mortgage loans
The loan portfolio for all residential mortgages were originated during the following periods:
| Origination Year | December 31, 2025 | December 31, 2024 | ||||||
| 2002 and prior | % | % | ||||||
| 2003 | % | % | ||||||
| 2004 | % | % | ||||||
| 2005 | % | % | ||||||
| 2006 | % | % | ||||||
| 2007 | % | % | ||||||
| 2008 | % | % | ||||||
| 2009 | % | % | ||||||
| 2010 - 2020 | % | % | ||||||
| 2021 | % | % | ||||||
| 2022 | % | % | ||||||
| 2023 and later | % | % | ||||||
| Total | % | % | ||||||
The following table presents a summary of key characteristics of the residential loan portfolio at December 31, 2025 and December 31, 2024:
134
| December 31, 2025 | December 31, 2024 | |||||||||||||
| Number of loans | ||||||||||||||
| Weighted average maturity (years) | ||||||||||||||
Weighted average loan to value (1) | % | % | ||||||||||||
| Weighted average FICO | ||||||||||||||
| Weighted average loan balance (in thousands) | $ | $ | ||||||||||||
| Weighted average percentage owner occupied | % | % | ||||||||||||
| Weighted average percentage single family residence | % | % | ||||||||||||
| Weighted average geographic concentration of top five states | CA | % | CA | % | ||||||||||
| FL | % | FL | % | |||||||||||
| NY | % | NY | % | |||||||||||
| PA | % | PA | % | |||||||||||
| NJ | % | NJ | % | |||||||||||
(1) Value represents appraised value of the collateral at the time of loan origination.
The following table summarizes the outstanding principal balance of the residential loan portfolio which are 30 days delinquent and greater as reported by the servicers at December 31, 2025 and December 31, 2024, respectively.
| December 31, 2025 | ||||||||||||||||||||
| (dollars in thousands) | ||||||||||||||||||||
| Loan Balance | Number of Loans | Interest Rate | Maturity Date | Total Principal | 30-89 Days Delinquent | 90+ Days Delinquent | ||||||||||||||
| Held-for-Investment at fair value: | ||||||||||||||||||||
| Adjustable rate loans: | ||||||||||||||||||||
| $1 to $250 | 10/1/2003 - 10/1/2063 | $ | ||||||||||||||||||
| $250 to $500 | 8/1/2032 - 10/1/2061 | |||||||||||||||||||
| $500 to $750 | 5/1/2035 - 9/1/2056 | |||||||||||||||||||
| $750 to $1,000 | 2/1/2037 - 11/1/2053 | |||||||||||||||||||
| Over $1,000 | 10/1/2034 - 8/1/2059 | |||||||||||||||||||
| $ | ||||||||||||||||||||
| Fixed loans: | ||||||||||||||||||||
| $1 to $250 | 1/1/1999 - 6/1/2068 | $ | ||||||||||||||||||
| $250 to $500 | 12/1/2005 - 9/1/2064 | |||||||||||||||||||
| $500 to $750 | 3/1/2013 - 5/1/2063 | |||||||||||||||||||
| $750 to $1,000 | 3/1/2021 - 10/1/2062 | |||||||||||||||||||
| Over $1,000 | 1/1/2021 - 6/1/2062 | |||||||||||||||||||
| $ | ||||||||||||||||||||
| Total | $ | |||||||||||||||||||
The foreclosure, bankruptcy, and REO principal balances on our loans were $275 million, $183 million and $41 million, respectively, as of December 31, 2025, which are included in the table above.
135
| December 31, 2024 | ||||||||||||||||||||
| (dollars in thousands) | ||||||||||||||||||||
| Loan Balance | Number of Loans | Interest Rate | Maturity Date | Total Principal | 30-89 Days Delinquent | 90+ Days Delinquent | ||||||||||||||
| Held-for-Investment at fair value: | ||||||||||||||||||||
| Adjustable rate loans: | ||||||||||||||||||||
| $1 to $250 | 10/1/2003 - 10/1/2061 | $ | ||||||||||||||||||
| $250 to $500 | 12/15/2030 - 10/1/2061 | |||||||||||||||||||
| $500 to $750 | 8/1/2034 - 9/1/2056 | |||||||||||||||||||
| $750 to $1,000 | 11/1/2035 - 2/1/2059 | |||||||||||||||||||
| Over $1,000 | 10/1/2034 - 8/1/2059 | |||||||||||||||||||
| $ | ||||||||||||||||||||
| Fixed loans: | ||||||||||||||||||||
| $1 to $250 | 7/1/2000 - 1/1/2099 | $ | ||||||||||||||||||
| $250 to $500 | 12/1/2005 - 4/1/2063 | |||||||||||||||||||
| $500 to $750 | 3/1/2013 - 5/1/2063 | |||||||||||||||||||
| $750 to $1,000 | 3/1/2021 - 10/1/2062 | |||||||||||||||||||
| Over $1,000 | 1/1/2021 - 6/1/2062 | |||||||||||||||||||
| $ | ||||||||||||||||||||
| Total | $ | |||||||||||||||||||
The foreclosure, bankruptcy, and REO principal balances on our loans were $301 million, $178 million and $37 million, respectively, as of December 31, 2024, which are included in the table above.
The fair value of residential mortgage loans 90 days or more past due was $558 million and $595 million as of December 31, 2025 and December 31, 2024, respectively.
5. Loans Held for Sale
Loans held for sale consist of mortgage loans originated or acquired by the Company with the intent to sell into the secondary market. LHFS are measured and reported at fair value. See Note 6 for a discussion on how the Company determines the fair values of the LHFS. The Company’s fair value election for its LHFS is intended to more accurately reflect the underlying economics of the Company’s operations. With the election of the fair value option for LHFS, loan origination fees, and the related direct loan origination costs associated with the origination of LHFS are earned and expensed as incurred, respectively. The total unpaid principal balance of the Company's Loans held for sale was $871.8 million as of December 31, 2025. Loans held for sale consisted of the following as of December 31. 2025:
| For the Year Ended | |||||
| December 31, 2025 | |||||
| (dollars in thousands) | |||||
| Unpaid principal balance | $ | ||||
| Net unrealized gains | |||||
| Loans held for sale, at fair value | $ | ||||
The primary cause of the change in fair value is due to market demand, interest rates and changes in credit risk of mortgage loans. The Company did not retain any beneficial interests on loan sales during the year ended December 31, 2025.
Revenue derived from the Company’s mortgage lending activities includes certain fees collected at the time of origination and gain or loss from the sale of LHFS. Loan origination income reflects the fees earned, net of lender credits from originating the loans. These consist of fees related to loan origination, discount points, underwriting, processing and other fees. Lender credits typically are related to rebates or concessions for certain loan origination costs.
Gain or loss from the sale and mark-to-market of LHFS includes both realized and unrealized gains and losses and are included in the Gain on origination and sale of loans, net in the accompanying Consolidated Statements of Operations. The valuation of
136
LHFS approximates a whole-loan sales value, which includes the value of the related mortgage servicing rights. When LHFS sold, servicing rights are released.
The Company principally sells its LHFS to private investors. The Company evaluates its loan sales for sales treatment. To the extent the transfer of loans qualifies as a sale, the Company derecognizes the loans and records the gain or loss on the sale date. In the event the Company determines that the transfer of loans does not qualify as a sale, the transfer would be treated as a secured borrowing. Interest income from loans is recorded on the accrual basis. LHFS are placed on non-accrual status when any portion of the principal or interest is 90 days past due or earlier if factors indicate that the ultimate collectability of the principal or interest is not probable. Interest received from loans on non-accrual status is recorded as income when collected. Loans return to accrual status when the principal and interest become current, and it is probable that the amounts are fully collectible.
The following table provides a summary of the changes in the carrying value of Loans held for sale at fair value at December 31, 2025:
| December 31, 2025 | |||||
| (dollars in thousands) | |||||
| Balance, beginning of period | $ | ||||
| Acquired | |||||
| Originations | |||||
| Purchases | |||||
| Sales to Investors | ( | ||||
| Principal Paydowns | ( | ||||
| Net change in fair value | |||||
| Balance, end of period | $ | ||||
The Company monitors the credit quality of loans held for sale through its underwriting and post-origination review processes. As of December 31, 2025, substantially all loans held for sale were current, and delinquent loans were not material.
Gain on Origination and Sale of Loans
The following table provides a summary of the changes in the gain on origination and sale of loans for the year then ended December 31, 2025:
| For the Year Ended | |||||||||||||||||
| December 31, 2025 | |||||||||||||||||
| (dollars in thousands) | |||||||||||||||||
| Premium from loan sales | $ | ||||||||||||||||
| Mark to market changes on LHFS | |||||||||||||||||
| Unrealized gains (losses) from derivative instruments | ( | ||||||||||||||||
| Provision for loan repurchase reserves | ( | ||||||||||||||||
| Realized gains from derivative instruments, net | |||||||||||||||||
| Loan origination loss, net | ( | ||||||||||||||||
| Direct loan origination costs, net | ( | ||||||||||||||||
| Total gain on origination and sale of loans, net | $ | ||||||||||||||||
6. Fair Value Measurements
The Company applies fair value guidance in accordance with GAAP to account for its financial instruments. The Company categorizes its financial instruments, based on the priority of the inputs to the valuation technique, into a three-level fair value hierarchy. The fair value hierarchy gives the highest priority to quoted prices in active markets for identical assets or liabilities (Level 1) and the lowest priority to unobservable inputs (Level 3). If the inputs used to measure the financial instruments fall within different levels of the hierarchy, the categorization is based on the lowest level input that is significant to the fair value measurement of the instrument. Financial assets and liabilities recorded at fair value on the Consolidated Statements of Financial Condition or disclosed in the related notes are categorized based on the inputs to the valuation techniques as follows:
137
Level 1 – inputs to the valuation methodology are quoted prices (unadjusted) for identical assets and liabilities in active markets.
Level 2 – inputs to the valuation methodology include quoted prices for similar assets and liabilities in active markets, and inputs that are observable for the asset or liability, either directly or indirectly, for substantially the full term of the financial instrument.
Level 3 – inputs to the valuation methodology are unobservable and significant to fair value.
Fair value measurements categorized within Level 3 are sensitive to changes in the assumptions or methodology used to determine fair value and such changes could result in a significant increase or decrease in the fair value. Any changes to the valuation methodology are reviewed by the Company to ensure the changes are appropriate. As markets and products evolve and the pricing for certain products becomes more transparent, the Company will continue to refine its valuation methodologies. The methodology utilized by the Company for the periods presented is unchanged. The methods used to produce a fair value calculation may not be indicative of net realizable value or reflective of future fair values. Furthermore, the Company believes its valuation methods are appropriate and consistent with other market participants. Using different methodologies, or assumptions, to determine the fair value of certain financial instruments could result in a different estimate of fair value at the reporting date. The Company uses inputs that are current as of the measurement date, which may include periods of market dislocation, during which price transparency may be reduced.
The Company determines the fair values of its investments using internally developed processes and validates them using a third-party pricing service. During times of market dislocation, the observability of prices and inputs can be difficult for certain investments. If the third-party pricing service is unable to provide a price for an asset, or if the price provided by them is deemed unreliable by the Company, then the asset will be valued at its fair value as determined by the Company without validation to third-party pricing. Illiquid investments typically experience greater price volatility as an active market does not exist. Observability of prices and inputs can vary significantly from period to period and may cause instruments to change classifications within the three level hierarchy.
A description of the methodologies utilized by the Company to estimate the fair value of its financial instruments by instrument class follows:
Agency MBS and Non-Agency RMBS
The Company determines the fair value of all of its investment securities based on discounted cash flows utilizing an internal pricing model that incorporates factors such as coupon, prepayment speeds, loan size, collateral composition, borrower characteristics, expected interest rates, life caps, periodic caps, reset dates, collateral seasoning, delinquency, expected losses, expected default severity, credit enhancement, and other pertinent factors. To corroborate that the estimates of fair values generated by these internal models are reflective of current market prices, the Company compares the fair values generated by the model to non-binding independent prices provided by an independent third-party pricing service. For certain highly liquid asset classes, such as Agency fixed-rate Pass-through bonds, the Company’s valuations are also compared to quoted prices for To-Be-Announced, or TBA, securities.
Each quarter, the Company develops thresholds generally using market factors or other assumptions, as appropriate. If internally developed model prices differ from the independent third-party prices by greater than these thresholds for the period, the Company conducts a further review, both internally and with the third-party pricing service of the prices of such securities. First, the Company obtains the inputs used by the third-party pricing service and compares them to the Company’s inputs. The Company then updates its own inputs if the Company determines the third-party pricing inputs more accurately reflect the current market environment. If the Company believes that its internally developed inputs more accurately reflect the current market environment, it will request that the third-party pricing service review market factors that may not have been considered by the third-party pricing service and provide updated prices. The Company reconciles and resolves all pricing differences in excess of the thresholds before a final price is established. At December 31, 2025, one investment holding with an internally developed fair value of $5 million had a difference between the model generated price and third-party price provided in excess of the threshold for the period. The internally developed price was $701 thousand higher than the third-party price provided of $5 million. After review and discussion, the Company affirmed and valued the investments at the higher internally developed price. No other differences were noted at December 31, 2025 in excess of the thresholds for the period. At December 31, 2024, six investment holdings with internally developed fair values of $37 million had a difference between the model generated prices and third-party prices provided in excess of the thresholds for the period. The internally developed prices were $6 million higher than the third-party prices provided of $31 million. After review and discussion, the Company affirmed and valued the
138
investments at the higher internally developed prices. No other differences were noted at December 31, 2024 in excess of the thresholds for the period.
The Company’s estimate of prepayment, default and severity curves all involve judgment and assumptions that are deemed to be significant to the fair value measurement process. This subjective estimation process renders the Non-Agency RMBS fair value estimates as Level 3 in the fair value hierarchy. As the fair values of Agency MBS are more observable, these investments are classified as Level 2 in the fair value hierarchy.
Loans Held for Investment
Loans held for investment is comprised primarily of seasoned reperforming residential mortgage loans. Loans held for investment also include jumbo prime, investor owned and business purpose loans.
Loans consisting of seasoned reperforming residential mortgage loans, jumbo prime loans and investor loans:
The Company estimates the fair value of its Loans held for investment consisting of seasoned reperforming residential mortgage loans, jumbo prime loans and investor loans on a loan by loan basis using an internally developed model which compares the loan held by the Company with a loan currently offered in the market. The loan price is adjusted in the model by considering the loan factors that would impact the value of a loan. These loan factors include loan coupon, FICO, loan-to-value ratios, delinquency history, owner occupancy, and property type, among other factors. A baseline is developed for each significant loan factor and adjusts the price up or down depending on how that factor for each specific loan compares to the baseline rate. Generally, the most significant impact on loan value is the loan coupon rate as compared to coupon rates currently available in the market and delinquency history.
The Company also monitors market activity to identify trades that may be used to compare internally developed prices. However, as the portfolio of loans held at fair value is a seasoned reperforming pool of residential mortgage loans, comparable loan pools are not common or directly comparable. There are limited transactions in the marketplace to develop a comprehensive direct range of values.
The Company reviews the fair values generated by the model to determine whether prices are reflective of the current market by corroborating its estimates of fair value by comparing the results to non-binding independent prices provided by an independent third-party pricing service for the loan portfolio. Each quarter the Company develops thresholds generally using market factors or other assumptions as appropriate.
If the internally developed fair values of the loan pools differ from the independent third-party prices by greater than the threshold for the period, the Company highlights these differences for further review, both internally and with the third-party pricing service. The Company obtains certain inputs used by the third-party pricing service and evaluates them for reasonableness. Then the Company updates its own model if the Company determines the third-party pricing inputs more accurately reflect the current market environment or observed information from the third-party vendor. If the Company believes that its internally developed inputs more accurately reflect the current market environment, it will request that the third-party pricing service review market factors that may not have been considered by the third-party pricing service. The Company reconciles and resolves all pricing differences in excess of the thresholds before a final price is established.
At December 31, 2025, two loan pools with internally developed fair values of $272 million had differences between the model generated prices and the third-party prices provided in excess of the threshold for the period. The internally developed prices were $17 million higher than the third-party prices provided of $255 million. After review and discussion, the Company affirmed and valued the investment at the higher internally developed prices. No other differences were noted at December 31, 2025 in excess of the threshold for the period. At December 31, 2024, four loan pools with internally developed fair values of $440 million had differences between the model generated prices and third-party prices provided in excess of the threshold for the period. The internally developed prices were $28 million higher on a net basis than the third-party prices provided of $412 million. After review and discussion, the Company affirmed and valued the investment at the higher internally developed prices. No other differences were noted at December 31, 2024 in excess of the threshold for the period.
The Company’s estimates of fair value of Loans held for investment involve judgment and assumptions that are deemed to be significant to the fair value measurement process, which renders the resulting fair value estimates Level 3 inputs in the fair value hierarchy.
Business purpose loans:
139
Business purpose loans are loans to businesses that are secured by real property that will be renovated by the borrower. Upon completion of the renovation the property will be either sold by the borrower or refinanced by the borrower who may subsequently sell or rent the property. Most, but not all, of the properties securing these loans are residential and a portion of the loan is used to cover renovation costs. The business purpose loans are included as a part of the Company's Loans held for investment portfolio and are carried at fair value with changes in fair value reflected in earnings. These loans tend to be short duration, often less than one year, and generally the coupon rate is higher than the Company's typical residential mortgage loans. As these loans are generally short-term in nature and there is an active market for these loans, the Company estimates fair value of the business purpose loans based on the recent purchase price of the loan, adjusted for observable market activity for similar assets offered in the market. Business purpose loans have a fair value of $75 million and $338 million as of December 31, 2025 and December 31, 2024, respectively.
As the fair value prices of the business purpose loans are based on the recent trades of similar assets in an active market, the Company has classified them as Level 2 in the fair value hierarchy.
Loans Held For Sale
LHFS are measured and reported at fair value. The Company’s fair value election for its LHFS is intended to more accurately reflect the underlying economics of the Company’s operations. With the election of the fair value option for LHFS, loan origination fees, and the related direct loan origination costs associated with the origination of LHFS, are earned and expensed as incurred, respectively.
Revenue derived from the Company’s mortgage lending activities includes certain fees collected at the time of origination and gain or loss from the sale of LHFS. Loan origination income reflects the fees earned, net of lender credits from originating the loans. These consist of fees related to loan origination, discount points, underwriting, processing and other fees. Lender credits typically are related to rebates or concessions for certain loan origination costs.
Gain or loss from the sale and mark-to-market of LHFS includes both realized and unrealized gains and losses and are included in Gain on origination and sale of loans, net, in the accompanying Consolidated Statements of Operations. The valuation of LHFS approximates a whole-loan sales value, which includes the value of the related mortgage servicing rights. When LHFS are sold, servicing rights are released.
The Company principally sells its LHFS to private investors. The Company evaluates its loan sales for sales treatment. To the extent the transfer of loans qualifies as a sale, the Company derecognizes the loans and records the gain or loss on the sale date. In the event the Company determines that the transfer of loans does not qualify as a sale, the transfer would be treated as a secured borrowing. Interest income from loans is recorded on the accrual basis. LHFS are placed on non-accrual status when any portion of the principal or interest is 90 days past due or earlier if factors indicate that the ultimate collectability of the principal or interest is not probable. Interest received from loans on non-accrual status is recorded as income when collected. Loans return to accrual status when the principal and interest become current, and it is probable that the amounts are fully collectible.
Loans held for sale are classified within Level 2 of the fair value hierarchy as their fair value is derived from quoted prices for similar instruments in active markets and other observable market-corroborated inputs.
Securitized Debt, collateralized by Loans Held for Investment
The process for determining the fair value of securitized debt, collateralized by Loans held for investment is based on discounted cash flows utilizing an internal pricing model that incorporates factors such as coupon, prepayment speeds, loan size, collateral composition, borrower characteristics, expected interest rates, life caps, periodic caps, reset dates, collateral seasoning, delinquencies, expected losses, expected default severity, credit enhancement, and other pertinent factors. This process, including the review process, is consistent with the process used for Agency MBS and Non-Agency RMBS using internal models. For further discussion of the valuation process and benchmarking process, see Agency MBS and Non-Agency RMBS discussion herein. The primary cause of the change in fair value is due to market demand and changes in credit risk of mortgage loans.
At December 31, 2025, one securitized debt collateralized by Loans held for investment position with an internally developed fair value of $3 million had a difference between the model generated price and the third-party price provided in excess of the threshold for the period. The internally developed price was $183 thousand higher than the third-party price provided of $3 million. After review and discussion, the Company affirmed and valued the investment at the higher internally developed price. No other differences were noted at December 31, 2025 in excess of the threshold for the period. At December 31, 2024, two securitized debt collateralized by Loans held for investment positions with internally developed fair values of $3 million
140
had differences between the model generated prices and third-party prices provided in excess of the threshold for the period. The internally developed prices were $355 thousand higher on a net basis than the third-party prices provided of $3 million. After review and discussion, the Company affirmed and valued the securitized debt positions at the higher internally developed prices. No other differences were noted at December 31, 2024 in excess of the threshold for the period.
The Company’s estimates of fair value of securitized debt, collateralized by Loans held for investment involve judgment and assumptions that are deemed to be significant to the fair value measurement process, which renders the resulting fair value estimates Level 3 inputs in the fair value hierarchy.
Securitized Debt, collateralized by Non-Agency RMBS
The Company carries securitized debt, collateralized by Non-Agency RMBS at the principal balance outstanding plus unamortized premiums, less unaccreted discounts recorded in connection with the financing of the loans or RMBS with third parties. For disclosure purposes, the Company estimates the fair value of securitized debt, collateralized by Non-Agency RMBS by estimating the future cash flows associated with the underlying assets collateralizing the secured debt outstanding. The Company models the fair value of each underlying asset by considering, among other items, the structure of the underlying security, coupon, servicer, delinquency, actual and expected defaults, actual and expected default severities, reset indices, and prepayment speeds in conjunction with market research for similar collateral performance and the Company's expectations of general economic conditions in the sector and other economic factors. This process, including the review process, is consistent with the process used for Agency MBS and Non-Agency RMBS using internal models. For further discussion of the valuation process and benchmarking process, see Agency MBS and Non-Agency RMBS discussion herein.
The Company’s estimates of fair value of securitized debt, collateralized by Non-Agency RMBS involve judgment and assumptions that are deemed to be significant to the fair value measurement process, which renders the resulting fair value estimates Level 3 inputs in the fair value hierarchy.
Fair value option
The table below shows the unpaid principal and fair value of the financial instruments carried at fair value with changes in fair value reflected in earnings under the fair value option election as of December 31, 2025 and December 31, 2024, respectively:
| December 31, 2025 | December 31, 2024 | ||||||||||||||||
| (dollars in thousands) | |||||||||||||||||
| Unpaid Principal/ Notional | Fair Value | Unpaid Principal/ Notional | Fair Value | ||||||||||||||
| Assets: | |||||||||||||||||
| Non-Agency RMBS | |||||||||||||||||
| Senior | $ | $ | $ | $ | |||||||||||||
| Subordinated | |||||||||||||||||
| Interest-only | |||||||||||||||||
| Agency RMBS | |||||||||||||||||
| Pass-through | |||||||||||||||||
| CMO | |||||||||||||||||
| Interest-only | |||||||||||||||||
| Agency CMBS | |||||||||||||||||
| Project loans | |||||||||||||||||
| Interest-only | |||||||||||||||||
| Loans held for investment, at fair value | |||||||||||||||||
| Loans held for sale, at fair value | |||||||||||||||||
| Interests in MSR financing receivables | |||||||||||||||||
Liabilities (1): | |||||||||||||||||
| Secured Financing Agreements, at fair value | |||||||||||||||||
| Securitized debt at fair value, collateralized by Loans held for investment | |||||||||||||||||
(1) The Company recorded $2 million unrealized loss for contingent earn-out liability as of December 31, 2025. The contingent earn-out liability balance is included in Accounts payable and other liabilities on the Company’s Consolidated Statements of Financial Condition.
141
The table below shows the impact of change in fair value on each of the financial instruments carried at fair value with changes in fair value reflected in earnings under the fair value option election in the Consolidated Statements of Operations for the years ended December 31, 2025 and 2024:
| For the Years Ended | ||||||||
| December 31, 2025 | December 31, 2024 | |||||||
| (dollars in thousands) | ||||||||
| Gain/(Loss) on Change in Fair Value | ||||||||
| Assets: | ||||||||
| Non-Agency RMBS | ||||||||
| Senior | $ | $ | ||||||
| Subordinated | ||||||||
| Interest-only | ( | |||||||
| Agency RMBS | ||||||||
| Pass-through | ||||||||
| CMO | ( | |||||||
| Interest-only | ( | |||||||
| Agency CMBS | ||||||||
| Project loans | ( | |||||||
| Interest-only | ( | ( | ||||||
| Loans held for investment, at fair value | ||||||||
| Loans held for sale, at fair value | N/A | |||||||
| Interests in MSR financing receivables | ( | N/A | ||||||
Liabilities: (1) | ||||||||
| Secured Financing Agreements, at fair value | ( | |||||||
| Securitized debt at fair value, collateralized by Loans held for investment | ( | ( | ||||||
Derivatives
Interest Rate Swaps and Swaptions
The Company uses clearing exchange market prices to determine the fair value of its exchange cleared interest rate swaps. For bilateral swaps, the Company determines the fair value based on the net present value of expected future cash flows on the swap. The Company uses an option-pricing model to determine the fair value of its swaptions. For bilateral swaps and swaptions, the Company compares its own estimate of fair value with counterparty prices to evaluate for reasonableness. Both the clearing exchange and counter-party pricing quotes incorporate common market pricing methods, including a spread measurement to the Treasury yield curve or interest rate swap curve as well as underlying characteristics of the particular contract. Interest rate swaps and swaptions are modeled by the Company by incorporating such factors as the term to maturity, swap curve, overnight index swap rates, and the payment rates on the fixed portion of the interest rate swaps. The Company has classified the characteristics used to determine the fair value of interest rate swaps and swaptions as Level 2 inputs in the fair value hierarchy.
Fair values of swaps with cancellable features are determined using valuation techniques appropriate for over‑the‑counter derivatives, including models incorporating observable market inputs (such as yield curves and volatility estimates) and, where observable inputs are not available, unobservable inputs, with resulting fair value measurements classified within the fair value hierarchy. This valuation is classified as Level 3 in the fair value hierarchy.
Treasury Futures
The fair value of Treasury futures is determined by quoted market prices in an active market. The Company has classified the characteristics used to determine the fair value of Treasury futures as Level 1 inputs in the fair value hierarchy.
Swap Futures
142
The fair value of Swap futures is determined using quoted settlement prices published by the ERIS Secured Overnight Financing Rate, which reflect observable market data for standardized CME-cleared contracts. The Company has classified the characteristics used to determine the fair value of Swap futures as Level 2 inputs in the fair value hierarchy.
Interest rate caps
The fair value of interest rate caps is determined using a discounted cash flow approach that considers the difference between the forward curve of the reference rate and the cap's strike rate. The expected future cash flows from each caplet are calculated and discounted to present value using observable market interest rates. The discounted cashflows contemplate both an intrinsic value based upon the strike rate in reference to the market reference rate as well as a time value based upon the implied volatility of the market reference rate forward curve projection. This valuation is based on market inputs and is classified as Level 2 in the fair value hierarchy.
Interest Rate Lock Commitments
The Company enters into interest rate lock commitments (“IRLCs”) with prospective borrowers to originate mortgage loans at a specified interest rate. These IRLCs are accounted for as derivative instruments. The fair values of IRLCs utilize current secondary market prices for the underlying loans and estimated servicing value with similar coupons, maturity and credit quality, estimated remaining direct expense and market adjusted investor discounts, subject to the anticipated loan funding probability (“Pull-through Rate”). The fair value of IRLCs is subject to change primarily due to changes in interest rates, credit spreads and the estimated Pull-through Rate. The Company reports IRLCs within Derivatives, at fair value, net, in the accompanying Consolidated Statements of Financial Condition with changes in fair value being recorded in the accompanying Consolidated Statements of Operations within Gain on origination and sale of loans, net.
The Company hedges the changes in fair value associated with changes in interest rates related to IRLCs and uncommitted LHFS by utilizing a combination of derivatives related to two-year and five-year U.S. Treasury futures for its Non-QM loans, and 30-year uniform mortgage-backed securities (“UMBS”) futures contracts for its FHA, VA, and Freddie Mac-insured loans (collectively the "Hedging Instruments") until committed to an investor. The Hedging Instruments are typically entered into at the time the IRLC is made. The fair value of Hedging Instruments is subject to change primarily due to changes in interest rates. The Company reports Hedging Instruments at fair value within Derivatives, at fair value, net, in the accompanying Consolidated Statements of Financial Condition with changes in fair value recorded in the accompanying Consolidated Statements of Operations within Gain on origination and sale of loans, net.
Secured Financing Agreements
Secured financing agreements for the investment portfolio are collateralized financing transactions utilized by the Company to acquire investment securities. For short term secured financing agreements and longer term floating rate secured financing agreements, the Company estimates fair value using the contractual obligation plus accrued interest payable. The Company has classified the characteristics used to determine the fair value of secured financing agreements as Level 2 inputs in the fair value hierarchy.
Secured Financing Agreements, at fair value
Fair value for certain secured financing agreements that are carried at fair value with changes in fair value reported in earnings are valued at the price that the Company would pay to transfer the liability to a market participant at the reporting date in an orderly transaction. The Company evaluates recent trades of financial liabilities made by the Company, which includes an element of non-performance risk, as well as changes in market interest rates to determine the fair value of the secured financing agreements. The primary factor in determining the fair value is the change in market interest rates from the transaction date of the secured financing agreements and the reporting date. As these rates are observable, the secured financing agreements are reported as Level 2 inputs in the fair value hierarchy.
Short-term Financial Instruments
The carrying value of cash and cash equivalents, accrued interest receivable, dividends payable, payable for investments purchased, and accrued interest payable are considered to be a reasonable estimate of fair value due to the short term nature and low credit risk of these short-term financial instruments.
143
Interests in MSR Financing Receivables
The Company classifies its Interests in MSR financing receivables as Level 3 in the fair value measurements hierarchy. Fair value estimates for these investments are obtained from models, which use significant unobservable inputs in their valuations. These valuations primarily utilize discounted cash flow models that incorporate unobservable market data inputs including interest rates, discount rates, and prepayment rates. Model valuations are then compared to valuations obtained from third party pricing providers. Management reviews the valuations received from third party pricing providers and uses them as a point of comparison to modeled values. The valuation of Interests in MSR financing receivables require significant judgment by management and the third party pricing providers. Assumptions used for which there is a lack of observable inputs may significantly impact the resulting fair value and therefore the Company’s consolidated financial statements.
The following tables set forth Interests in MSR financing receivables at fair value by level within the fair value hierarchy as of December 31, 2025.
| December 31, 2025 | ||||||||||||||
| (dollars in thousands) | ||||||||||||||
| Level 1 | Level 2 | Level 3 | Total | |||||||||||
Interests in MSR financing receivables | ||||||||||||||
Qualitative and Quantitative Information about Level 3 Fair Value Measurements
The Company considers unobservable inputs to be those for which market data is not available and that are developed using the best information available to us about the assumptions that market participants would use when pricing the asset. Relevant inputs vary depending on the nature of the instrument being measured at fair value. The sensitivities of significant unobservable inputs along with interrelationships between and among the significant unobservable inputs and their impact on the fair value measurements are described below. The effect of a change in a particular assumption in the sensitivity analysis below is considered independently from changes in any other assumptions. In practice, simultaneous changes in assumptions may not always have a linear effect on the inputs discussed below. Interrelationships may also exist between observable and unobservable inputs. Such relationships have not been included in the discussion below. For each of the individual relationships described below, the inverse relationship would also generally apply. For Interests in MSR financing receivables, in general, increases in the discount rate or prepayment rate in isolation would result in a lower fair value measurement. A decline in interest rates could lead to higher-than-expected prepayments of mortgages underlying the Company’s Interests in MSR financing receivables, which in turn could result in a decline in the estimated fair value of Interests in MSR financing receivables.
The table below presents information about the significant unobservable inputs used for recurring fair value measurements for Level 3 Interests in MSR financing receivables. The table does not give effect to the Company’s risk management practices that might offset risks inherent in these Level 3 investments.
| December 31, 2025 | ||||||||||||||
Discount Rate | Prepayment Rate | |||||||||||||
| Range | Weighted Average | Range | Weighted Average | |||||||||||
| Interests in MSR financing receivables | ||||||||||||||
Long term debt
The fair value of the Company's Senior Unsecured Notes is based upon prices obtained from third-party pricing services or broker quotations and are classified as Level 2.
Equity Method Investments
The Company has made investments in entities or funds. For these investments where the Company has a non-controlling interest; but are deemed to be able to exert significant influence over the affairs of these entities or funds, the Company utilizes the equity method of accounting. These investments are not carried at fair value. The carrying value of the Company's equity method investments is determined using cost accumulation method. The Company adjusts the carrying value of its equity method investments for its share of earnings or losses, dividends or return of capital on a quarterly basis. The fair value of equity method investments is based on the fund valuation received from the manager of the fund. The Company has classified the characteristics used to determine the fair value of equity method investments as Level 3 inputs in the fair value hierarchy. The equity method investments are included in Other assets on the Consolidated Statements of Financial Condition.
144
The Company’s financial assets and liabilities carried at fair value on a recurring basis, including the level in the fair value hierarchy, at December 31, 2025 and December 31, 2024 are presented below.
| December 31, 2025 | |||||||||||||||||
| (dollars in thousands) | |||||||||||||||||
| Level 1 | Level 2 | Level 3 | Counterparty and Cash Collateral, netting | Total | |||||||||||||
| Assets: | |||||||||||||||||
| Non-Agency RMBS, at fair value | $ | $ | $ | $ | — | $ | |||||||||||
| Agency MBS, at fair value | — | ||||||||||||||||
| Loans held for investment, at fair value | — | ||||||||||||||||
| Loans held-for-sale, at fair value | — | ||||||||||||||||
| Derivatives, at fair value | ( | ||||||||||||||||
| Liabilities: | |||||||||||||||||
| Secured Financing Agreement, at fair value | — | ||||||||||||||||
| Securitized debt at fair value, collateralized by Loans held for investment | — | ||||||||||||||||
| Derivatives, at fair value | |||||||||||||||||
| December 31, 2024 | |||||||||||||||||
| (dollars in thousands) | |||||||||||||||||
| Level 1 | Level 2 | Level 3 | Counterparty and Cash Collateral, netting | Total | |||||||||||||
| Assets: | |||||||||||||||||
| Non-Agency RMBS, at fair value | $ | $ | $ | $ | — | $ | |||||||||||
| Agency MBS, at fair value | — | ||||||||||||||||
| Loans held for investment, at fair value | — | ||||||||||||||||
| Derivatives, at fair value | ( | ||||||||||||||||
| Liabilities: | |||||||||||||||||
| Secured Financing Agreement, at fair value | — | ||||||||||||||||
| Securitized debt at fair value, collateralized by Loans held for investment | — | ||||||||||||||||
| Derivatives, at fair value | |||||||||||||||||
The table below provides a summary of the changes in the fair value of financial instruments classified as Level 3 at December 31, 2025 and December 31, 2024.
145
| Fair Value Level 3 Rollforward - Assets | ||||||||||||||||||||
| For the Year Ended | For the Year Ended | |||||||||||||||||||
| December 31, 2025 | December 31, 2024 | |||||||||||||||||||
| (dollars in thousands) | ||||||||||||||||||||
| Non-Agency RMBS | Interests in MSR Financing Receivables | Loans held for investment | Derivatives | Non-Agency RMBS | Loans held for investment | |||||||||||||||
| Beginning balance Level 3 | $ | $ | $ | $ | $ | $ | ||||||||||||||
| Transfers into Level 3 | ||||||||||||||||||||
| Transfers out of Level 3 | ||||||||||||||||||||
| Capital contribution | ||||||||||||||||||||
| Purchases of assets | ||||||||||||||||||||
| Principal payments | ( | ( | ( | ( | ||||||||||||||||
| Sales and Settlements | ( | ( | ( | |||||||||||||||||
| Servicer advances | ||||||||||||||||||||
| Net accretion (amortization) | ( | ( | ||||||||||||||||||
| Amortization of MSR loan pool | ( | |||||||||||||||||||
| Gains (losses) included in net income | ||||||||||||||||||||
| (Increase) decrease in provision for credit losses | ( | ( | ||||||||||||||||||
| Realized gains (losses) on sales and settlements | ( | ( | ||||||||||||||||||
| Interest income from investment in MSR financing receivables | ||||||||||||||||||||
| Net unrealized gains (losses) included in income | ( | ( | ( | |||||||||||||||||
| Total unrealized gains (losses) for the period | ( | ( | ||||||||||||||||||
| Ending balance Level 3 | $ | $ | $ | $ | $ | $ | ||||||||||||||
| Fair Value Level 3 Rollforward - Liabilities | ||||||||
| For the Year Ended | For the Year Ended | |||||||
| December 31, 2025 | December 31, 2024 | |||||||
| (dollars in thousands) | ||||||||
| Securitized Debt | Securitized Debt | |||||||
| Beginning balance Level 3 | $ | $ | ||||||
| Transfers into Level 3 | ||||||||
| Transfers out of Level 3 | ||||||||
| Transfer due to consolidation/deconsolidation | ||||||||
| Issuance of debt | ||||||||
| Principal payments | ( | ( | ||||||
| Sales and Settlements | ( | |||||||
| Net (accretion) amortization | ||||||||
| (Gains) losses included in net income | ||||||||
| Other than temporary credit impairment losses | ||||||||
| Realized (gains) losses on sales and settlements | ( | |||||||
| Net unrealized (gains) losses included in income | ||||||||
| Total unrealized (gains) losses for the period | ||||||||
| Ending balance Level 3 | $ | $ | ||||||
There were no
The significant unobservable inputs used in the fair value measurement of the Company’s Non-Agency RMBS and securitized debt are the weighted average discount rates, prepayment rate, constant default rate, and the loss severity. The significant unobservable inputs used in the fair value measurement of the Company’s IRLC are the pull-through rates.
146
The fair value amounts have been estimated by management using available market information and appropriate valuation methodologies. Considerable judgment is required to interpret market data to develop the estimates of fair value in both inactive and orderly markets. Accordingly, the estimates presented are not necessarily indicative of the amounts that could be realized in a current market exchange. The use of different market assumptions and/or estimation methodologies may have a material effect on the estimated fair value amounts.
Discount Rate
The discount rate refers to the interest rate used in the discounted cash flow analysis to determine the present value of future cash flows. The discount rate takes into account not just the time value of money, but also the risk or uncertainty of future cash flows. An increased uncertainty of future cash flows results in a higher discount rate. The discount rate used to calculate the present value of the expected future cash flows is based on the discount rate implicit in the security as of the last measurement date. As discount rates move up, the values of the discounted cash flows are reduced.
The discount rates applied to the expected cash flows to determine fair value are derived from a range of observable prices on securities backed by similar collateral. As the market becomes more or less liquid, the availability of these observable inputs will change.
Prepayment Rate
The prepayment rate specifies the percentage of the collateral balance that is expected to prepay at each point in the future. The prepayment rate is based on factors such as interest rates, loan-to-value ratio, debt-to-income ratio, and is scaled up or down to reflect recent collateral-specific prepayment experience as obtained from remittance reports and market data services.
Constant Default Rate
Constant default rate represents an annualized rate of default on a group of mortgages. The constant default rate, or CDR, represents the percentage of outstanding principal balances in the pool that are in default, which typically equates to the home being past 60-day and 90-day notices and in the foreclosure process. When default rates increase, expected cash flows on the underlying collateral decreases. When default rates decrease, expected cash flows on the underlying collateral increases.
Default vectors are determined from the current “pipeline” of loans that are more than 30 days delinquent, in foreclosure, bankruptcy, or are REO. These delinquent loans determine the first 30 months of the default curve. Beyond month 30, the default curve transitions to a value that is reflective of a portion of the current delinquency pipeline.
Loss Severity
Loss severity rates reflect the amount of loss expected from a foreclosure and liquidation of the underlying collateral in the mortgage loan pool. When a mortgage loan is foreclosed, the collateral is sold and the resulting proceeds are used to settle the outstanding obligation. In many circumstances, the proceeds from the sale do not fully repay the outstanding obligation. In these cases, a loss is incurred by the lender. Loss severity is used to predict how costly future losses are likely to be. An increase in loss severity results in a decrease in expected future cash flows. A decrease in loss severity results in an increase in expected future cash flows.
The curve generated to reflect the Company’s expected loss severity is based on collateral-specific experience with consideration given to other mitigating collateral characteristics. Collateral characteristics such as loan size, loan-to-value, seasoning or loan age and geographic location of collateral also effect loss severity.
Sensitivity of Significant Inputs – Non-Agency RMBS and securitized debt, collateralized by Loans held for investment
Prepayment rates vary according to interest rates, the type of financial instrument, conditions in financial markets, and other factors, none of which can be predicted with any certainty. In general, when interest rates rise, it is relatively less attractive for borrowers to refinance their mortgage loans, and as a result, prepayment speeds tend to decrease. When interest rates fall, prepayment speeds tend to increase. For RMBS investments purchased at a premium, as prepayment rates increase, the amount of income the Company earns decreases as the purchase premium on the bonds amortizes faster than expected. Conversely, decreases in prepayment rates result in increased income and can extend the period over which the Company amortizes the purchase premium. For RMBS investments purchased at a discount, as prepayment rates increase, the amount of income the Company earns increases from the acceleration of the accretion of the purchase discount into interest income. Conversely, decreases in prepayment rates result in decreased income as the accretion of the purchase discount into interest income occurs over a longer period.
147
For securitized debt carried at fair value issued at a premium, as prepayment rates increase, the amount of interest expense the Company recognizes decreases as the issued premium on the debt amortizes faster than expected. Conversely, decreases in prepayment rates result in increased expense and can extend the period over which the Company amortizes the premium.
For debt issued at a discount, as prepayment rates increase, the amount of interest the Company expenses increases from the acceleration of the accretion of the discount into interest expense. Conversely, decreases in prepayment rates result in decreased expense as the accretion of the discount into interest expense occurs over a longer period.
A summary of the significant inputs used to estimate the fair value of Level 3 Non-Agency RMBS held for investment at fair value as of December 31, 2025 and December 31, 2024 follows. The weighted average discount rates are based on fair value.
| December 31, 2025 | ||||||||||||||||||||||||||
| Significant Inputs | ||||||||||||||||||||||||||
| Discount Rate | Prepay Rate | CDR | Loss Severity | |||||||||||||||||||||||
| Range | Weighted Average | Range | Weighted Average | Range | Weighted Average | Range | Weighted Average | |||||||||||||||||||
| Non-Agency RMBS | ||||||||||||||||||||||||||
| Senior | ||||||||||||||||||||||||||
| Subordinated | ||||||||||||||||||||||||||
| Interest-only | ||||||||||||||||||||||||||
| December 31, 2024 | ||||||||||||||||||||||||||
| Significant Inputs | ||||||||||||||||||||||||||
| Discount Rate | Prepay Rate | CDR | Loss Severity | |||||||||||||||||||||||
| Range | Weighted Average | Range | Weighted Average | Range | Weighted Average | Range | Weighted Average | |||||||||||||||||||
| Non-Agency RMBS | ||||||||||||||||||||||||||
| Senior | ||||||||||||||||||||||||||
| Subordinated | ||||||||||||||||||||||||||
| Interest-only | ||||||||||||||||||||||||||
A summary of the significant inputs used to estimate the fair value of securitized debt at fair value, collateralized by Loans held for investment, as of December 31, 2025 and December 31, 2024 follows:
| December 31, 2025 | ||||||||||||||||||||||||||
| Significant Inputs | ||||||||||||||||||||||||||
| Discount Rate | Prepay Rate | CDR | Loss Severity | |||||||||||||||||||||||
| Range | Weighted Average | Range | Weighted Average | Range | Weighted Average | Range | Weighted Average | |||||||||||||||||||
| Securitized debt at fair value, collateralized by Loans held for investment | ||||||||||||||||||||||||||
| December 31, 2024 | ||||||||||||||||||||||||||
| Significant Inputs | ||||||||||||||||||||||||||
| Discount Rate | Prepay Rate | CDR | Loss Severity | |||||||||||||||||||||||
| Range | Weighted Average | Range | Weighted Average | Range | Weighted Average | Range | Weighted Average | |||||||||||||||||||
| Securitized debt at fair value, collateralized by Loans held for investment | ||||||||||||||||||||||||||
All of the significant inputs listed have some degree of market observability based on the Company’s knowledge of the market, information available to market participants, and use of common market data sources. Collateral default and loss severity projections are in the form of “curves” that are updated quarterly to reflect the Company’s collateral cash flow projections. Methods used to develop these projections conform to industry conventions. The Company uses assumptions it considers its best estimate of future cash flows for each security.
148
Sensitivity of Significant Inputs – Loans held for investment
The Loans held for investment are primarily comprised of loans collateralized by seasoned reperforming residential mortgages. Additionally, it includes non-conforming, single family, owner occupied, investor owned, and jumbo prime residential mortgages. The significant unobservable factors used to estimate the fair value of the Loans held for investment collateralized by seasoned reperforming residential mortgage loans, as of December 31, 2025 and December 31, 2024, include coupon, FICO score at origination, loan-to-value, or LTV ratios, owner occupancy status, and property type. A summary of the significant factors used to estimate the fair value of Loans held for investment collateralized primarily by seasoned reperforming residential mortgages at fair value as of December 31, 2025 and December 31, 2024 follows:
| December 31, 2025 | December 31, 2024 | ||||||||||
| Factor: | |||||||||||
| Coupon | |||||||||||
| Base Rate | |||||||||||
| Actual | |||||||||||
| FICO | |||||||||||
| Base Rate | |||||||||||
| Actual | |||||||||||
| Loan-to-value (LTV) | |||||||||||
| Base Rate | |||||||||||
| Actual | |||||||||||
| Loan Characteristics: | |||||||||||
| Occupancy | |||||||||||
| Owner Occupied | |||||||||||
| Investor | |||||||||||
| Secondary | |||||||||||
| Property Type | |||||||||||
| Single family | |||||||||||
| Manufactured housing | |||||||||||
| Multi-family/mixed use/other | |||||||||||
The loan factors are generally not observable for the individual loans and the base rates developed by the Company’s internal model are subjective and change as market conditions change. The impact of the loan coupon on the value of the loan is dependent on the loan history of delinquent payments. A loan with no history of delinquent payments would result in a higher overall value than a loan which has a history of delinquent payments. Similarly, a higher FICO score and a lower LTV ratio results in increases in the fair market value of the loan and a lower FICO score and a higher LTV ratio results in a lower value. See Note 4 for delinquency details for the Loans held for investment portfolio.
Property types also affect the overall loan values. Property types include single family, manufactured housing and multi-family/mixed use and other types of properties. Single family homes represent properties that house one to four family units. Manufactured homes include mobile homes and modular homes. Loan value for properties that are investor or secondary homes have a reduced value as compared to the baseline loan value. Additionally, single family homes will result in an increase to the loan value, whereas manufactured and multi-family/mixed use and other properties will result in a decrease to the loan value, as compared to the baseline.
Sensitivity of Significant Inputs for IRLC - Pull-through Rates
Interest rate lock commitments do not trade in an active market. Accordingly, the Company estimates the fair value of IRLCs based on the price an investor would be expected to pay to acquire such commitments, using current secondary market pricing for mortgage loans with similar characteristics.
The valuation incorporates observable market inputs, including loan type, underlying loan balance, borrower credit score, loan-to-value ratio, note rate, loan program, expected loan sale date, and prevailing market conditions. The estimated fair value is
149
adjusted at the individual loan level to reflect the servicing release premium, investor-specific pricing adjustments applicable to each loan, and the estimated direct costs required to convert the IRLC into a funded loan.
The resulting base value is further adjusted for the anticipated pull-through rate, which represents the probability that a locked loan will ultimately fund. The anticipated pull-through rate is an unobservable input derived from the Company’s historical funding experience and current pipeline characteristics. An increase in the anticipated pull-through rate results in an increase in the estimated fair value of IRLCs, while a decrease in the anticipated pull-through rate results in a decrease in estimated fair value. Due to the significance of this unobservable input, IRLCs are classified as Level 3 within the fair value hierarchy.
| December 31, 2025 | ||||||||||||||||||||||||||||||||
| (dollars in thousands) | ||||||||||||||||||||||||||||||||
| Financial Instrument | Estimated Fair Value | Valuation Technique | Unobservable Input | Range of Inputs | Weighted Average | |||||||||||||||||||||||||||
| Derivative assets - IRLCs | $ | Market Pricing | Pull-through Rate | % | ||||||||||||||||||||||||||||
Financial instruments not carried at fair value
The following table presents the carrying value and fair value, as described above, of the Company’s financial instruments not carried at fair value on a recurring basis at December 31, 2025 and December 31, 2024.
| December 31, 2025 | |||||||||||
| (dollars in thousands) | |||||||||||
| Level in Fair Value Hierarchy | Carrying Amount | Fair Value | |||||||||
Equity method investments (1) | 3 | $ | $ | ||||||||
| Secured financing agreements | 2 | ||||||||||
| Securitized debt, collateralized by Non-Agency RMBS | 3 | ||||||||||
| Long term debt | 2 | ||||||||||
(1) Included in Other assets on the Consolidated Statements of Financial Condition
| December 31, 2024 | |||||||||||
| (dollars in thousands) | |||||||||||
| Level in Fair Value Hierarchy | Carrying Amount | Fair Value | |||||||||
Equity method investments (1) | 3 | $ | $ | ||||||||
| Secured financing agreements | 2 | ||||||||||
| Securitized debt, collateralized by Non-Agency RMBS | 3 | ||||||||||
| Long term debt | 2 | ||||||||||
(1) Included in Other assets on the Consolidated Statements of Financial Condition
7. Secured Financing Agreements
Secured financing agreements include short-term repurchase agreements with original maturity dates of less than one year, long-term financing agreements with original maturity dates of more than one year, loan warehouse credit facilities collateralized by loans acquired by the Company that are classified as repurchase agreements, and loan warehouse credit facilities used to fund, and secured by, the residential mortgage loans originated by the Company which are classified as loans held-for-sale. The Company accounts for repurchase agreements and other similar collateralized financing arrangements as secured borrowings. Under its repurchase agreements and other forms of collateralized financing, the Company pledges financial assets as collateral to secure the related borrowings, generally in an amount equal to a specified percentage of the fair value of the pledged assets. The Company retains beneficial ownership of the pledged assets, including the right to receive principal and interest cash flows, subject to the terms of the respective agreements.
At December 31, 2025 and December 31, 2024, the repurchase agreements are collateralized by Agency and Non-Agency mortgage-backed securities with interest rates generally indexed to the Secured Overnight Financing Rate (“SOFR”). The
150
maturity dates on the repurchase agreements are all less than one year and generally are less than 180 days. The collateral pledged as security on the repurchase agreements may include the Company’s investments in bonds issued by consolidated VIEs, which are eliminated in consolidation.
The long-term financing agreements include secured financing arrangements with an original term of one year or greater which is secured by Non-Agency RMBS pledged as collateral. These long-term secured financing agreements have maturity dates of July 2026 and February 2027. The collateral pledged as security on the long-term financing agreements may include the Company’s investments in bonds issued by consolidated VIEs, which are eliminated in consolidation.
The warehouse credit facilities collateralized by loans are repurchase agreements intended to finance loans until they can be sold into a longer-term securitization structure. The maturity dates on the warehouse credit facilities range from three months to one year with interest rates indexed to SOFR.
The secured financing agreements generally require the Company to post collateral at a specific rate in excess of the unpaid principal balance of the agreement. For certain secured financing agreements, this may require the Company to post additional margin if the fair value of the assets were to drop. To mitigate this risk, the Company has negotiated several long-term financing agreements which are not subject to additional margin requirements upon a drop in the fair value of the collateral pledged or until the drop is greater than a threshold. At December 31, 2025 and December 31, 2024, the Company had $890 million and $853 million, respectively, of secured financing agreements that are not subject to additional margin requirements upon a change in the fair value of the collateral pledged. At December 31, 2025 and December 31, 2024, the Company had $402 million and $512 million, respectively, of secured financing agreements that are not subject to additional margin requirements until the drop in the fair value of collateral is greater than a threshold. Repurchase agreements may allow the credit counterparty to avoid the automatic stay provisions of the Bankruptcy Code, in the event of a bankruptcy of the Company, and take possession of, and liquidate, the collateral under such repurchase agreements without delay.
At December 31, 2025 and December 31, 2024, the Company pledged $17 4.4 %, Agency CMBS was 5.4 %, Loans-held for sale was 7.3 % and Non-Agency RMBS and Loans held for investment was 27.1 %. At December 31, 2024, the weighted average haircut on the Company's secured financing agreements collateralized by Agency RMBS was 5.1 %, Agency CMBS was 5.5 % and Non-Agency RMBS and Loans held for investment was 26.0 %.
At December 31, 2025, the Company had amounts at risk with Nomura Securities International, Inc., or Nomura, of 18 % of its equity related to the collateral posted on secured financing agreements. The weighted average maturities of the secured financing agreements with Nomura were 287 days. The amount at risk with Nomura was $459 million. At December 31, 2024, the Company had amounts at risk with Nomura of 20 % of its equity related to the collateral posted on secured financing agreements. The weighted average maturities of the secured financing agreements with Nomura were 108 days. The amount at risk with Nomura was $512 million.
Investment Portfolio Covenants
Certain of the long-term financing agreements and warehouse credit facilities are subject to certain covenants. These covenants include that the Company maintain its REIT status as well as maintain a net asset value or GAAP equity greater than a certain level. If the Company fails to comply with these covenants at any time, the financing may become immediately due in full. Additionally, certain financing agreements become immediately due if the total stockholders' equity of the Company drops by 50 % from the most recent year end. Currently, the Company is in compliance with all covenants and does not expect to fail to comply with any of these covenants within the next twelve months. The Company has a total of $2.4 billion unused uncommitted warehouse credit facilities as of December 31, 2025.
Residential Origination Covenants
The Residential Origination segment has seven warehouse financing facilities under Master Repurchase Agreements (“MRA”) with various lenders. These warehouse facilities are used to fund, and are secured by, the residential mortgage loans originated by the Company which are classified as loans held-for-sale. Two of the MRAs required the establishment of the LLCs to facilitate the warehouse fundings. These LLCs are consolidated as part of the Company’s consolidated financial statements. The Master Repurchase Agreements contain various affirmative, negative, and financial covenants. The covenants include leverage restrictions, minimum levels of liquidity and net worth, and profitability. The Company was in compliance with these covenants as of December 31, 2025. These financing agreements are non-recourse to the Company's other segments and operations, and do not contain cross-default or cross-collateralization provisions.
151
The secured financing agreements principal outstanding, weighted average borrowing rates, weighted average remaining maturities, average balances and the fair value of the collateral pledged as of December 31, 2025 and December 31, 2024 were:
| December 31, 2025 | December 31, 2024 | |||||||
| Secured financing agreements outstanding principal secured by: | ||||||||
| Agency RMBS (in thousands) | $ | $ | ||||||
| Agency CMBS (in thousands) | ||||||||
| Loans held for sale | N/A | |||||||
Non-Agency RMBS and Loans held for investment (in thousands) (1) | ||||||||
| Total | $ | $ | ||||||
| MBS pledged as collateral at fair value on Secured financing agreements: | ||||||||
| Agency RMBS (in thousands) | $ | $ | ||||||
| Agency CMBS (in thousands) | ||||||||
| Loans held for sale | N/A | |||||||
| Non-Agency RMBS and Loans held for investment (in thousands) | ||||||||
| Total | $ | $ | ||||||
| Average balance of Secured financing agreements secured by: | ||||||||
| Agency RMBS (in thousands) | $ | $ | ||||||
| Agency CMBS (in thousands) | ||||||||
| Loans held for sale | N/A | |||||||
| Non-Agency RMBS and Loans held for investment (in thousands) | ||||||||
| Total | $ | $ | ||||||
| Average borrowing rate of Secured financing agreements secured by: | ||||||||
| Agency RMBS | % | % | ||||||
| Agency CMBS | % | % | ||||||
| Loans held for sale | % | N/A | ||||||
| Non-Agency RMBS and Loans held for investment | % | % | ||||||
| Average remaining maturity of Secured financing agreements secured by: | ||||||||
| Agency RMBS | | |||||||
| Agency CMBS | | |||||||
| Loans held for sale | N/A | |||||||
| Non-Agency RMBS and Loans held for investment | | |||||||
| Average original maturity of Secured financing agreements secured by: | ||||||||
| Agency RMBS | | |||||||
| Agency CMBS | | |||||||
| Loans held for sale | N/A | |||||||
| Non-Agency RMBS and Loans held for investment | | |||||||
(1) The values for secured financing agreements in the table above is net of $271 thousand of deferred financing costs as of December 31, 2025.
At December 31, 2025 and December 31, 2024, the secured financing agreements collateralized by MBS and Loans held for investment had the following remaining maturities and borrowing rates.
152
| December 31, 2025 | December 31, 2024 | ||||||||||||||||||||||
| (dollars in thousands) | |||||||||||||||||||||||
Principal (1) | Weighted Average Borrowing Rates | Range of Borrowing Rates | Principal | Weighted Average Borrowing Rates | Range of Borrowing Rates | ||||||||||||||||||
| Overnight | $ | N/A | N/A | $ | N/A | N/A | |||||||||||||||||
| 1 to 29 days | |||||||||||||||||||||||
| 30 to 59 days | |||||||||||||||||||||||
| 60 to 89 days | |||||||||||||||||||||||
| 90 to 119 days | |||||||||||||||||||||||
| 120 to 180 days | |||||||||||||||||||||||
| 180 days to 1 year | |||||||||||||||||||||||
| 1 to 2 years | N/A | N/A | |||||||||||||||||||||
| 2 to 3 years | |||||||||||||||||||||||
| Total | $ | $ | |||||||||||||||||||||
(1) The values for secured financing agreements in the table above is net of $271 thousand of deferred financing costs as of December 31, 2025.
Secured Financing Agreements at fair value
8. Securitized Debt
All of the Company’s securitized debt is collateralized by residential mortgage loans or Non-Agency RMBS. For financial reporting purposes, the Company’s securitized debt is accounted for as secured borrowings. Thus, the residential mortgage loans or RMBS held as collateral are recorded in the assets of the Company as Loans held for investment or Non-Agency RMBS and the securitized debt is recorded as a non-recourse liability in the accompanying Consolidated Statements of Financial Condition.
Securitized Debt Collateralized by Non-Agency RMBS
At December 31, 2025 and December 31, 2024, the Company’s securitized debt collateralized by Non-Agency RMBS was carried at amortized cost and had a principal balance of $110 6.7
The Company did not acquire any securitized debt collateralized by Non-Agency RMBS during the year ended December 31, 2025 and 2024.
The following table presents the estimated principal repayment schedule of the securitized debt collateralized by Non-Agency RMBS at December 31, 2025 and December 31, 2024, based on expected cash flows of the residential mortgage loans or RMBS, as adjusted for projected losses on the underlying collateral of the debt. All of the securitized debt recorded in the Company’s Consolidated Statements of Financial Condition is non-recourse to the Company.
153
| December 31, 2025 | December 31, 2024 | |||||||
| (dollars in thousands) | ||||||||
| Within One Year | $ | $ | ||||||
| One to Three Years | ||||||||
| Three to Five Years | ||||||||
| Greater Than Five Years | ||||||||
| Total | $ | $ | ||||||
Maturities of the Company’s securitized debt collateralized by Non-Agency RMBS are dependent upon cash flows received from the underlying collateral. The estimate of their repayment is based on scheduled principal payments on the underlying collateral. This estimate will differ from actual amounts to the extent prepayments or losses are experienced. See Note 3 for a more detailed discussion of the securities collateralizing the securitized debt.
Securitized Debt Collateralized by Loans Held for Investment
At December 31, 2025 and December 31, 2024, the Company’s securitized debt collateralized by Loans held for investment had a principal balance of $7.1 billion and $7.6 billion, respectively. At December 31, 2025 and December 31, 2024, the total securitized debt collateralized by Loans held for investment carried a weighted average coupon of 3.7 % and 3.5 %, respectively. As of December 31, 2025, the maturities of the debt range between the years 2038 and 2099.
During the year ended December 31, 2025, the Company acquired securitized debt collateralized by Loans held for investment with an amortized cost balance of $384 million for $382 million. These transactions resulted in net gain on extinguishment of debt of $2 million. The Company did not acquire any securitized debt collateralized by loans held for investment during the year ended December 31, 2024.
The following table presents the estimated principal repayment schedule of the securitized debt collateralized by Loans held for investment at December 31, 2025 and December 31, 2024, based on expected cash flows of the residential mortgage loans or RMBS, as adjusted for projected losses on the underlying collateral of the debt. All of the securitized debt recorded in the Company’s Consolidated Statements of Financial Condition is non-recourse to the Company.
| December 31, 2025 | December 31, 2024 | |||||||
| (dollars in thousands) | ||||||||
| Within One Year | $ | $ | ||||||
| One to Three Years | ||||||||
| Three to Five Years | ||||||||
| Greater Than Five Years | ||||||||
| Total | $ | $ | ||||||
Maturities of the Company’s securitized debt collateralized by Loans held for investment are dependent upon cash flows received from the underlying loans. The estimate of their repayment is based on scheduled principal payments on the underlying loans. This estimate will differ from actual amounts to the extent prepayments or loan losses are experienced. See Note 4 for a more detailed discussion of the loans collateralizing the securitized debt.
Certain of the securitized debt collateralized by Loans held for investment contain call provisions at the option of the Company at a specific date. Other securitized debt issued by the Company contain clean-up call provisions. A clean-up call provision is a right to call the outstanding debt at pre-defined terms when the collateral falls below a certain percentage of the original balance, typically 10%. Generally, these clean-up call rights are shared with other parties to the debt, including the loan servicers and the paying agents. Clean-up calls are generally put in place to reduce the administrative burdens when a loan pool balance becomes de minimis hence uneconomical to manage. The following table presents the par value of the callable debt by year as of December 31, 2025, excluding any debt issued by the Company where the Company only has a clean-up call.
154
| December 31, 2025 | |||||
| (dollars in thousands) | |||||
| Year | Principal | ||||
| Currently callable | $ | ||||
| 2026 | |||||
| 2027 | |||||
| 2028 | |||||
| Total | $ | ||||
9. Long Term Debt
Senior Notes
On May 22, 2024, the Company completed its registered underwritten public offering of $65 million aggregate principal amount of 9.00 % senior notes due 2029 (the “9.00 % Notes”). The 9.00 % Notes were issued at 100 % of the principal amount, bear interest at a rate equal to 9.00 % per year, payable in cash on a quarterly basis, and are expected to mature on May 15, 2029. After deducting the underwriting discount and other debt issuance costs, the Company received approximately $62 million.
On August 12, 2024, the Company completed its registered underwritten public offering of $65 million aggregate principal amount of 9.25 % senior notes due 2029 (the “9.25 % Notes”). The 9.25 % Notes were issued at 100 % of the principal amount, bear interest at a rate equal to 9.25 % per year, payable in cash on a quarterly basis, and are expected to mature on August 15, 2029. Pursuant to the underwriting agreement, the Company also granted the underwriters a 30-day option to purchase up to an additional $10 million aggregate principal amount of the 9.25 % Notes to cover over-allotments, which was fully exercised by the underwriters. The Company issued $75 million of total principal amount under this offering and after deducting the underwriting discount and other debt issuance costs, the Company received approximately $72 million.
On September 16, 2025, the Company completed a registered underwritten public offering of $120 million (including $5 million from the exercise of an over-allotment option) aggregate principal amount of 8.875 % Senior Notes due 2030 (the “8.875 % Notes”). The 8.875 % Notes were issued at 100 % of the principal amount, bear interest at a rate equal to 8.875 % per year, payable in cash on a quarterly basis, and are expected to mature on August 15, 2030. The Company issued $120 million of total principal amount under this offering and after deducting the underwriting discount and other debt issuance costs, the Company received approximately $116 million.
At December 31, 2025, the outstanding principal amount of these notes was $260 million and the accrued interest payable on this debt was $3 million. At December 31, 2025, the unamortized deferred debt issuance cost was $8 million. The net interest expense was $17 million for the year ended December 31, 2025. At December 31, 2024, the outstanding principal amount of these notes was $140 million and the accrued interest payable on this debt was $2 million. At December 31, 2024, the unamortized deferred debt issuance cost was $5 million. The net interest expense was $7 million for the year ended December 31, 2024. The unamortized deferred debt issuance costs will be amortized until maturity, which will be no later than May 15, 2029, August 15, 2029, and August 15, 2030 for the 9.00 % Notes, 9.25 % Notes, and 8.875 % Notes, respectively.
10. Consolidated Securitization Vehicles and Other Variable Interest Entities
Since its inception, the Company has utilized VIEs for the purpose of securitizing whole mortgage loans or re-securitizing RMBS and obtaining long-term, non-recourse financing. The Company evaluated its interest in each VIE to determine if it is the primary beneficiary.
During the year ended December 31, 2025, the Company consolidated approximately $934 million unpaid principal balance of seasoned reperforming residential mortgage loans. During the year ended December 31, 2024, the Company consolidated approximately $468
VIEs for Which the Company is the Primary Beneficiary
The retained beneficial interests in VIEs for which the Company is the primary beneficiary are typically the subordinated tranches of these securitizations and in some cases the Company may hold interests in additional tranches. Additionally, the Company owns variable interests in entities that invest in Interests in MSR financing receivables. These entities are VIEs because they do not have sufficient equity at risk to finance their activities and the Company has the right to direct the activities of the VIE that most significantly impact its economic performance and hold substantially all of the variable interests in the
155
entities. The table below reflects the assets and liabilities recorded in the Consolidated Statements of Financial Condition related to the consolidated VIEs as of December 31, 2025 and December 31, 2024.
| December 31, 2025 | December 31, 2024 | |||||||
| (dollars in thousands) | ||||||||
| Assets: | ||||||||
Non-Agency RMBS, at fair value (1) | $ | $ | ||||||
| Loans held for investment, at fair value | ||||||||
| Accrued interest receivable | ||||||||
| Other assets | ||||||||
| Interests in MSR financing receivables | ||||||||
| Total Assets: | $ | $ | ||||||
| Liabilities: | ||||||||
| Securitized debt, collateralized by Non-Agency RMBS | $ | $ | ||||||
| Securitized debt at fair value, collateralized by Loans held for investment | ||||||||
| Accrued interest payable | ||||||||
| Other liabilities | ||||||||
| Total Liabilities: | $ | $ | ||||||
(1) December 31, 2025 and December 31, 2024 balances includes allowance for credit losses of $17 million and $10 million, respectively.
Income and expense amounts related to consolidated VIEs recorded in the Consolidated Statements of Operations is presented in the tables below.
| For the Years Ended | |||||||||||
| December 31, 2025 | December 31, 2024 | December 31, 2023 | |||||||||
| (dollars in thousands) | |||||||||||
| Interest income, Assets of consolidated VIEs | $ | $ | $ | ||||||||
| Interest expense, Non-recourse liabilities of VIEs | ( | ||||||||||
| Net interest income | $ | $ | $ | ||||||||
| Increase (decrease) in provision for credit losses | $ | $ | $ | ( | |||||||
| Interest income from investment in MSR financing receivable | $ | $ | $ | ||||||||
| Servicing fees | $ | $ | $ | ||||||||
VIEs for Which the Company is Not the Primary Beneficiary
The Company is not required to consolidate VIEs in which it has concluded it does not have a controlling financial interest, and thus is not the primary beneficiary. In such cases, the Company does not have both the power to direct the entities’ most significant activities, such as rights to replace the servicer without cause, and the obligation to absorb losses or right to receive benefits that could potentially be significant to the VIEs. The Company’s investments in these unconsolidated VIEs are carried in Non-Agency RMBS on the Consolidated Statements of Financial Condition and include senior and subordinated bonds issued by the VIEs.
156
11. Interests in MSR Financing Receivables
The Company does not hold the requisite licenses to purchase or hold MSRs directly. Therefore, the Company entered into purchase agreements to acquire base and excess servicing compensation rights, known as MSRs, associated with a $6.5 billion portfolio of mortgage loans from a licensed, GSE-approved residential mortgage loan servicer, which enables the Company to garner the economic return of an investment in an MSR purchased by the mortgage servicing counterparty through an MSR financing transaction. The Company, through its wholly-owned subsidiary, entered into a Reference Spread Agreement for Agency Loans (“RESPA”) to purchase the base servicing fee on the mortgage servicing loans at a rate of 12.5 basis points less the cost of servicing and other ancillary fees and income. In addition, the Company, through a consolidated VIE, purchased an interest in the true excess servicing fees (“ESS”) from the mortgage servicing counterparty as outlined by a true excess spread agreement (“TESPA”). Under the terms of the TESPA, the Company (i) purchased the “excess servicing spread” from the mortgage servicing counterparty, entitling the Company to monthly distributions of the servicing fees collected by the mortgage loan servicer in excess of 12.5 basis points per annum (and to distributions of corresponding proceeds from the sale of the MSRs), and (ii) will fund the balance of the MSR purchase price to the parent company of the mortgage loan servicer and, in exchange, has an unsecured right to payment of certain amounts determined by reference to the MSR, generally equal to the servicing fee revenue less the ESS and the costs of servicing (and to distributions of corresponding proceeds from the sale of the MSRs).
As a means to increase potential returns to the Company, at the Company’s election, it can request the mortgage servicing counterparty to utilize leverage on the MSRs to which the Company’s MSR financing receivables are referenced, or to finance the purchase of additional MSRs. As of December 31, 2025, the Company’s counterparty had drawn $58.5 million of financing secured by the MSRs to which the Company’s interests in MSRs are referenced.
The Company accounts for transactions executed under its arrangement with the mortgage servicing counterparty as financing transactions and reflects the associated financing receivables in the line item “Interests in MSR financing receivables” on its Consolidated Statements of Financial Condition. The Company has elected to account for its Interests in MSR financing receivables at fair value with changes in fair value that are not attributed to interest income recognized as a component of “Net unrealized gains on financial instruments at fair value” in the accompanying Consolidated Statements of Operations. Recurring servicing fees, ancillary income, recapture income, and float earnings associated with MSRs are recognized on a cash basis when received. The Company will record the income related to distributions (cash received) as “Interest income from investment in MSR financing receivables, net” in the accompanying Consolidated Statements of Operations. The Company recognized interest income from investment in MSR financing receivables, net, of $520 thousand for the year ended December 31, 2025.
As of December 31, 2025, the fair value of the Company’s interests in MSR financing receivables was $37 million. The following table presents activity related to the carrying value of the Company’s investments in MSR financing receivables for the periods indicated:
| For the Year Ended | |||||
| December 31, 2025 | |||||
| (dollars in thousands) | |||||
| Balance at period beginning | $ | ||||
| Purchases | |||||
| Capital distribution | |||||
| Interest income from investment in MSR financing receivables | |||||
| Amortization of MSR loan pool | ( | ||||
| Changes in unrealized gains (losses) | ( | ||||
| Servicer advances | |||||
| Balance at period end | $ | ||||
12. Derivative Instruments
In connection with the Company’s interest rate risk strategy, the Company may economically hedge a portion of its interest rate risk by entering into derivative financial instrument contracts in the form of interest rate swaps, swaptions, U.S. Treasury futures, Swap futures and interest rate caps. Swaps are used to lock in a fixed rate related to a portion of the Company's current and anticipated payments on secured financing agreements. The Company typically agrees to pay a fixed rate of interest, or pay rate, in exchange for the right to receive a floating rate of interest, or receive rate, over a specified period of time. Interest rate swaptions provide the option to enter into an interest rate swap agreement for a predetermined notional amount, stated term and pay and receive interest rates in the future. The Company’s swaptions are not centrally cleared. U.S. Treasury futures are
157
derivatives that track the prices of generic benchmark U.S. Treasury securities with identical maturity and are traded on an active exchange. It is generally the Company’s policy to close out any U.S. Treasury futures positions prior to delivering the underlying security. U.S. Treasury futures lock in a fixed rate related to a portion of its current and anticipated payments on its secured financing agreements. Swap futures are exchange-traded contracts that mirror the economics of an interest rate swap, where one party pays a fixed rate and the other pays a floating rate based on the SOFR. Swap futures are marked-to-market daily, with prices published by the CME Group. Interest rate caps are used to protect against undesirable movement in a floating interest rate related to a portion of the Company’s current and anticipated payments on secured financing arrangements. interest rate caps act as a hedge against rising floating interest rates, with the Company purchasing interest rate caps for a set term and defined strike rate relative to a market reference rate such as SOFR.
The Company’s derivatives are recorded as either assets or liabilities on the Consolidated Statements of Financial Condition and measured at fair value. These derivative financial instrument contracts are not designated as hedges for GAAP; therefore, all changes in fair value are recognized in earnings. The Company elects to net the fair value of its derivative contracts by counterparty when appropriate. These contracts contain legally enforceable provisions that allow for netting or setting off of all individual derivative receivables and payables with each counterparty and therefore, the fair values of those derivative contracts are reported net the counterparty.
The use of derivatives creates exposure to credit risk relating to potential losses that could be recognized if the counterparties to these instruments fail to perform their obligations under the contracts. In the event of a default by the counterparty, the Company could have difficulty obtaining its RMBS or cash pledged as collateral for these derivative instruments. The Company periodically monitors the credit profiles of its counterparties to determine if it is exposed to counterparty credit risk. See Note 17 for further discussion of counterparty credit risk.
The Company enters into IRLCs with prospective borrowers to originate mortgage loans at a specified interest rate. The estimated fair value of the Company’s IRLCs was $4 million as of December 31, 2025. Total gains, inclusive of both realized and unrealized amounts, is included in the Company’s Gain on origination and sale of loans, net, within the accompanying Consolidated Statements of Operations.
Interest Rate Swaps
The weighted average pay rate on the Company’s interest rate swaps at December 31, 2025 was 3.44 % and the weighted average receive rate was 3.87 %. At December 31, 2025, the weighted average maturity on the Company’s interest rate swaps was less than 6 years. During the year ended December 31, 2025, the Company had net realized losses of $26 million related to the interest rate swaps.
The weighted average pay rate on the Company’s interest rate swaps at December 31, 2024 was 3.56 % and the weighted average receive rate was 4.49 %. At December 31, 2024, the weighted average maturity on the Company’s interest rate swaps was less than one year .
The Company had net realized losses of 26 million related to swap terminations during the year ended December 31, 2025. The Company had a realized loss of $17 million related to the maturity of one swap during the year ended December 31, 2024.
Swap Futures
During the year ended December 31, 2025, the Company had Swap futures with a notional of $340 million. The Company had net realized losses of $2 million related to swap futures terminations during the year ended December 31, 2025. The Company did not have any Swap futures during the year ended December 31, 2024.
Swaptions
During the year ended December 31, 2025, the Company had swaptions with a notional of $600 million. The Company had net realized losses of $6 million related to swaptions during the year ended December 31, 2025. During the year ended December 31, 2024, the Company exercised three swaption contracts, each with $500 million notional, and entered into three one-year swaps, each with $500 million notional and a weighted average fixed pay rate of 3.56 %. During the year ended December 31, 2024, the Company did not have any swaption terminations.
Interest Rate Cap
During the year ended December 31, 2025, the Company entered into an interest rate cap. The Company paid $7 million for a $1.0 billion notional two-year interest rate cap with a strike rate of 3.95 % on SOFR as the market reference rate. At December 31, 2024, the Company held no interest rate caps.
Treasury Future Contracts
158
For the Investment Portfolio segment, during the year ended December 31, 2025, the Company covered its open short position of 1,000 two-year U.S. Treasury Futures contracts for a net realized gain of $82 thousand.
For the Investment Portfolio segment, during the year ended December 31, 2024, the Company entered into 1,391 short 5-year and 1,684 short 5-year U.S. Treasury futures contract with a notional of $139 million and $168 million, respectively, which it subsequently covered for a net realized loss of $5 million. Additionally, the Company covered and reopened their existing open 2-year U.S Treasury futures contract position for a realized gain of $641 thousand. The Company is short 1,000 2-year U.S. Treasury futures contract at December 31, 2024.
For the Residential Origination segment, during the year ended December 31, 2025, the Company entered into 360 short 5-year and 1,400 short 2-year U.S. Treasury futures contract with notional amounts of $36 million and $280 million respectively, which it subsequently covered for net realized gain of $31 thousand. The Company is short 197 5-year and 765 2-year U.S. Treasury futures contracts at December 31, 2025.
Interest Rate Lock Commitments
For the Residential Origination segment, the Company enters into IRLCs with prospective borrowers to originate mortgage loans at a specified interest rate. At December 31, 2025, the notional amount of the locked pipeline was $200 million with a fair value of $4 million.
The Company also maintains collateral in the form of cash margin from its counterparties to its derivative contracts. In accordance with the Company's netting policy, the Company presents the fair value of its derivative contracts net of cash margin received. See Note 17 for additional details on derivative netting.
The table below summarizes the location and fair value of the derivatives reported in the Consolidated Statements of Financial Condition after counterparty netting and posting of cash collateral as of December 31, 2025 and December 31, 2024.
| December 31, 2025 | ||||||||||||||||||||||||||
| Derivative Assets | Derivative Liabilities | |||||||||||||||||||||||||
| Derivative Instruments | Notional Amount Outstanding | Location on Consolidated Statements of Financial Condition | Net Estimated Fair Value/Carrying Value | Location on Consolidated Statements of Financial Condition | Net Estimated Fair Value/Carrying Value | |||||||||||||||||||||
| (dollars in thousands) | ||||||||||||||||||||||||||
Interest rate swaps (1) | $ | Derivatives, at fair value | $ | Derivatives, at fair value | $ | |||||||||||||||||||||
| Swap futures | Derivatives, at fair value | Derivatives, at fair value | ( | |||||||||||||||||||||||
| Swaptions | Derivatives, at fair value | Derivatives, at fair value | ||||||||||||||||||||||||
| Interest rate cap | Derivatives, at fair value | Derivatives, at fair value | ||||||||||||||||||||||||
| U.S. Treasury futures | Derivatives, at fair value | Derivatives, at fair value | ||||||||||||||||||||||||
| Interest rate lock commitments | $ | Derivatives, at fair value | Derivatives, at fair value | |||||||||||||||||||||||
| Total | $ | $ | $ | ( | ||||||||||||||||||||||
(1) Interest rate swaps include $575 million in notional amount of cancellable swaps under which the Company retains the right to terminate the swap on specified future dates.
| December 31, 2024 | ||||||||||||||||||||||||||
| Derivative Assets | Derivative Liabilities | |||||||||||||||||||||||||
| Derivative Instruments | Notional Amount Outstanding | Location on Consolidated Statements of Financial Condition | Net Estimated Fair Value/Carrying Value | Location on Consolidated Statements of Financial Condition | Net Estimated Fair Value/Carrying Value | |||||||||||||||||||||
| (dollars in thousands) | ||||||||||||||||||||||||||
| Interest rate swaps | $ | Derivatives, at fair value, net | $ | Derivatives, at fair value, net | $ | |||||||||||||||||||||
| Swaptions | Derivatives, at fair value, net | Derivatives, at fair value, net | ||||||||||||||||||||||||
| U.S. Treasury futures | Derivatives, at fair value, net | Derivatives, at fair value, net | ||||||||||||||||||||||||
| Total | $ | $ | $ | |||||||||||||||||||||||
The effect of the Company’s derivatives on the Consolidated Statements of Operations for the years ended December 31, 2025, 2024, and 2023, respectively, is presented below.
159
| Net gains (losses) on derivatives For the Years Ended | ||||||||||||||
| Derivative Instruments | Location on Consolidated Statements of Operations and Comprehensive Income | December 31, 2025 | December 31, 2024 | December 31, 2023 | ||||||||||
| (dollars in thousands) | ||||||||||||||
| Interest rate swaps | Net unrealized gains (losses) on derivatives | $ | $ | |||||||||||
| Interest rate swaps | Realized gains (losses) on derivatives | ( | ( | ( | ||||||||||
| Interest rate swaps | Periodic interest on derivatives, net | |||||||||||||
| Swap futures | Net unrealized gains (losses) on derivatives | ( | ||||||||||||
| Swap futures | Realized gains (losses) on derivatives | ( | ||||||||||||
| Swap futures | Periodic interest on derivatives, net | |||||||||||||
| U.S. Treasury futures | Realized gains (losses) on derivatives | |||||||||||||
| U.S. Treasury futures | Net unrealized gains (losses) on derivatives | ( | ( | ( | ||||||||||
| Swaptions | Net unrealized gains (losses) on derivatives | ( | ( | ( | ||||||||||
| Swaptions | Net realized gains (losses) on derivatives | ( | ||||||||||||
| Interest rate cap | Net unrealized gains (losses) on derivatives | ( | ||||||||||||
| Interest rate cap | Periodic interest on derivatives, net | |||||||||||||
| U.S. Treasury futures | Gain on origination and sale of loans, net | |||||||||||||
| Interest rate lock commitments | Gain on origination and sale of loans, net | ( | ||||||||||||
When the Company enters into derivative contracts, they are typically subject to International Swaps and Derivatives Association Master Agreements or other similar agreements which may contain provisions that grant counterparties certain rights with respect to the applicable agreement upon the occurrence of certain events such as (i) a decline in stockholders’ equity in excess of specified thresholds or dollar amounts over set periods of time, (ii) the Company’s failure to maintain its REIT status, (iii) the Company’s failure to comply with limits on the amount of leverage, and (iv) the Company’s stock being delisted from the NYSE. Upon the occurrence of any one of items (i) through (iv), or another default under the agreement, the counterparty to the applicable agreement has a right to terminate the agreement in accordance with its provisions. If the Company breaches any of these provisions, it will be required to settle its obligations under the agreements at their termination values, which approximates fair value.
13. Capital Stock
Preferred Stock
The Company declared dividends to Series A preferred stockholders of $12 million, or $2.00 per preferred share, during the years ended December 31, 2025 and December 31, 2024, respectively.
The Company declared dividends to Series B preferred stockholders of $33 million, or $2.57 per preferred share, during the year ended December 31, 2025. The Company declared dividends to Series B preferred stockholders of $34 million, or $2.59 per preferred share, during the year ended December 31, 2024.
The Company declared dividends to Series C preferred stockholders of $21 million, or $2.02 per preferred share, during the year ended December 31, 2025. The Company declared dividends to Series C preferred stock holders of $20 million, or $1.94 per preferred share, during the year ended December 31, 2024.
The Company declared dividends to Series D preferred stockholders of $20 million, or $2.50 per preferred share, during the year ended December 31, 2025. The Company declared dividends to Series D preferred stockholders of $20 million, or $2.55 per preferred share, during the year ended December 31, 2024.
On October 30, 2021, all 5,800,000 issued and outstanding shares of Series A Preferred Stock with an outstanding liquidation preference of $145 million became callable at a redemption price equal to the liquidation preference plus accrued and unpaid dividends through, but not including, the redemption date.
On March 30, 2024, all 13,000,000 issued and outstanding shares of Series B Preferred Stock with an outstanding liquidation preference of $325 million became callable at a redemption price equal to the liquidation preference plus accrued and unpaid dividends through, but not including, the redemption date.
160
On March 30, 2024, all 8,000,000 issued and outstanding shares of Series D Preferred Stock with an outstanding liquidation preference of $200 million became callable at a redemption price equal to the liquidation preference plus accrued and unpaid dividends through, but not including, the redemption date.
On September 30, 2025, all 10,400,000 issued and outstanding shares of Series C Preferred Stock with an outstanding liquidation preference of $260 million became callable at a redemption price equal to the liquidation preference plus accrued and unpaid dividends through, but not including, the redemption date.
After June 30, 2023, all LIBOR tenors relevant to the Company ceased to be published or became no longer representative. The Company believes that the federal Adjustable Interest Rate (LIBOR) Act (the “Act”) and the related regulations promulgated thereunder are applicable to each of its Series B Preferred Stock, Series C Preferred Stock and Series D Preferred Stock. In light of the applicability of the Act to the aforementioned preferred stock, the Company believes, given all of the information available to the Company to date, that three-month CME Term SOFR plus the applicable tenor spread adjustment of 0.26161 % per annum have automatically replaced three-month LIBOR as the reference rate for calculations of the dividend rate payable on the relevant preferred stock for dividend periods from and after (i) March 30, 2024, in the case of the Series B Preferred Stock, (ii) September 30, 2025, in the case of the Series C Preferred Stock, and (iii) March 30, 2024, in the case of the Series D Preferred Stock.
Common Stock
In January 2024, the Company's Board of Directors updated the authorization of the Company’s share repurchase program (the “Share Repurchase Program”) to include the Company's preferred stock and increased the authorization by $33 million back up to $250 million. Such authorization does not have an expiration date, and at present, there is no intention to modify or otherwise rescind such authorization. Shares of the Company's common stock and preferred stock may be purchased in the open market, including through block purchases, through privately negotiated transactions, or pursuant to any trading plan that may be adopted in accordance with Rule 10b5-1 of the Securities Exchange Act of 1934, as amended (the “Exchange Act”). The timing, manner, price and amount of any repurchases will be determined at the Company's discretion and the program may be suspended, terminated or modified at any time, for any reason. Among other factors, the Company intends to only consider repurchasing shares of its common stock when the purchase price is less than the last publicly reported book value per common share. In addition, the Company does not intend to repurchase any shares from directors, officers or other affiliates. The program does not obligate the Company to acquire any specific number of shares, and all repurchases will be made in accordance with Rule 10b-18, which sets certain restrictions on the method, timing, price and volume of stock repurchases.
The Company did not 250 million as of December 31, 2025.
In 2022, the Company entered into separate Distribution Agency Agreements (the “Existing Sales Agreements”) with each of Credit Suisse Securities (USA) LLC, JMP Securities LLC, Goldman Sachs & Co. LLC, Morgan Stanley & Co. LLC and RBC Capital Markets, LLC. In February 2023, the Company amended the Existing Sales Agreements and entered into separate Distribution Agency Agreements (together with the Existing Sales Agreements, as amended, the “Sales Agreements”) with J.P. Morgan Securities LLC and UBS Securities LLC (replacing Credit Suisse Securities LLC) to include J.P. Morgan Securities LLC and UBS Securities LLC as additional sales agents. Pursuant to the terms of the Sales Agreements, the Company may offer and sell shares of our common stock, having an aggregate offering price of up to $500 million, from time to time in “at the market” offerings through any of the sales agents under the Securities Act of 1933. The Company did not issue any shares under the at-the-market sales program during the years ended December 31, 2025 and 2024. The approximate dollar value of shares that may yet be issued under our at-the-market sales program is $426 million as of December 31, 2025.
During year ended December 31, 2025, the Company declared dividends to common shareholders of per share and $123 million or $1.48 per share, respectively. During the year ended December 31, 2024, the Company declared dividends to common shareholders of $117 million, or $1.42 per share, respectively.
Earnings per Share (EPS)
EPS for the years ended December 31, 2025, 2024, and 2023 are computed as follows:
161
| For the Years Ended | |||||||||||
| December 31, 2025 | December 31, 2024 | December 31, 2023 | |||||||||
| (dollars in thousands, except share and per share data) | |||||||||||
| Numerator: | |||||||||||
| Net income available to common shareholders - Basic | $ | $ | $ | ||||||||
| Effect of dilutive securities: | |||||||||||
| Net income available to common shareholders - Diluted | $ | $ | $ | ||||||||
| Denominator: | |||||||||||
| Weighted average basic shares | |||||||||||
| Effect of dilutive securities | |||||||||||
| Weighted average dilutive shares | |||||||||||
| Net income per average share attributable to common stockholders - Basic | $ | $ | $ | ||||||||
| Net income per average share attributable to common stockholders - Diluted | $ | $ | $ | ||||||||
There were no
14. Accumulated Other Comprehensive Income
The following table presents the changes in the components of Accumulated Other Comprehensive Income, or the AOCI, for the year ended December 31, 2025 and 2024:
| December 31, 2025 | ||||||||
| (dollars in thousands) | ||||||||
| Unrealized gains (losses) on available-for-sale securities, net | Total Accumulated OCI Balance | |||||||
| Balance as of December 31, 2024 | $ | $ | ||||||
| OCI before reclassifications | ( | ( | ||||||
| Amounts reclassified from AOCI | ||||||||
| Net current period OCI | ( | ( | ||||||
| Balance as of December 31, 2025 | $ | $ | ||||||
| December 31, 2024 | ||||||||
| (dollars in thousands) | ||||||||
| Unrealized gains (losses) on available-for-sale securities, net | Total Accumulated OCI Balance | |||||||
| Balance as of December 31, 2023 | $ | $ | ||||||
| OCI before reclassifications | ( | ( | ||||||
| Amounts reclassified from AOCI | ||||||||
| Net current period OCI | ( | ( | ||||||
| Balance as of December 31, 2024 | $ | $ | ||||||
The amounts reclassified from AOCI balance comprised of $7 million net unrealized losses on available-for-sale securities sold for the year ended December 31, 2025. There were no amounts reclassified from AOCI during the year ended December 31, 2024.
15. Equity Compensation, Employment Agreements and other Benefit Plans
On June 14, 2023, the Board of Directors recommended and shareholders approved the Chimera Investment Corporation 2023 Equity Incentive Plan (the “Plan”). It authorized the issuance of up to 6,666,667 shares of our common stock for the grant of awards under the Plan. The Plan replaced our 2007 Equity Incentive Plan, as amended and restated effective December 10, 2015 (the “Prior Plan”), and no new awards will be granted under the Prior Plan. Any awards outstanding under the Prior Plan will remain subject to and be paid under the Prior Plan. Any shares subject to outstanding awards under the Prior Plan that
162
expire, terminate, or are surrendered or forfeited for any reason without issuance of shares will automatically become available for issuance under the Plan. Also, shares withheld for tax withholding requirements after stockholder approval of the Plan for full value awards originally granted under the Prior Plan (such as the RSUs and PSUs awarded to our named executive officers) will automatically become available for issuance under the Plan.
As of December 31, 2025, approximately 4 million shares were available for future grants under the Plan.
Awards under the Plan may include stock options, stock appreciation rights, restricted stock, dividend equivalent rights (“DERs”) and other share-based awards (including RSUs). Under the Plan, any of these awards may be performance awards that are conditioned on the attainment of performance goals.
The Compensation Committee of the Board of Directors of the Company had previously approved a Stock Award Deferral Program, or the Deferral Program. The Deferral Program consisted of two distinct non-qualified deferred compensation plans within the meaning of Section 409A of the Code, as amended, one for non-employee directors (the “Director Plan”) and one for certain executive officers (the “Executive Officer Plan”). Under the Deferral Program, non-employee directors and certain executive officers could elect to defer payment of certain stock awards made pursuant to the Plan. Deferred awards are treated as deferred stock units and paid at the earlier of separation from service or a date elected by the participant who is separating. Payments are generally made in a lump sum or, if elected by the participant, in five annual installments. Deferred awards receive dividend equivalents during the deferral period in the form of additional deferred stock units. Amounts are paid at the end of the deferral period by delivery of shares from the Plan (plus cash for any fractional deferred stock units), less any applicable tax withholdings. Deferral elections do not alter any vesting requirements applicable to the underlying stock award. On November 5, 2024, the Compensation Committee of the Board of Directors of the Company irrevocably terminated the Executive Officer Plan and suspended new deferral elections under the Director Plan. The Executive Officer Plan was liquidated as of November 30, 2025, and all amounts outstanding under the Executive Officer Plan on the liquidation date were paid at that time in accordance with applicable tax rules. All deferrals previously made under the Director Plan will remain outstanding, and all deferrals pursuant to prior elections made by directors will be paid on the originally scheduled payment dates. At December 31, 2025 and December 31, 2024, there are approximately 92 thousand and 124 thousand shares for which payments have been deferred until separation or a date elected by the participant, respectively. At December 31, 2025 and December 31, 2024, there are approximately 269 thousand and 229 thousand DERs earned but not yet delivered, respectively.
Grants of Restricted Stock Units (“RSUs”)
During the year ended December 31, 2025 and 2024, the Company granted RSU awards to senior management, employees and directors. These RSU awards are designed to reward senior management, employees of the Company and directors for services provided to the Company. Generally, the RSU awards vest equally over a three-year three years 1 million RSU awards during the year ended December 31, 2025 with a grant date fair value of $16 million which includes stock grants to both Chimera and HomeXpress employees for the 2025 performance year. The Company granted 245 thousand RSU awards during the year ended December 31, 2024 with a grant date fair value of $5 million for the 2024 performance year.
In addition, in connection with the HomeXpress Acquisition, the Compensation Committee adopted the Award Plan, pursuant to which the Company reserved 540,000 shares of Chimera’s common stock, $0.01 par value per share for issuance under the Award Plan solely to individuals who were not previously employees of Chimera or any subsidiary of Chimera (or who are returning to employment following a bona fide period of interruption of employment with Chimera), in accordance with NYSE Listed Company Manual Rule 303A.08. The Award Plan was approved by the Compensation Committee without shareholder approval pursuant to NYSE Listed Company Manual Rule 303A.08. The Compensation Committee also adopted a form of restricted stock unit award agreement for use with the Award Plan. The Company issued restricted stock units to certain employees of HomeXpress as a material inducement for such employees to continue their employment with HomeXpress following the completion of the HomeXpress Acquisition. In connection with this transaction, stock-based compensation expense of $7 million will be recognized on a straight-line basis over the three-year vesting period.
Grants of Performance Share Units (“PSUs”)
PSU awards are designed to align compensation with the Company’s future performance. The PSU awards granted during the year ended December 31, 2025 and 2024, include a three-year 0 200
163
and share price performance compared to a peer group. The Company’s three-year Company Economic Return is equal to the Company’s change in book value per common share plus common stock dividends. Share price performance equals change in share price plus common stock dividends. Compensation expense will be recognized on a straight-line basis over the three-year vesting period based on an estimate of the Company Economic Return and share price performance in relation to the entities in the peer group and will be adjusted each period based on the Company’s best estimate of the actual number of shares awarded. For the year ended December 31, 2025, the Company granted 296 thousand PSU awards to senior management with a grant date fair value of $4 million. For the year ended December 31, 2024, the Company granted 179 thousand PSU awards to senior management with a grant date fair value of $3 million.
Restricted Stock Awards Unvested Shares Outstanding
The following table presents information with respect to the Company's restricted stock awards during the years ended December 31, 2025 and December 31, 2024.
| For the Years Ended | ||||||||||||||
| December 31, 2025 | December 31, 2024 | |||||||||||||
| Number of Shares | Weighted Average Grant Date Fair Value | Number of Shares | Weighted Average Grant Date Fair Value | |||||||||||
| Unvested shares outstanding - beginning of period | $ | $ | ||||||||||||
| Granted | ||||||||||||||
| Vested | ( | ( | ||||||||||||
| Forfeited | ( | ( | ||||||||||||
| Unvested shares outstanding - end of period | $ | $ | ||||||||||||
The forfeited amounts above includes shares forfeited by employees to pay taxes of approximately 248 thousand shares and 369 thousand shares for the years ended December 31, 2025 and December 31, 2024, respectively.
The Company recognized stock-based compensation expense of $11 million which includes stock grants to both Chimera and HomeXpress employees for the year ended December 31, 2025. The Company recognized stock-based compensation expense of $8 million for the year ended December 31, 2024.
The Company also maintains a qualified 401(k) plan. The plan is a retirement savings plan that allows eligible employees to contribute a portion of their wages on a tax-deferred basis under Section 401(k) of the Code. Employees may contribute, through payroll deductions, up to $23,500 if under the age of 50 years and an additional $7,500 “catch-up” contribution for employees 50 years or older. The Company matches 100 % of the first 6 % of the eligible compensation deferred by employee contributions. The employer funds the 401(k) matching contributions in the form of cash, and participants may direct the Company match to an investment of their choice. The benefit of the Company’s contributions vests immediately. Generally, a participating employee is entitled to distributions from the plans upon termination of employment, retirement, death or disability. The 401(k) expenses related to the Company’s qualified plan for the year ended December 31, 2025 was $1 million. The 401(k) expenses related to the Company’s qualified plan for the quarter and year ended December 31, 2024 was $496 thousand, respectively.
16. Income Taxes
For the year ended December 31, 2025, the Company qualified to be taxed as a REIT under Code Sections 856 through 860. As a REIT, the Company is not subject to U.S. federal income tax to the extent that it makes qualifying distributions of taxable income to its stockholders. To maintain qualification as a REIT, the Company must distribute at least 90% of its annual REIT taxable income (subject to certain adjustments) to its shareholders and meet certain other requirements such as assets it may hold, income it may generate and its shareholder composition. It is generally the Company’s policy to distribute to its shareholders all of the Company’s taxable income.
The state and local tax jurisdictions in which the Company is subject to tax-filing obligations recognize the Company’s status as a REIT and, therefore, the Company generally does not pay income tax in such jurisdictions. The Company may, however, be subject to certain minimum state and local tax filing fees and its TRSs are subject to U.S. federal, state, and local taxes.
The components of income (loss) before income taxes were attributable to the following regions:
| December 31, 2025 | December 31, 2024 | |||||||
| (dollars in thousands) | ||||||||
164
| Current Expense (Benefit): | ||||||||
| U.S. Federal | $ | $ | ||||||
| U.S. State and Local | ( | |||||||
| Total Current Income Tax (Benefit) Provision | ||||||||
| Deferred Expense (Benefit): | ||||||||
| U.S. Federal | ( | |||||||
| U.S. State and Local | ||||||||
| Total Deferred Income Tax (Benefit) Provision | ( | |||||||
| Total Expense (Benefit): | ||||||||
| U.S. Federal | ( | |||||||
| U.S. State and Local | ( | |||||||
| Total Income Tax (Benefit) Provision | $ | $ | ||||||
Income tax expense relates solely to the activities of the Company’s TRSs.
Significant components of the Company’s deferred tax assets and liabilities at December 31, 2025 and December 31, 2024 are as follows:
| December 31, 2025 | December 31, 2024 | |||||||
| (dollars in thousands) | ||||||||
| Deferred Tax Assets | ||||||||
| Reserves | $ | $ | ||||||
| Accrued Expenses | ||||||||
| Property and Equipment | ||||||||
| Lease Liability | ||||||||
| Nondeductible Interest Expense | ||||||||
| Net Operating Losses ("NOLs") | ||||||||
| State Taxes | ||||||||
| Other | ||||||||
| Deferred Tax Assets, Gross | ||||||||
| Valuation Allowance | ( | ( | ||||||
| Total Deferred Tax Assets, Net | ||||||||
| Deferred Tax Liabilities | ||||||||
| Right-Of-Use Asset | ( | |||||||
| Intangibles | ( | |||||||
| Total Deferred Tax Liabilities | ( | |||||||
| Total Deferred Tax Asset (Liability) | $ | ( | $ | |||||
A valuation allowance is established when it is more likely than not that some portion or all of the deferred tax assets will not be realized. As of December 31, 2025, the Company has recorded a valuation allowance of $102 million related to certain deferred tax assets of its TRSs. The NOLs and interest disallowed under Code Section 163(j) are subject to an indefinite carryforward period to the extent not utilized.
The following table reconciles the federal statutory income tax rate to the Company’s effective income tax rate for the years ended December 31, 2025 and December 31, 2024:
| December 31, 2025 | December 31, 2024 | |||||||||||||||||||
| (dollars in thousands) | ||||||||||||||||||||
165
| Amount | Percent | Amount | Percent | |||||||||||||||||
| US Federal Statutory Income Tax Rate | $ | % | $ | % | ||||||||||||||||
| Domestic Federal Reconciling Items: | ||||||||||||||||||||
| Non-Taxable and Nondeductible Items: | ||||||||||||||||||||
| Non-Taxable REIT Income | ( | ( | % | ( | ( | % | ||||||||||||||
| Unrealized Gain/(Losses) | % | |||||||||||||||||||
| Transaction Costs | % | |||||||||||||||||||
| Changes in Valuation Allowance | ( | ( | % | % | ||||||||||||||||
| Other | % | % | ||||||||||||||||||
| State and Local Taxes, Net of Federal Benefit | % | |||||||||||||||||||
| Total | $ | % | $ | % | ||||||||||||||||
The effective tax rate for the year ended December 31, 2025 was 0.97 %, compared with 0.03 % for the year ended December 31, 2024. The effective tax rate for the years ended December 31, 2025 differed from the U.S. federal statutory rate of 21.0% primarily due to the deduction of dividend distributions under Code Section 857(a) and the change in valuation allowance. The effective tax rates for the year ended December 31, 2024 differed from the U.S. federal statutory rate of 21.0% primarily due to the deduction of dividend distributions under Code Section 857(a) and the change in valuation allowance related to the remeasurement of NOLs and non-deductible interest expense carryforwards.
The Company and its TRSs file income tax returns in the U.S. federal jurisdiction and various state and local jurisdictions. The Company does not expect have any unrecognized tax benefits and does not expect any changes within the next twelve months. The Company’s U.S. federal, state and local tax returns for the tax years ending on or after December 31, 2022, remain open for examination.
Net cash paid (refunds received) for income taxes consisted of the following:
| December 31, 2025 | |||||
| (dollars in thousands) | |||||
| US Federal | $ | ||||
| State and Local Jurisdictions: | |||||
| California | |||||
| Other* | |||||
| Subtotal | |||||
| Total | $ | ||||
*The amount of income taxes paid during the year does not meet the five percent disaggregation threshold.
17. Credit Risk and Interest Rate Risk
The Company’s primary components of market risk are credit risk and interest rate risk. The Company is subject to interest rate risk in connection with its investments in Agency MBS and Non-Agency RMBS, residential mortgage loans, borrowings under secured financing agreements and securitized debt. When the Company assumes interest rate risk, it attempts to minimize interest rate risk through asset selection, hedging and matching the income earned on mortgage assets with the cost of related financing.
The Company attempts to minimize credit risk through due diligence, asset selection and portfolio monitoring. The Company has established a whole loan target market including qualified mortgages, non-qualified mortgages and reperforming residential mortgage loans. Additionally, the Company seeks to minimize credit risk through compliance with regulatory requirements, geographic diversification, owner occupied property, and moderate loan-to-value ratios. These factors are considered to be important indicators of credit risk.
By using derivative instruments and secured financing agreements, the Company is exposed to counterparty credit risk if counterparties to the contracts do not perform as expected. If a counterparty fails to perform on a derivative instrument, the Company’s counterparty credit risk is equal to the amount reported as a derivative asset on its balance sheet to the extent that amount exceeds collateral obtained from the counterparty or, if in a net liability position, the extent to which collateral posted exceeds the liability to the counterparty. The amounts reported as a derivative asset/(liability) are derivative contracts in a gain/(loss) position, and to the extent subject to master netting arrangements, net of derivatives in a loss/(gain) position with the same counterparty and collateral received/(pledged). If the counterparty fails to perform on a secured financing agreement, the
166
Company is exposed to a loss to the extent that the fair value of collateral pledged exceeds the liability to the counterparty. The Company attempts to minimize counterparty credit risk by evaluating and monitoring the counterparty’s credit, executing master netting arrangements and obtaining collateral, and executing contracts and agreements with multiple counterparties to reduce exposure to a single counterparty.
The Company's secured financing transactions are governed by underlying agreements that provide for a right of setoff by the lender, including in the event of default or in the event of bankruptcy of the borrowing party to the transactions. The Company's derivative transactions are governed by underlying agreements that provide for a right of setoff under master netting arrangements, including in the event of default or in the event of bankruptcy of either party to the transactions. The Company presents its assets and liabilities subject to such arrangements on a net basis in the Consolidated Statements of Financial Condition. The following table presents information about our assets and liabilities that are subject to such arrangements and can potentially be offset on our Consolidated Statements of Financial Condition as of December 31, 2025 and December 31, 2024.
| December 31, 2025 | ||||||||||||||||||||
| (dollars in thousands) | ||||||||||||||||||||
| Gross Amounts of Recognized Assets (Liabilities) | Gross Amounts Offset in the Consolidated Statements of Financial Position | Net Amounts Offset in the Consolidated Statements of Financial Position | Gross Amounts Not Offset with Financial Assets (Liabilities) in the Consolidated Statements of Financial Position | |||||||||||||||||
| Financial Instruments | Cash Collateral (Received) Pledged (1) | Net Amount | ||||||||||||||||||
| Secured financing agreements | $ | ( | $ | $ | ( | $ | $ | $ | ||||||||||||
| Interest rate swaps - Gross Assets | ( | |||||||||||||||||||
| Interest rate swaps - Gross Liabilities | ( | |||||||||||||||||||
| Swap futures - Gross Assets | ||||||||||||||||||||
| Swap futures - Gross Liabilities | ( | ( | ( | |||||||||||||||||
| Swaptions - Gross Assets | ( | ( | ( | |||||||||||||||||
| Swaptions - Gross Liabilities | ||||||||||||||||||||
| Interest rate cap - Gross Assets | ( | ( | ( | |||||||||||||||||
| Interest rate cap - Gross Liabilities | ||||||||||||||||||||
| Interest Rate Lock - Gross Assets | ||||||||||||||||||||
| Interest Rate Lock - Gross Liabilities | ||||||||||||||||||||
| Total | $ | ( | $ | ( | $ | ( | $ | $ | $ | |||||||||||
(1) Included in Other assets
| December 31, 2024 | ||||||||||||||||||||
| (dollars in thousands) | ||||||||||||||||||||
| Gross Amounts of Recognized Assets (Liabilities) | Gross Amounts Offset in the Consolidated Statements of Financial Position | Net Amounts Offset in the Consolidated Statements of Financial Position | Gross Amounts Not Offset with Financial Assets (Liabilities) in the Consolidated Statements of Financial Position | |||||||||||||||||
| Financial Instruments | Cash Collateral (Received) Pledged (1) | Net Amount | ||||||||||||||||||
| Secured financing agreements | $ | ( | $ | $ | ( | $ | $ | $ | ||||||||||||
| Interest Rate Swaps - Gross Assets | ( | |||||||||||||||||||
| Interest Rate Swaps - Gross Liabilities | ( | ( | ||||||||||||||||||
| Treasury Futures - Gross Assets | ||||||||||||||||||||
| Treasury Futures - Gross Liabilities | ||||||||||||||||||||
| Swaptions - Gross Assets | ||||||||||||||||||||
| Swaptions - Gross Liabilities | ( | ( | ( | |||||||||||||||||
| Total | $ | ( | $ | ( | $ | ( | $ | $ | $ | |||||||||||
(1) Included in Other assets
18. Commitments and Contingencies
From time to time, the Company may become involved in various claims and legal actions arising in the ordinary course of business. In connection with certain securitization transactions engaged in by the Company, it has the obligation under certain circumstances to repurchase assets from the VIE upon breach of certain representations and warranties.
Interests in MSR Financing Receivable Commitments
167
The Company is party to agreements with a licensed, GSE approved residential mortgage loan servicer that enables it to garner the economic return of an investment in an MSR purchased by the mortgage servicing counterparty through an MSR financing transaction. The Company has committed to invest a total minimum of $38.2 million of capital. The Company has the option to request the mortgage servicing counterparty to sell the related MSR investments and repay the Company amounts owed to it under the MSR financing transaction less a minimum fee the mortgage servicing counterparty would have earned over the remaining original commitment periods.
At the Company’s election, it can request the mortgage servicing counterparty utilize leverage on the MSRs to which its Interests in MSR financing receivables as of December 31, 2025, the Company’s mortgage servicing counterparty has a $100 million credit facility that is secured by its MSRs including MSRs to which the Company’s interests in MSR financing receivables are referenced. As of December 31, 2025, the mortgage servicing counterparty had drawn $58.5 million of availability under its credit facility. As of December 31, 2025, the Company had the ability to utilize approximately 41.5 % of its mortgage servicing counterparty’s available undrawn capacity under its credit facility. In general, the mortgage servicing counterparty can obtain advances of up to 65 % of the fair value of the MSR collateral value pledged. Under the mortgage servicing counterparty’s credit facility, if the fair value of the pledged MSR collateral declines and the lender demands additional collateral from our mortgage servicing counterparty through a margin call, the Company would be required to provide the mortgage servicing counterparty with additional funds to meet such margin call. If the Company were unable to satisfy such margin call, the lender could liquidate the MSR collateral position to which the Company’s MSR financing receivables are referenced to satisfy the loan obligation, thereby reducing the value of the Company’s interests in MSR financing receivables. Draws under the facility bear interest at term SOFR plus 3.00 % with a floor of 5.50 % and a maturity date of July 31, 2027 with a one-year borrower extension option.
Under the arrangement, the Company is obligated to provide funds to the mortgage servicing counterparty to fund its advances of payments on the serviced pool of mortgage loans within the referenced MSR. The mortgage servicing counterparty is required to return to the Company any subsequent servicing advances collected or reimbursed by the GSEs. At the Company’s option, it could request the mortgage servicing counterparty to fund any servicing advances with draws under its credit facility, subject to available borrowing capacity, while the Company would be required to fund such financing costs.
Repurchase reserves
When the Company sells mortgage loans it makes customary representations and warranties to the purchasers about various characteristics of each loan such as the origination and underwriting guidelines, including, but not limited to the validity of the lien securing the loan, property eligibility, borrower credit, income and asset requirements, and compliance with applicable federal, state, and local law. The whole loan sale agreements generally require the Company to repurchase loans if a representation or warranty is breached. In addition, the Company also could be required to repurchase loans as a result of borrower fraud or if a payment default occurs on a mortgage loan shortly after its sale. In the event of a breach of its representations and warranties, the Company may be required to either repurchase the mortgage loans with the identified defects or indemnify the investor or insurer for any loss. The Company’s loss may be reduced by proceeds from the sale or liquidation of the repurchased loan. In such event, the Company may have the right to seek a recovery of related repurchase losses from the referring mortgage broker.
In the case of early loan payoffs and early defaults on certain loans, the Company may be required to repay all, or a portion, of the premium initially paid by the investor. The estimated obligation associated with early loan payoffs and early defaults is calculated based on current market conditions and historical loss experience by type of loan.
The Company records a provision or a benefit for losses relating to such representations and warranties as part of its loan sale transactions. The provision for estimated repurchase losses and premium recaptures is included in Gain on origination and sale of loans, net, on the accompanying Consolidated Statements of Operations. The method used to estimate the liability for representations and warranties is a function of the representations and warranties given and considers a combination of factors, including, but not limited to, estimated future default and loan repurchase rates, the potential severity of loss in the event of default including any loss on sale or liquidation of the repurchased loan, and the probability of reimbursement by the referring mortgage broker. The Company establishes a liability at the time loans are sold and updates its estimated repurchase liability based on actual and industry performance characteristics, and loan decrement (amortization and prepayment) estimates. The level of the repurchase liability is difficult to estimate and requires considerable management judgment. Given that the level of mortgage loan repurchase losses is dependent on economic factors, investor demands for loan repurchases and other external conditions that may change over the lives of the underlying loans, market expectations around losses related to the Company’s obligations could vary significantly from the obligation recorded as of the balance sheet dates.
168
The settlements, net, for the years ended December 31, 2025, were primarily related to the repayment of premiums on early loan payoffs. Repurchase reserves are included within Accounts payable and other liabilities in the Consolidated Statements of Financial Condition.
The activity related to the Company’s loan repurchase reserves for previously sold loans for the year ended December 31, 2025, is as follows:
| For the Year Ended | |||||
| December 31, 2025 | |||||
| (dollars in thousands) | |||||
| Beginning Balance | $ | ||||
| Acquired during period | |||||
| Provision (Benefit) | |||||
| Pushdown accounting adjustment | |||||
| Settlements, net | ( | ||||
| Ending Balance | $ | ||||
19. Business Combination
On October 1, 2025, the Company, through its wholly-owned subsidiary CIM Funding TRS, completed the previously announced acquisition of HomeXpress, pursuant to that certain Stock Purchase Agreement (the “Stock Purchase Agreement”), dated June 11, 2025 and amended as of August 5, 2025, by and among CIM Funding TRS (as assignee of the rights and obligations of the Company) and the Sellers referred to therein (the “HomeXpress Acquisition”) to acquire all issued and outstanding equity interests of HX Holdco Corp. HomeXpress is a leading originator of consumer Non-QM, investor business purpose, and other non-Agency mortgage loan products, as well as an originator of Agency mortgage loans with a nationwide presence across 46 states and D.C.
The acquisition met the requirements to be considered a business combination under ASC 805. As such, the HomeXpress Acquisition was accounted for using the acquisition method of accounting. CIM Funding TRS was considered the acquirer of HomeXpress for accounting purposes. HomeXpress’ assets and liabilities, affected for adjustments to reflect fair market values assigned to assets purchased and liabilities assumed, and results of operations, are included in the Company’s consolidated financial statements from the acquisition date.
The purchase price was allocated to the tangible and identifiable intangible assets based on their estimated fair market values at the acquisition date as required under ASC 805. The excess of the fair value of the net identifiable assets over the purchase price was recorded as goodwill.
The fair value of the aggregate consideration transferred was $272 million. The total consideration for the HomeXpress Acquisition consisted of (i) cash of $124 million, representing the Adjusted Book Value of HomeXpress as of September 30, 2025, (ii) the cash premium of $120 million, and (iii) the issuance of 2,077,151 shares of the Company's common stock.
The Company incurred approximately $10 million of acquisition-related expenses recognized in Transaction expense in the Consolidated Statements of Operations.
The following table sets forth the acquisition date fair value of the assets acquired and liabilities assumed in connection with the HomeXpress Acquisition.
169
Acquisition Date Fair Value (dollars in thousands) | |||||
| Assets acquired: | |||||
| Cash and cash equivalents | $ | ||||
| Mortgage loans held-for-sale, at fair value | |||||
| Intangible assets | |||||
| Accrued interest receivable | |||||
| Other assets | |||||
| Derivatives, at fair value, net | |||||
| Total assets acquired | |||||
| Liabilities assumed: | |||||
| Secured financing agreements | |||||
| Accounts payable and other liabilities | |||||
| Total liabilities assumed | |||||
| Net assets acquired | |||||
| Goodwill as of October 1, 2025 | |||||
| Total purchase consideration | $ | ||||
The excess of the purchase price over the fair value of the net identifiable tangible and intangible assets was recorded as goodwill and is not deductible for tax purposes. Goodwill is comprised of expected synergies for the combined operations, specialized processes and procedures, and the acquired workforce.
Below is a summary of the intangible assets acquired in the HomeXpress Acquisition:
Fair Value (dollars in thousands) | Weighted Average Estimated Useful Life (in years) | ||||||||||
| Trade name | $ | ||||||||||
| Developed technology | |||||||||||
| Licenses | indefinite | ||||||||||
| Broker relationships | |||||||||||
| Total intangible assets | $ | ||||||||||
The fair value for the trade name was determined using the relief from royalty approach, while the developed technology and licenses were valued using a replacement cost (cost to build) approach, and the broker relationships were valued using an income approach (multi period excess earnings method). All the intangible assets, except licenses, are subject to amortization. The intangible assets acquired subject to amortization have a weighted average useful life of 7.6 years.
From the date of acquisition throughout December 31, 2025, the Company’s Residential Origination segment reported net interest income of $3 million, gain on origination and sale of loans, net, of $21 million, and net income of $8 million which are included in the Consolidated Statements of Operations.
Unaudited Supplemental Pro Forma Financial Information
The following table presents unaudited pro forma combined net interest income, total other income, and net income for the years ended December 31, 2025 and 2024 prepared as if the HomeXpress Acquisition had been consummated on January 1, 2024 (in thousands):
| For the Year Ended | ||||||||
| December 31, 2025 | December 31, 2024 | |||||||
| (dollars in thousands) | ||||||||
| Net interest income | $ | $ | ||||||
| Total other income | ||||||||
| Net income | $ | $ | ||||||
The unaudited supplemental pro forma financial information reflects, among other things, financing adjustments, amortization of intangibles and transactions costs. The unaudited supplemental pro forma financial information has not been adjusted to
170
reflect all conforming accounting policies. The unaudited supplemental pro forma financial information does not include any anticipated synergies or other anticipated benefits of the Acquisition and, accordingly, the unaudited supplemental pro forma financial information is not necessarily indicative of either future results of operations or results that might have been achieved had the HomeXpress Acquisition occurred on January 1, 2024.
20. Segment Reporting
In 2025, Chimera reevaluated the composition and number of its reportable segments based on changes in the significance of certain business activities, including the acquisition of HomeXpress, and the manner in which the Company’s Chief Operating Decision Maker (“CODM”) reviews operating results and allocates resources. As a result of this reevaluation, the Company revised its presentation and composition of its reportable segments beginning in 2025.
Chimera conducts its business and generates substantially all of its revenues primarily in the U.S. through operating segments that have been aggregated into the following reportable segments based on similar economic characteristics and qualitative factors in accordance with ASC 280-10-50-11: (i) Investment Portfolio and (ii) Residential Origination.
The Company does not have revenue from any single customer that represented 10% or more of consolidated revenues for the year ended December 31, 2025.
Residential Origination segment
In conjunction with the HomeXpress acquisition (Note 19), the Residential Origination segment consists of the stand-alone mortgage origination business of HomeXpress that originates consumer Non-QM, investor business purpose, and other Non-Agency and Agency mortgage loan products, and includes the related goodwill, intangible assets, and direct expenses, plus HomeXpress-related residential whole loans and real estate owned.
Investment Portfolio Segment
The Investment Portfolio segment consists of the Company’s investments and third-party advisory services activities, and is comprised of the Company’s investments and financial assets including (i) MSR Related Investments, (ii) Real Estate Securities, (iii) Properties and Residential Mortgage Loans, (iv) Consumer loans and (v) certain ancillary investments and equity method investments, as well as associated financing, hedging, and various allocable expenses. These activities were previously reflected within the Company’s single reportable segment prior to the 2025 segment reevaluation.
Chief Operating Decision Maker and Performance Measures
This segmentation aligns with the information reviewed by the Company’s CODM for purposes of performance assessment and resource allocation. The Company identifies its CODM as the Chief Executive Officer.
The CODM evaluates performance and makes investment and operating decisions based on each segment's contribution to net income. This measure is also used in the Company’s annual budgeting and forecasting process and in assessing budget-to-actual variances when allocating capital and personnel to the segments throughout the year.
The measure of segment profit or loss used by the CODM is net income. In evaluating segment performance, the CODM is regularly provided with information regarding certain significant expense categories that are included in this measure. Significant segment expenses that are regularly reviewed by the CODM include interest expense, compensation and benefits, mortgage origination and related costs, and general and administrative expenses that are directly attributable to the segments.
The following present, for each reportable segment, revenues, the measure of segment profit or loss, and significant segment expenses that are regularly reviewed by the CODM. Segment results are prepared on the same basis as the Company’s consolidated financial statements and are reconciled to consolidated amounts below:
171
| For the Year Ended | ||||||||||||||||||||
| December 31, 2025 | ||||||||||||||||||||
| (dollars in thousands) | ||||||||||||||||||||
| Investment Portfolio | Residential Origination | Total | ||||||||||||||||||
| Net interest income: | ||||||||||||||||||||
| Interest income | $ | $ | $ | |||||||||||||||||
| Interest expense | ||||||||||||||||||||
| Net interest income | ||||||||||||||||||||
| Increase in provision for credit losses | ||||||||||||||||||||
| Other income (losses): | ||||||||||||||||||||
| Net unrealized gains (losses) on derivatives | ||||||||||||||||||||
| Realized losses on derivatives | ( | ( | ||||||||||||||||||
| Periodic interest on derivatives, net | ||||||||||||||||||||
| Net gains (losses) on derivatives | ( | ( | ||||||||||||||||||
| Investment management and advisory fees | ||||||||||||||||||||
| Interest income from investment in MSR financing receivables | ||||||||||||||||||||
| Net unrealized gains on financial instruments at fair value | ||||||||||||||||||||
| Net realized losses on sales of investments | ( | ( | ||||||||||||||||||
| Gains on extinguishment of debt | ||||||||||||||||||||
| Other investment gains | ||||||||||||||||||||
| Gain on origination and sale of loans, net | ||||||||||||||||||||
| Total other income (losses) | ||||||||||||||||||||
| Other expenses: | ||||||||||||||||||||
| Compensation and benefits | ||||||||||||||||||||
| General and administrative expenses | ||||||||||||||||||||
| Servicing and asset manager fees | ||||||||||||||||||||
| Amortization of intangibles and depreciation expenses | ||||||||||||||||||||
| Transaction expenses | ||||||||||||||||||||
| Total other expenses | ||||||||||||||||||||
| Income before income taxes | ||||||||||||||||||||
| Income tax expense (benefit) | ( | |||||||||||||||||||
| Net income | ||||||||||||||||||||
| Dividends on preferred stock | ||||||||||||||||||||
| Net income available to common shareholders | $ | $ | $ | |||||||||||||||||
| As of | ||||||||||||||||||||
| December 31, 2025 | ||||||||||||||||||||
| (dollars in thousands) | ||||||||||||||||||||
| Investment Portfolio | Residential Origination | Total | ||||||||||||||||||
| Total assets | $ | $ | $ | |||||||||||||||||
Recasted prior-year segment information has not been presented as the Company reported a single reportable segment in 2024 and the Residential Origination segment was not part of the Company’s operations during that period.
172
21. Subsequent Events
The Company has evaluated subsequent events through the filing of this Annual Report on Form 10-K and determined that there have been no events that have occurred that would require adjustments to our disclosures in the consolidated financial statements.
22. Summarized Quarterly Results (Unaudited)
The following is a presentation of the results of operations for the quarters ended December 31, 2025, September 30, 2025, June 30, 2025 and March 31, 2025.
| For the Quarters Ended | ||||||||||||||
| December 31, 2025 | September 30, 2025 | June 30, 2025 | March 31, 2025 | |||||||||||
| (dollars in thousands, except per share data) | ||||||||||||||
| Net Interest Income: | ||||||||||||||
| Interest income | $ | $ | $ | $ | ||||||||||
| Interest expense | ||||||||||||||
| Net interest income | ||||||||||||||
| Increase in provision for credit losses | ||||||||||||||
| Other income (losses): | ||||||||||||||
| Net unrealized gains (losses) on derivatives | ( | ( | ( | |||||||||||
| Realized gains (losses) derivatives | ( | ( | ||||||||||||
| Periodic interest on derivatives, net | ||||||||||||||
| Net gains (losses) on derivatives | ( | ( | ( | |||||||||||
| Investment management and advisory fees | ||||||||||||||
| Interest income from investment in MSR financing receivables | ||||||||||||||
| Net unrealized gains (losses) on financial instruments at fair value | ( | ( | ||||||||||||
| Net realized gains (losses) on sales of investments | ( | ( | ||||||||||||
| Gains on extinguishment of debt | ||||||||||||||
| Gain on origination and sale of loans, net | ||||||||||||||
| Other investment gains (losses) | ( | |||||||||||||
| Total other income (losses) | ( | |||||||||||||
| Compensation and benefits | ||||||||||||||
| General and administrative expenses | ||||||||||||||
| Servicing and asset manager fees | ||||||||||||||
| Amortization of intangibles and depreciation expenses | ||||||||||||||
| Transaction expenses | ||||||||||||||
| Total other expenses | ||||||||||||||
| Net income (loss) | $ | $ | ( | $ | $ | |||||||||
| Dividend on preferred stock | $ | $ | $ | $ | ||||||||||
| Net income (loss) available to common shareholders | $ | $ | ( | $ | $ | |||||||||
| Net income (loss) per common share-basic | $ | $ | ( | $ | $ | |||||||||
The following is a presentation of the results of operations for the quarters ended December 31, 2024, September 30, 2024, June 30, 2024 and March 31, 2024.
173
| For the Quarters Ended | ||||||||||||||
| December 31, 2024 | September 30, 2024 | June 30, 2024 | March 31, 2024 | |||||||||||
| (dollars in thousands, except per share data) | ||||||||||||||
| Net Interest Income: | ||||||||||||||
| Interest income | $ | $ | $ | $ | ||||||||||
| Interest expense | ||||||||||||||
| Net interest income | ||||||||||||||
| Increase in provision for credit losses | ||||||||||||||
| Other income (losses): | ||||||||||||||
| Net unrealized gains (losses) on derivatives | ( | |||||||||||||
| Realized losses on derivatives | ( | ( | ||||||||||||
| Periodic interest on derivatives, net | ||||||||||||||
| Net gains (losses) on derivatives | ( | |||||||||||||
| Investment management and advisory fees | ||||||||||||||
| Net unrealized gains (losses) on financial instruments at fair value | ( | |||||||||||||
| Net realized gains (losses) on sales of investments | ( | ( | ||||||||||||
| Other investment gains | ||||||||||||||
| Total other income (losses) | ( | |||||||||||||
| Compensation and benefits | ||||||||||||||
| General and administrative expenses | ||||||||||||||
| Servicing and asset manager fees | ||||||||||||||
| Amortization of intangibles and depreciation expenses | ||||||||||||||
| Transaction expenses | ||||||||||||||
| Total other expenses | ||||||||||||||
| Net income (loss) | $ | ( | $ | $ | $ | |||||||||
| Dividend on preferred stock | $ | $ | $ | $ | ||||||||||
| Net income (loss) available to common shareholders | $ | ( | $ | $ | $ | |||||||||
| Net income (loss) per common share-basic | $ | ( | $ | $ | $ | |||||||||
Item 16. Form 10-K Summary
None.
174
SIGNATURES
Pursuant to the requirements of the Securities Exchange Act of 1934, the registrant has duly caused this report to be signed on its behalf by the undersigned thereunto duly authorized.
| CHIMERA INVESTMENT CORPORATION | ||||||||
| By: | /s/ Phillip J. Kardis II | |||||||
| Phillip J. Kardis II | ||||||||
| President and Chief Executive Officer | ||||||||
| (Principal Executive Officer of the registrant) | ||||||||
| Date: February 18, 2026 | ||||||||
| By: | /s/ Subramaniam Viswanathan | |||||||
| Subramaniam Viswanathan | ||||||||
| Chief Financial Officer (Principal Financial Officer | ||||||||
| and Principal Accounting Officer of the registrant) | ||||||||
| Date: February 18, 2026 | ||||||||
175
| Signatures | Title | Date | |||||||||
| /s/ Phillip J. Kardis II | President, Chief Executive Officer, and Director (Principal Executive Officer) | February 18, 2026 | |||||||||
| Phillip J. Kardis II | |||||||||||
| /s/ Subramaniam Viswanathan | Chief Financial Officer (Principal Financial Officer and Principal Accounting Officer) | February 18, 2026 | |||||||||
| Subramaniam Viswanathan | |||||||||||
| /s/ Gerard Creagh | Director | February 18, 2026 | |||||||||
| Gerard Creagh | |||||||||||
| /s/ Kevin Chavers | Director | February 18, 2026 | |||||||||
| Kevin Chavers | |||||||||||
| /s/ Susan Mills | Director | February 18, 2026 | |||||||||
| Susan Mills | |||||||||||
| /s/ Brian Patrick Reilly | Director | February 18, 2026 | |||||||||
| Brian Patrick Reilly | |||||||||||
| /s/ Debra Still | Director | February 18, 2026 | |||||||||
| Debra Still | |||||||||||
| /s/ Cynthia Walsh | Director | February 18, 2026 | |||||||||
| Cynthia Walsh | |||||||||||
176