10-K: Annual report pursuant to Section 13 and 15(d)
Published on February 21, 2019
UNITED STATES
SECURITIES AND EXCHANGE COMMISSION
WASHINGTON, D.C. 20549
FORM 10-K
(MARK ONE)
[X] ANNUAL REPORT PURSUANT TO SECTION 13 OR 15 (d) OF THE SECURITIES EXCHANGE ACT OF 1934
FOR THE FISCAL YEAR ENDED: DECEMBER 31, 2018
OR
[ ] TRANSITION REPORT PURSUANT TO SECTION 13 OR 15 (d) OF THE SECURITIES EXCHANGE ACT OF 1934
FOR THE TRANSITION PERIOD FROM TO
COMMISSION FILE NUMBER: 1-33796
CHIMERA INVESTMENT CORPORATION
(Exact Name of Registrant as Specified in its Charter)
MARYLAND |
26-0630461 |
(State or other jurisdiction of incorporation of organization) |
(I.R.S. Employer Identification Number) |
520 Madison Avenue, 32nd Floor
|
|
New York, New York |
10022 |
(Address of Principal Executive Offices) |
(Zip Code) |
(212) 626-2300
(Registrant’s telephone number, including area code)
Securities registered pursuant to Section 12(b) of the Act:
Title of Each Class |
Name of Each Exchange on Which Registered |
Common Stock, par value $0.01 per share |
New York Stock Exchange |
8.00% Series A Cumulative Redeemable Preferred Stock, par value $0.01 per share |
New York Stock Exchange |
8.00% Series B Cumulative Fixed-to-Floating Rate Redeemable Preferred Stock, par value $0.01 per share |
New York Stock Exchange |
7.75% Series C Cumulative Fixed-to-Floating Rate Redeemable Preferred Stock, par value $0.01 per share |
New York Stock Exchange |
8.00% Series D Cumulative Fixed-to-Floating Rate Redeemable Preferred Stock, par value $0.01 per share |
New York Stock Exchange |
Securities registered pursuant to Section 12(g) of the Act:
None
Indicate by check mark whether the Registrant is a well-known seasoned issuer, as defined in Rule 405 of the Securities Act.
Yes þ No o
Indicate by check mark if the Registrant is not required to file reports pursuant to Section 13 or Section 15(d) of the Act.
Yes o No þ
Indicate by check mark whether the Registrant (1) has filed all reports required to be filed by Section 13 or 15(d) of the Securities Exchange Act of 1934 during the preceding 12 months (or for such shorter period that the Registrant was required to file such reports), and (2) has been subject to such filing requirements for the past 90 days:
Yes þ No o
Indicate by check mark whether the registrant has submitted electronically every Interactive Data File required to be submitted pursuant to Rule 405 of Regulation S-T (§ 232.405 of this chapter) during the preceding 12 months (or for such shorter period that the registrant was required to submit and post such files).
Yes þ No o
Indicate by check mark if disclosure of delinquent filers pursuant to Item 405 of Regulation S-K is not contained herein, and will not be contained, to the best of registrant’s knowledge, in definitive proxy or information statements incorporated by reference in Part III of this Form 10-K or any amendment to this Form 10-K. þ
Indicate by check mark whether the Registrant is a large accelerated filer, an accelerated filer, non-accelerated filer, or a smaller reporting company. See definition of “accelerated filer,” “large accelerated filer,” “smaller reporting company” and "emerging growth company" in Rule 12b-2 of the Exchange Act.
Large accelerated filer þ Accelerated filer ☐ Non-accelerated filer ☐ Smaller reporting company ☐
Emerging growth company ☐
If an emerging growth company, indicate by check mark if the registrant has elected not to use the extended transition period for complying with any new or revised financial accounting standards provided pursuant to Section 13(a) of the Exchange Act
Indicate by check mark whether the Registrant is a shell company (as defined in Rule 12b-2 of the Exchange Act).
Yes ☐ No þ
At June 30, 2018, the aggregate market value of the voting stock held by non-affiliates of the Registrant was $3,379,832,597 based on the closing sale price on the New York Stock Exchange on that date.
The number of shares of the Registrant’s Common Stock outstanding on January 31, 2019 was 187,053,396.
DOCUMENTS INCORPORATED BY REFERENCE
Portions of the registrant’s definitive Proxy Statement for the 2019 Annual Meeting of Stockholders, which will be filed with the Securities and Exchange Commission under Regulation 14A within 120 days after the end of registrant’s fiscal year covered by this Annual Report, are incorporated by reference into Part III.
CHIMERA INVESTMENT CORPORATION
2018 FORM 10-K
TABLE OF CONTENTS
1
SPECIAL NOTE REGARDING FORWARD-LOOKING STATEMENTS
We make forward-looking statements in this report that are subject to risks and uncertainties. These forward-looking statements include information about possible or assumed future results of our business, financial condition, liquidity, results of operations, plans and objectives. When we use the words ‘‘believe,’’ ‘‘expect,’’ ‘‘anticipate,’’ ‘‘estimate,’’ ‘‘plan,’’ ‘‘continue,’’ ‘‘intend,’’ ‘‘should,’’ ‘‘may,’’ ‘‘would,’’ ‘‘will’’ or similar expressions, we intend to identify forward-looking statements. Statements regarding the following subjects, among others, are forward-looking by their nature:
• |
our business and investment strategy; |
• |
availability of investment opportunities in real estate-related and other securities; |
• |
our expected investments; |
• |
changes in the value of our investments; |
• |
changes in interest rates and mortgage prepayment rates; |
• |
prepayments of the mortgage and other loans underlying our mortgage-backed securities, or RMBS, or other asset-backed securities, or ABS; |
• |
rates of default, delinquencies or decreased recovery rates on our investments; |
• |
general volatility of the securities markets in which we invest; |
• |
our ability to maintain existing financing arrangements and our ability to obtain future financing arrangements; |
• |
our ability to effect our strategy to securitize residential mortgage loans; |
• |
interest rate mismatches between our investments and our borrowings used to finance such purchases; |
• |
effects of interest rate caps on our adjustable-rate investments; |
• |
the degree to which our hedging strategies may or may not protect us from interest rate volatility; |
• |
the impact of and changes to various government programs; |
• |
impact of and changes in governmental regulations, tax law and rates, accounting guidance, and similar matters; |
• |
market trends in our industry, interest rates, the debt securities markets or the general economy; |
• |
estimates relating to our ability to make distributions to our stockholders in the future; |
• |
our understanding of our competition; |
• |
availability of qualified personnel; |
• |
our ability to maintain our classification as a REIT for U.S. federal income tax purposes; |
• |
our ability to maintain our exemption from registration under the Investment Company Act of 1940, as amended, or 1940 Act; |
• |
our expectations regarding materiality or significance; and |
• |
the effectiveness of our disclosure controls and procedures. |
The forward-looking statements are based on our beliefs, assumptions and expectations of our future performance, taking into account all information currently available to us. You should not place undue reliance on these forward-looking statements. These beliefs, assumptions and expectations can change as a result of many possible events or factors, not all of which are known to us. Some of these factors are described under the caption ‘‘Risk Factors’’ in our Form 10-K for fiscal year ended December 31, 2018. If a change occurs, our business, financial condition, liquidity and results of operations may vary materially from those expressed in our forward-looking statements. Any forward-looking statement speaks only as of the date on which it is made. New risks and uncertainties arise from time to time, and it is impossible for us to predict those events or how they may affect us. Except as required by law, we are not obligated to, and do not intend to, update or revise any forward-looking statements, whether as a result of new information, future events or otherwise.
2
In this Annual Report on Form 10-K, references to “we,” “us,” “our” or “the Company” refer to Chimera Investment Corporation and its subsidiaries unless specifically stated otherwise or the context otherwise indicates. The following defines certain of the commonly used terms in this Annual Report on Form 10-K: Agency refers to a federally chartered corporation, such as Fannie Mae or Freddie Mac, or an agency of the U.S. Government, such as Ginnie Mae; MBS refers to mortgage-backed securities secured by pools of residential or commercial mortgage loans; RMBS refers to mortgage-backed securities secured by pools of residential mortgage loans; CMBS refers to mortgage-backed securities secured by pools of commercial mortgage loans; Agency MBS refers to MBS that are issued or guaranteed by an Agency; Agency RMBS and Agency CMBS refer to MBS that are secured by pools of residential and commercial mortgage loans, respectively, and are issued or guaranteed by an Agency; Non-Agency RMBS refers to residential MBS that are not guaranteed by any agency of the U.S. Government or any Agency.
Part I
Item 1. Business
The Company
We are a publicly traded real estate investment trust, or REIT, that is primarily engaged in the business of investing directly or indirectly through our subsidiaries, on a leveraged basis, in a diversified portfolio of mortgage assets, including residential mortgage loans, Agency RMBS, Non-Agency RMBS, Agency CMBS, and other real estate related securities. We were incorporated in Maryland on June 1, 2007, and commenced operations on November 21, 2007.
We have elected and believe that we are organized and operate in a manner that enables us to be taxed as a REIT under the Internal Revenue Code of 1986, as amended, or the Code. As a REIT, we generally are not subject to U.S. federal income tax on our taxable income that is distributed to our stockholders. To ensure we qualify as a REIT, no person may own more than 9.8%, in value or number of shares, whichever is more restrictive, of the outstanding shares of any class or series of our capital stock, which includes our common stock and preferred stock, unless our Board of Directors waives this limitation.
Our Investment Strategy
Our objective is to provide attractive risk-adjusted returns to our investors over the long-term, primarily through dividends. We intend to achieve this objective by investing in a diversified investment portfolio of residential mortgage loans, Agency CMBS, Agency RMBS, Non-Agency RMBS, real estate-related securities and various other asset classes, subject to maintaining our REIT status and exemption from registration under the 1940 Act. The MBS, and real estate-related securities we purchase may include investment-grade, non-investment grade, and non-rated classes.
We make investment decisions based on various factors, including expected cash yield, relative value, risk-adjusted returns, credit fundamentals, macroeconomic considerations, supply and demand, credit and market risk concentration limits, liquidity, cost of financing and financing availability, as well as maintaining our REIT qualification and our exemption from registration under the 1940 Act. Our primary source of income is net interest income from our investment portfolio. Net interest income consists of the interest income we earn on investments less the interest expense we incur on borrowed funds and other liabilities.
Our investment decisions depend on prevailing market conditions and our business opportunities at such time and we expect that these will change over time. As a result, we cannot predict the percentage of our assets that will be invested in each asset class or whether we will invest in other classes of investments. We may change our investment strategy and policies without a vote of our stockholders.
Our investment strategy is intended to take advantage of opportunities in the current interest rate and credit environment. We expect to adjust our strategy to changing market conditions by shifting our asset allocations across these various asset classes as interest rate and credit cycles change over time. We believe that our strategy will enable us to pay dividends throughout changing market cycles. We expect to take a long-term view of assets and liabilities, and our reported earnings and estimates of the fair value of our investments at the end of a financial reporting period will not significantly impact our objective of providing attractive risk-adjusted returns to our stockholders over the long-term.
We use leverage to seek to increase our potential returns and to finance the acquisition of our assets. Our income is generated primarily by the difference, or net spread, between the income we earn on our assets and the cost of our borrowings. We expect to finance our investments using a variety of financing sources including, when available, repurchase agreements, warehouse facilities and securitizations. We seek to manage our debt and interest rate risk by utilizing interest rate hedges, such as interest rate swaps, caps, options and futures to reduce the effect of interest rate fluctuations related to our financing sources.
3
Currently, we focus our investment activities primarily on acquiring Agency MBS and pools of residential mortgage loans, and at December 31, 2018, over 90% of our invested portfolio consisted of these two asset classes. We seek to acquire the loans at a discount to their face amount and utilize leverage to increase returns through securitization or other traditional financing arrangements. We also seek to acquire Non-Agency RMBS and Agency commercial mortgage backed securities subject to market conditions.
At December 31, 2018, based on the amortized cost balance of our interest earning assets, approximately 47% of our investment portfolio was residential mortgage loans, 47% of our investment portfolio was Agency MBS and 6% of our investment portfolio was Non-Agency RMBS, respectively. At December 31, 2017, based on the amortized cost balance of our interest earning assets, approximately 67% of our investment portfolio was residential mortgage loans, 22% of our investment portfolio was Agency MBS and 11% of our investment portfolio was Non-Agency RMBS, respectively.
As discussed in “Management's Discussion and Analysis of Financial Condition and Results of Operations,” the change in the composition of our assets during 2018 relates primarily to our strategy to acquire Agency MBS.
We have elected to be taxed as a REIT and operate our business to be exempt from registration under the 1940 Act and, therefore, we are required to invest a substantial majority of our assets in loans secured by mortgages on real estate and real estate-related assets. Subject to maintaining our REIT qualification and our 1940 Act exemption, we do not have any limitations on the amounts we may invest in any of our targeted asset classes.
Investment Portfolio
The following briefly discusses the principal types of investments that we have made and may in the future make:
Residential Mortgage Loans
We invest in residential mortgage loans (mortgage loans secured by residential real property) primarily through direct and secondary market purchases from banks, non-bank financial institutions, and the Agencies. We expect these loans to be secured primarily by residential properties in the United States.
We acquire residential mortgage loans primarily to securitize them and retain them in our portfolio as securitized mortgage loans. When we securitize mortgage loans, we typically retain the most subordinate classes of securities, which means we are the first-loss security holder. Losses on any residential mortgage loan securing our RMBS will be borne first by the owner of the property (i.e., the owner will first lose any equity invested in the property) and, thereafter, by us as the first-loss security holder, and then by holders of more senior securities. In addition, a portion of these subordinate securities are subject to risk retention rules which significantly limits the liquidity of these securities. We finance these subordinate securities with repurchase agreements. The securities we do not retain are sold through securities underwriters. There is no limit on the amount we may retain of these below-investment-grade subordinate certificates. Until we securitize our residential mortgage loans, we finance our residential mortgage loan portfolio through warehouse facilities and repurchase agreements.
We currently do not intend to establish a loan origination or loan servicing platform. We acquire loans originated by third parties primarily in the secondary market and typically are not underwritten to our specifications. We retain third-party servicers to service the mortgage loans we acquire. We conduct a due diligence review of each servicer before executing a servicing agreement. Servicing procedures would typically follow Fannie Mae guidelines but will be specified in each servicing agreement. We have previously purchased certain residential mortgage loans on a servicing-retained basis, which means a third-party servicer (which may or may not be the seller of the mortgage loans) retained the right to service the loans. In the future, however, we may decide to originate mortgage loans or other types of financing, and we may elect to service mortgage loans and other types of assets.
We engage a third party to perform an independent review of the mortgage file to assess the origination and servicing of the mortgage loan as well as our ability to enforce the mortgage. Depending on the size of the loans, we may not review all the loans in a pool, but rather select loans for diligence review based upon random sampling based criteria such as property location, loan size, effective loan-to-value ratio, borrower’s credit score and other criteria we believe to be important indicators of credit risk. Additionally, we typically obtain representations and warranties with respect to the mortgage loans from each seller, including the origination and servicing of the mortgage loan as well as the enforceability of the lien on the mortgaged property. If any of the representations and warranties with respect to a mortgage loan we acquire are breached, the related seller may be obligated to repurchase the loan from us.
Residential Mortgage-Backed Securities
4
We invest in mortgage pass-through certificates issued or guaranteed by Ginnie Mae, Fannie Mae or Freddie Mac which are securities representing interests in “pools” of mortgage loans secured by residential real property where payments of both interest and principal, plus pre-paid principal, on the securities are made monthly to holders of the security, in effect passing through monthly payments made by the individual borrowers on the mortgage loans that underlie the securities, net of fees paid to the issuer/guarantor and servicers of the securities. We may also invest in collateralized mortgage obligations, or CMOs, issued by the Agencies. CMOs consist of multiple classes of securities, with each class bearing different stated maturity dates. Monthly payments of principal, including prepayments, are first returned to investors holding the shortest maturity class; investors holding the longer maturity classes receive principal only after the first class has been retired.
Agency RMBS are collateralized by either fixed-rate mortgage loans, or FRMs, adjustable-rate mortgage loans, or ARMs, or hybrid ARMs. Hybrid ARMs are mortgage loans that have interest rates that are fixed for an initial period (typically three, five, seven or ten years) and thereafter reset at regular intervals subject to interest rate caps. Our allocation between securities collateralized by FRMs, ARMs or hybrid ARMs will depend on various factors including, but not limited to, relative value, expected future prepayment trends, supply and demand, costs of financing, costs of hedging, expected future interest rate volatility and the overall shape of the U.S. Treasury and interest rate swap yield curves. We take these factors into account when we make these types of investments.
We invest in investment grade and non-investment grade Non-Agency RMBS. We evaluate certain credit characteristics of these types of securities, including, but not limited to, loan balance distribution, geographic concentration, property type, occupancy, periodic and lifetime caps, weighted-average loan-to-value and weighted-average Fair Isaac Corporation, or FICO, score. Qualifying securities are then analyzed using base line expectations of expected prepayments and loss severities, the current state of the fixed-income market and the broader economy in general. Losses and prepayments are stressed simultaneously based on a credit risk-based model. Securities in this portfolio are monitored for variance from expected prepayments, severities, losses and cash flow. The due diligence process is particularly important and costly with respect to newly formed originators or issuers because there may be little or no information publicly available about these entities and investments. We may also invest in interest-only, or IO, Agency and Non-Agency RMBS. These IO RMBS represent the right to receive a specified proportion of the contractual interest flows of the collateral.
We have invested in and intend to continue to invest in Non-Agency RMBS which are typically pass-through certificates created by the securitization of a pool of mortgage loans that are collateralized by residential real estate properties. The respective bond class sizes are determined based on the review of the underlying collateral. The payments received from the underlying loans are used to make the payments on the RMBS. Based on the sequential payment priority, the risk of nonpayment for the investment grade RMBS is lower than the risk of nonpayment for the non-investment grade bonds. Accordingly, the investment grade class is typically sold at a lower yield compared to the non-investment grade or unrated classes which are sold at higher yields.
Agency CMBS
The Agency CMBS we acquire are Ginnie Mae Construction Loan Certificates, or CLCs, and the resulting project loan certificates, or PLCs, when the construction project is complete. Each CLC is backed by a single multifamily property or health care facility. The investor in the CLC is committed to fund the full amount of the project; however, actual funding generally occurs monthly as construction progresses on the property and only after each construction advance is insured by the FHA and issued by Ginnie Mae. The principal balance of the CLC increases as payments by the investor fund each construction advance. Each Ginnie Mae approved mortgage originator must provide the agency with supporting documentation regarding advances and disbursements before each construction advance is issued by Ginnie Mae. We also review this documentation prior to funding each Ginnie Mae guaranteed advance. Upon completion of the construction project, the CLC is replaced with a PLC. Ginnie Mae guarantees the timely payment of principal and interest on each CLC and PLC. This obligation is backed by the full faith and credit of the United States.
As the holder of a CLC, we generally receive monthly payments of interest equal to a pro rata share of the interest payments on the underlying mortgage loan, less applicable servicing and guaranty fees. Ginnie Mae CLCs pay interest only during construction, and so there are no payments of principal. As a holder of a PLC, we generally receive monthly payments of principal and interest equal to the aggregate amount of the scheduled monthly principal and interest payments on the mortgage loans underlying that PLC, less applicable servicing and guaranty fees. In addition, such payments will include any prepayments and other unscheduled recoveries of principal of, and any prepayment penalties on, an underlying mortgage loan to the extent received by the Ginnie Mae Issuer during the month preceding the month of the payment. The mortgage loans underlying the PLCs generally contain a lock-out and prepayment penalty period of 10 years during which the related borrower must pay a prepayment penalty equal to a specified percentage of the principal amount of the mortgage loan in connection with voluntary and certain involuntary prepayments. Ginnie Mae does not guaranty the payment of prepayment penalties.
5
Other Real-Estate Related Assets
We may invest in commercial mortgage loans consisting of first or second lien loans secured by multifamily properties, which are residential rental properties consisting of five or more dwelling units, or by mixed residential or other commercial properties, retail properties, office properties or industrial properties. These loans may or may not conform to the Agency guidelines.
We may invest in CMBS, which are secured by, or evidence ownership interests in, a single commercial mortgage loan or a pool of mortgage loans secured by commercial properties. These securities may be senior, subordinated, investment grade or non-investment grade.
We may invest in securities issued in various collateralized debt obligation, or CDO, offerings to gain exposure to bank loans, corporate bonds, asset-backed securities, or ABS, mortgages, RMBS, CMBS, and other instruments.
Investment Guidelines
We have adopted a set of investment guidelines that set out the asset classes, risk tolerance levels, diversification requirements and other criteria used to evaluate the merits of specific investments as well as the overall portfolio composition. Our investment committee, or Investment Committee, periodically reviews our compliance with the investment guidelines. Our Risk and Audit Committee also reviews our investment portfolio and related compliance with our investment policies and procedures and investment guidelines at regularly scheduled Risk and Audit Committee meetings.
Our Board of Directors and our Investment Committee have adopted the following guidelines for our investments and borrowings:
• |
No investment shall be made that would cause us to fail to qualify as a REIT for U.S. federal income tax purposes; |
• |
No investment shall be made that would cause us to be regulated as an investment company under the 1940 Act; |
• |
With the exception of real estate and housing, no single industry shall represent greater than 20% of the securities or aggregate risk exposure in our portfolio; and |
• |
Investments in non-rated or deeply subordinated ABS or other securities that are non-qualifying assets for purposes of the 75% REIT asset test will be limited to an amount not to exceed 50% of our stockholders’ equity. |
These investment guidelines may be changed from time to time by a majority of our Board of Directors without the approval of our stockholders.
Our Financing Strategy
We use leverage to increase potential returns to our stockholders. We are not required to maintain any specific debt-to-equity ratio as we believe the appropriate leverage for the particular assets we are financing depends on the credit quality and risk of those assets. At December 31, 2018, and 2017, our ratio of debt-to-equity was 6.1:1 and 4.6:1, respectively. For purposes of calculating this ratio, our equity is equal to the Total stockholders’ equity on our Consolidated Statements of Financial Condition, and our debt consists of repurchase agreements and securitized debt.
Subject to maintaining our qualification as a REIT, we may use a number of sources to finance our investments, including the following primary sources:
• |
Securitization. A significant element of our financing strategy is to acquire residential mortgage loans for our portfolio with the intention of securitizing them. In our securitizations, we generally create subordinate certificates, providing a specified amount of credit enhancement, which we intend to retain in our portfolio. We have acquired and may in the future acquire Non-Agency RMBS for our portfolio with the intention of re-securitizing them and retaining a portion of the re-securitized Non-Agency RMBS in our portfolio, typically the subordinate certificates.
|
• |
Warehouse Facilities. We have utilized and may in the future utilize credit facilities for capital needed to fund our assets. We seek to maintain formal relationships with multiple counterparties to maintain warehouse lines on favorable terms.
|
• |
Repurchase Agreements. We have financed certain of our assets through repurchase agreements. We anticipate that repurchase agreements will be one of the sources we will use to achieve our desired amount of leverage for our residential real estate assets. We seek to maintain formal relationships with many counterparties with the intent to obtain financing on the most favorable terms available.
|
6
Our Interest Rate Hedging and Risk Management Strategy
From time to time, we use derivative financial instruments to hedge all or a portion of the interest rate risk associated with our borrowings. Under the U.S. federal income tax laws applicable to REITs, we generally enter certain transactions to hedge indebtedness that we incur, or plan to incur, to acquire or carry real estate assets.
We may engage in a variety of interest rate management techniques that seek to mitigate changes in interest rates or other potential influences on the values of our assets. Our interest rate management techniques may include:
• |
puts and calls on securities or indices of securities; |
• |
Eurodollar futures contracts and options on such contracts; |
• |
interest rate caps, swaps and swaptions; |
• |
U.S. Treasury futures, forward contracts, other derivative contracts and options on U.S. Treasury securities; and |
• |
other similar transactions. |
We may attempt to reduce interest rate risks and to minimize exposure to interest rate fluctuations through match funded financing structures, when appropriate, whereby we seek (i) to match the maturities of our debt obligations with the maturities of our assets and (ii) to match the interest rates on our investments with similar debt directly or through interest rate swaps, caps or other financial instruments, or through a combination of these strategies. This helps us to minimize the risk that we have to refinance our liabilities before the maturities of our assets and to reduce the impact of changing interest rates on our earnings.
Compliance with REIT and Investment Company Requirements
We monitor our investment securities and the income from these securities and, to the extent we enter into hedging transactions, we monitor income from our hedging transactions as well, so as to ensure at all times that we maintain our qualification as a REIT and our exempt status under the 1940 Act.
Employees
At December 31, 2018, we had 38 employees, all of whom were full-time. We believe that our relationship with our employees is good. None of our employees are unionized or represented under a collective bargaining agreement.
Competition
Our net income depends, in large part, on our ability to acquire assets at favorable spreads over our borrowing costs. In acquiring real estate-related assets, we will compete with other mortgage REITs, specialty finance companies, savings and loan associations, banks, mortgage bankers, insurance companies, mutual funds, institutional investors, investment banking firms, financial institutions, hedge funds, governmental bodies (including the U.S. Federal Reserve) and other entities. In addition, there are numerous mortgage REITs with similar asset acquisition objectives, and others that may be organized in the future. These other REITs will increase competition for the available supply of mortgage assets suitable for purchase. Many of our competitors are significantly larger than we are, have access to greater capital and other resources and may have other advantages over us. In addition, some of our competitors may have higher risk tolerances or different risk assessments, which could allow them to consider a wider variety of investments and establish more favorable relationships than we can. Current market conditions may attract more competitors, which may increase the competition for sources of financing. An increase in the competition for sources of funding could adversely affect the availability and cost of financing, and thereby adversely affect the market price of our common stock.
Available Information
Our investor relations website is www.chimerareit.com. We make available on the website under "Investor - Filings & Reports," free of charge, our annual report on Form 10-K, our quarterly reports on Form 10-Q, our current reports on Form 8-K and any other reports that we file with the Securities and Exchange Commission, or SEC, (including any amendments to such reports) as soon as reasonably practicable after we electronically file or furnish such materials to the SEC. Information on our website, however, is not part of or incorporated by reference into this Annual Report on Form 10-K. In addition, all of our filed reports can be obtained at the SEC’s website at www.sec.gov.
Item 1A. Risk Factors
You should carefully consider the following factors, together with all the other information included in this 2018 Form 10-K, in evaluating our company and our business. If any of the following risks actually occur, our business, financial condition and
7
results of operations could be materially and adversely affected, and the value of our stock could decline. Additional risks and uncertainties not presently known to us or that we currently deem immaterial also may impair our business operations. As such, you should not consider this list to be a complete statement of all potential risks or uncertainties.
Risks Associated with Our Investments
The nature of the mortgage loans we acquire and that underlie the MBS we acquire, expose us to credit risk that could negatively affect the value of those assets and investments.
We assume credit risk primarily through the ownership of securities backed by residential, multi-family, and commercial real estate loans and through direct investments in residential real estate loans. Credit losses on residential real estate loans can occur for many reasons (many of which are beyond our control), including: fraud; poor underwriting; poor servicing practices; weak economic conditions; increases in payments required to be made by borrowers; declines in the value of homes; earthquakes, the effects of climate change (including flooding, drought, wildfire and severe weather), and other natural disaster events; uninsured property loss; borrower over-leveraging; costs of remediation of environmental conditions, such as indoor mold; changes in zoning or building codes and the related costs of compliance; acts of war or terrorism; changes in legal protections for borrowers and other changes in law or regulation; and personal events affecting borrowers, such as reduction in income and job loss. Additionally, the amount and timing of credit losses could be affected by loan modifications, delays in the liquidation process, documentation errors, and other action by servicers. Weakness in the U.S. economy or the housing market could cause our credit losses to increase beyond levels that we currently anticipate.
We have investments in Non-Agency RMBS that are the most subordinate securities making us the first-loss security holder in those securitizations.
A significant portion of our RMBS are subordinate classes we have acquired through securitization. When we securitize mortgage loans, we retain the most subordinate classes of securities, which means we are the first-loss security holder. Losses on any residential mortgage loan securing our RMBS will be borne first by the owner of the property (i.e., the owner will first lose any equity invested in the property) and, thereafter, by us as the first-loss security holder, and then by holders of more senior securities. If the losses incurred upon loan default exceed any reserve fund, letter of credit, and classes of securities junior to those we own (if any), we may not be able to recover our investment in such securities. Also, if the underlying properties have been overvalued by the originating appraiser or if the values subsequently decline resulting in less collateral available to satisfy interest and principal payments due on the related security, as the first-loss security holder, we may suffer a total loss of principal, followed by losses on the more senior securities (or other RMBS that we own).
A significant portion of the RMBS we acquire through securitization is subject to the U.S. credit risk retention rules which materially limit our ability to sell or hedge such investments as needed.
A significant part of our business and growth strategy is to engage in securitization transactions to finance the acquisition of residential mortgage loans. Pursuant to the Dodd-Frank Act and related laws and regulations, or the Risk Retention Rules, when we sponsor a residential mortgage loan securitization, we are required to retain at least 5% of the fair value of the mortgage-backed securities issued in the securitization. We can retain either an “eligible vertical interest” (which consists of at least 5% of each class of securities issued in the securitization), an “eligible horizontal residual interest” (which is the most subordinate class of securities with a fair market value of at least 5% of the aggregate credit risk) or a combination of both totaling 5%, or the Required Credit Risk. We typically own the eligible horizontal residual interest. We are required to hold the Required Credit Risk until the later of (i) the fifth anniversary of the securitization closing date and (ii) the date on which the aggregate unpaid principal balance of the mortgage loans in such securitization has been reduced to 25% of the aggregate unpaid principal balance of the mortgage loans as of the securitization closing date, but no longer than the seventh anniversary of the closing date (such date, Sunset Date). In addition, before the Sunset Date, we may not engage in any hedging transactions if payments on the hedge instrument are materially related to the Required Credit Risk and the hedge position would limit our financial exposure to the Required Credit Risk. Also, we may not pledge our interest in any Required Credit Risk as collateral for any financing unless such financing is full recourse to us. We have financed our Required Credit Risk in full recourse transactions. Our Required Credit Risk subjects us to the first losses on our securitizations and is illiquid which may make it more difficult to meet our liquidity needs, each of which may materially and adversely affect our business and financing condition. Thus, the Risk Retention Rules materially limit our ability to sell and hedge a portion of our RMBS that we acquire through our securitizations and subjects us to the credit risk related to the retained RMBS that we otherwise may have sold.
We have investments in Non-Agency MBS collateralized by mortgage loans that do not meet the prime loan underwriting standards and are subject to increased risk of losses.
8
We have certain investments in Non-Agency MBS backed by collateral pools containing mortgage loans that were originated using underwriting standards that were less strict than those used in underwriting “prime mortgage loans.” These lower standards permitted mortgage loans, often with LTV ratios exceeding 80%, to be made to borrowers having impaired credit histories, lower credit scores, higher debt-to-income ratios or unverified income. Such mortgage loans are likely to experience delinquency, foreclosure, bankruptcy, and other losses at rates that are higher, may be substantially higher, than those experienced by prime mortgage loans. Thus, the performance of our Non-Agency MBS that are backed by these types of loans could be correspondingly lower than those backed by prime mortgage loans, which could materially adversely impact our results of operations, financial condition, and business.
A significant portion of our Non-Agency MBS and residential loans are secured by properties in a small number of geographic areas and may be disproportionately affected by economic or housing downturns, natural disasters, terrorist events, regulatory changes, or other adverse events specific to those markets.
A significant number of the mortgages underlying our Non-Agency MBS and Loans held for investments are concentrated in certain geographic areas. For example, we have significant exposure in California, Florida, New York, and New Jersey. For further information on the geographic concentration of our investments see Note 3 and 4 to the consolidated financial statements within this Annual Report on Form 10-K. Certain markets within these states (particularly in California and Florida) have experienced significant decreases in residential home values from time to time. Any event that adversely affects the economy or real estate market in any of these states could have a disproportionately adverse effect on our Non-Agency MBS and Loans held for investments. In general, any material decline in the economy or significant problems in a particular real estate market would likely cause a decline in the value of residential properties securing the mortgages in that market, thereby increasing the risk of delinquency, default, and foreclosure of mortgage loans underlying our Non-Agency MBS and residential loan investments and the risk of loss upon liquidation of these assets. This could have a material adverse effect on our Non-Agency MBS credit loss experience and residential loan investments in the affected market if higher-than-expected rates of default or higher-than-expected loss severities on such loans were to occur.
In addition, the occurrence of a natural disaster or a terrorist attack may cause a sudden decrease in the value of real estate in the area or areas affected and would likely reduce the value of the properties securing the mortgages collateralizing our Non-Agency MBS or Loans held for investments. Because certain natural disasters such as hurricanes or certain flooding are not typically covered by the standard hazard insurance policies maintained by borrowers, or the proceeds payable under any such policy are not sufficient to cover the related repairs, the affected borrowers may have to pay for any repairs themselves. Under these circumstances, borrowers may decide not to repair their property or may stop paying their mortgages under those circumstances. This would cause defaults and credit loss severities to increase.
Changes in local laws and regulations, fiscal policies, property taxes and zoning ordinances in such states can also have a negative impact on property values, which could result in borrowers’ deciding to stop paying their mortgages. This circumstance could cause defaults and loss severities to increase, thereby adversely impacting our results of operations.
The residential mortgage loans we acquire are subject to increased risks.
We acquire residential loans including reperforming loans, nonperforming loans (the borrower is severely delinquent), and non-qualified mortgage loans, or Non-QMs, which are subject to increased risk of loss. Unlike Agency RMBS, residential mortgage loans generally are not guaranteed by the U.S. Government or any government-sponsored enterprise such as Fannie Mae and Freddie Mac. Additionally, by directly acquiring residential loans, we do not receive the structural credit enhancements that benefit senior tranches of RMBS. A residential loan is directly exposed to losses resulting from the default. Therefore, the value of the underlying property, the creditworthiness and financial position of the borrower, and the priority and enforceability of the lien will significantly impact the value of such mortgage loan. In the event of a foreclosure, we may assume direct ownership of the underlying real estate. The liquidation proceeds upon sale of such real estate may not be sufficient to recover our cost basis in the loan, and any costs or delays involved in the foreclosure or liquidation process may increase losses. The value of residential loans is also subject to property damage caused by hazards, such as earthquakes or environmental hazards, not covered by standard property insurance policies and to a reduction in a borrower's mortgage debt by a bankruptcy court. In addition, claims may be assessed against us because of our position as a mortgage holder or property owner, including assignee liability, environmental hazards, and other liabilities. We could also be responsible for property taxes. In some cases, these claims may lead to losses exceeding the purchase price of the related mortgage or property. The occurrence of any of these risks could materially adversely impact our results of operations, financial condition, and business.
In addition, we may from time to time acquire Non-QMs that will not have the benefit of enhanced legal protections otherwise available to residential mortgage loans originated to a more restrictive credit standard than just determining a borrower’s ability to repay. The ownership of Non-QMs will subject us to legal, regulatory and other risks, including those arising under federal consumer protection laws and regulations designed to regulate residential mortgage loan underwriting and originators’ lending
9
processes, standards, and disclosures to borrowers. Failure of residential mortgage loan originators or servicers to comply with the ability-to-repay laws and regulations could subject us, as an assignee or purchaser of these loans (or as an investor in securities backed by these loans), to monetary penalties assessed by the Consumer Financial Protection Bureau, or CFPB, through its administrative enforcement authority and by mortgagors through a private right of action against lenders or as a defense to foreclosure, including by recoupment or setoff of finance charges and fees collected, and could result in rescission of the affected residential mortgage loans, which could adversely impact our business and financial results.
Mortgage loan modification and refinancing programs and future legislative action may materially adversely affect the value of, and the returns on, our MBS and residential loan investments.
The U.S. Government, through the U.S. Federal Reserve, the U.S. Treasury Department, the Federal Housing Administration, or the FHA, and other agencies have implemented in the past, and may in the future, implement federal programs designed to assist homeowners. The U.S. Treasury Department, Federal Housing Finance Agency, or FHFA, FHA, and CFPB have issued guiding principles for future loss mitigation programs. In addition, Fannie Mae and Freddie Mac implemented their Flex Modification foreclosure prevention program, developed at the direction of FHFA. Federal loss mitigation programs, as well as proprietary loss mitigation programs offered by investors and servicers, may involve, among other things, the modification of mortgage loans to reduce the principal amount of the loans (through forbearance or forgiveness) or the rate of interest payable on the loans, or to extend the payment terms of the loans. Especially with our Non-Agency MBS and residential loan investments, loan modifications, including those related to principal forgiveness and coupon reduction, could negatively impact the realized yields and cash flows on such investments. These loan modification programs, future legislative or regulatory actions, including possible amendments to the bankruptcy laws, that result in the modification of outstanding residential mortgage loans, as well as changes in the requirements necessary to qualify for refinancing mortgage loans with Fannie Mae, Freddie Mac or Ginnie Mae, may materially adversely affect the value of, and the returns on, these assets.
Our investments in residential loans subject us to servicing-related risks.
We rely on third-party servicers to service and manage the mortgage loans we own and that underlie our RMBS. The ultimate returns generated by these investments may depend on the quality of the servicer. If a servicer is not vigilant in seeing that borrowers make their required monthly payments, borrowers may be less likely to make these payments, resulting in higher default rates. If a servicer takes longer than expected to liquidate non-performing loans, our losses related to those loans may be higher than originally anticipated. Any failure by servicers to service these mortgages or to competently manage and dispose of the related real properties could negatively impact the value of these investments and our financial performance. In addition, while we have contracted with third-party servicers to carry out the actual servicing of the loans we own, other than our securitized loans, (including all direct interface with the borrowers), we are nevertheless ultimately responsible, vis-à-vis the borrowers and state and federal regulators, for ensuring that the loans are serviced in accordance with the terms of the related notes and mortgages and applicable law and regulation (See “Risks Related to Regulatory Matters and Our 1940 Act Exemption” for further discussion). Considering the current regulatory environment, such exposure could be significant even though we might have contractual claims against our servicers for any failure to service the loans to the required standard.
When a residential loan we own is foreclosed upon, title to the underlying property is taken by a Company subsidiary. The foreclosure process, especially in judicial foreclosure states such as New York, Florida, and New Jersey, can be lengthy and expensive, and the delays and costs involved in completing a foreclosure, and then subsequently liquidating the foreclosed property through sale, may materially increase any related loss. In addition, when the title is taken to a foreclosed property, it may require more extensive rehabilitation than we estimated at acquisition. Thus, a material amount of foreclosed residential mortgage loans, particularly in the states mentioned above, could result in significant losses in our residential loan portfolio and could materially adversely affect our results of operations.
The expanding body of federal, state and local regulations and the investigations of servicers may increase their cost of compliance and the risks of noncompliance, and may adversely affect their ability to perform their servicing obligations.
We rely on third-party servicers to service the residential mortgage loans that we acquire through consolidated trusts and that underlie the MBS that we acquire. The mortgage servicing business is subject to extensive regulation by federal, state and local governmental authorities and is subject to various laws and judicial and administrative decisions imposing requirements and restrictions and increased compliance costs on a substantial portion of their operations. The volume of new or modified laws and regulations has increased in recent years. Some jurisdictions and municipalities have enacted laws that restrict loan servicing activities, including delaying or preventing foreclosures or forcing the modification of certain mortgages.
Federal laws and regulations have also been proposed or adopted which, among other things, could hinder the ability of a servicer to foreclose promptly on defaulted residential loans, and which could result in assignees being held responsible for violations in the residential loan origination process. Certain mortgage lenders and third-party servicers have voluntarily, or as
10
part of settlements with law enforcement authorities, established loan modification programs relating to loans they hold or service. These federal, state and local legislative or regulatory actions that result in modifications of our outstanding mortgages, or interests in mortgages acquired by us either directly through consolidated trusts or through our investments in residential MBS, may adversely affect the value of, and returns on, such investments. Mortgage servicers may be incented by the federal government to pursue such loan modifications, as well as forbearance plans and other actions intended to prevent foreclosure, even if such loan modifications and other actions are not in the best interests of the beneficial owners of the mortgages. The foregoing matters may cause our business, financial condition, results of operations and ability to pay dividends to be adversely affected.
The federal conservatorship of Fannie Mae and Freddie Mac and related efforts, along with any changes in laws and regulations affecting the relationship between Fannie Mae and Freddie Mac and the U.S. Government, may materially adversely affect our business.
The payments of principal and interest we receive on our Agency MBS, which depend directly upon payments on the mortgages underlying such securities, are guaranteed by Fannie Mae, Freddie Mac, or Ginnie Mae. Fannie Mae and Freddie Mac are U.S. Government-sponsored entities, or GSEs, but their guarantees are not backed by the full faith and credit of the United States (although the FHFA largely controls their actions through its conservatorship of the two GSEs). Ginnie Mae is part of a U.S. Government agency and its guarantees are backed by the full faith and credit of the United States.
Although the U.S. Government has undertaken several measures to support the positive net worth of the GSEs since the financial crisis, there is no guarantee of continuing capital support, if such support were to become necessary. These uncertainties lead to questions about the availability of, and trading market for, Agency MBS. Despite the steps taken by the U.S. Government, GSEs could default on their guarantee obligations which would materially and adversely affect the value of our Agency MBS. Accordingly, if these government actions are inadequate in the future and the GSEs were to suffer losses, be significantly reformed, or cease to exist (as discussed below), our business, operations and financial condition could be materially and adversely affected.
The future roles of the GSEs may be reduced (perhaps significantly) and the nature of their guarantee obligations could be limited relative to historical measurements. Alternatively, it is possible that the GSEs could be dissolved entirely or privatized, and, as mentioned above, the U.S. Government could determine to stop providing liquidity support of any kind to the mortgage market. Any changes to the nature of the GSEs or their guarantee obligations could redefine what constitutes an Agency MBS and could have broad adverse implications for the market and our business, operations and financial condition. If Fannie Mae or Freddie Mac were eliminated, or their structures were to change radically (limiting or removing the guarantee obligation), we could be unable to acquire additional Agency MBS and our existing Agency MBS could be materially and adversely impacted.
We could be negatively affected in several ways depending on how events unfold for the GSEs. We could be unable to acquire additional Agency MBS or negatively affect the spreads at which they trade and the value of our Agency MBS could be materially adversely impacted. Also, we rely on our Agency MBS as collateral for a significant portion of our financings. Any decline in our Agency MBS value, or perceived market uncertainty about their value, would make it more difficult for us to obtain financing on our Agency MBS on acceptable terms or at all, or to maintain our compliance with the terms of any financing transactions.
Changes in prepayment rates could negatively affect the value of our investment portfolio, which could result in reduced earnings or losses and negatively affect the cash available for distribution to our stockholders.
There are seldom any restrictions on borrowers’ abilities to prepay their residential mortgage loans. Homeowners tend to prepay mortgage loans faster when interest rates decline. Consequently, owners of the loans have to reinvest the money received from the prepayments at the lower prevailing interest rates. Conversely, homeowners tend not to prepay mortgage loans when interest rates increase. Consequently, owners of the loans are unable to reinvest money that would have otherwise been received from prepayments at the higher prevailing interest rates. A significant portion of the loans underlying our RMBS was originated before the financial crisis and possess higher than current prevailing interest rates. Accordingly, we may experience higher prepayment rates even in a rising interest rate environment due to the strong economy and origination profiles of the loans underlying our RMBS.
Volatility in prepayment rates may affect our ability to maintain targeted amounts of leverage and return on our portfolio of residential mortgage loans and RMBS and may result in reduced earnings or losses for us and negatively affect the cash available for distribution to our stockholders. In addition, if we purchased an investment at a premium, faster than expected prepayments will result in a faster than expected amortization of the premium paid, which would adversely affect our earnings. Conversely, if these investments were purchased at a discount, faster than expected prepayments accelerate our recognition of income.
11
Interest rate fluctuations may have various negative effects on us and may lead to reduced earnings and increased volatility in our earnings.
Changes in interest rates, the interrelationships between various interest rates, and interest rate volatility may have negative effects on our earnings, the fair value of our assets and liabilities, loan prepayment rates, and our access to liquidity. Changes in interest rates may harm the credit performance of our assets. We generally seek to hedge some but not all interest rate risks. Our hedging may not work effectively and we may change our hedging strategies or the degree or type of interest rate risk we assume.
Some of the loans and securities we own or may acquire have adjustable-rate coupons (i.e., they may earn interest at a rate that adjusts periodically based on an interest rate index) and some of the subordinate securities we own are entitled to cash flow only after the more senior securities have been paid and those senior securities have adjustable-rate coupons. As such, the cash flows, and earnings, we receive from these assets may vary as a function of interest rates. For example, if interest rates increase, the cash flow we receive from securities with adjustable-rate coupons is expected to increase while the cash flow we receive on securities that are subordinate to adjustable-rate securities may decrease. We also acquire loans and securities for future sale, as assets we are accumulating for securitization, or as a longer-term investment. We expect to fund assets, loans, and securities with a combination of equity and debt. If we use adjustable rate debt to fund assets that have a fixed interest rate (or use fixed rate debt to fund assets that have an adjustable interest rate), an interest rate mismatch could exist and we could earn less (and fair values could decline) if interest rates rise, at least for a time. We may seek to mitigate interest rate mismatches for these assets with hedges such as swaps and other derivatives, which may not be successful.
Higher interest rates generally reduce the fair value of many of our assets. This may affect our earnings results, reduce our ability to securitize, re-securitize, or sell our assets, or reduce our liquidity. Higher interest rates could reduce borrowers’ ability to make interest payments or to refinance their loans. Higher interest rates could reduce property values and increased credit losses could result. Higher interest rates could reduce mortgage originations, thus reducing our opportunities to acquire new assets. In addition, when short-term interest rates are high relative to long-term interest rates, an increase in adjustable-rate residential loan prepayments may occur, which would likely reduce our returns from owning interest-only securities backed by adjustable-rate residential loans.
New assets we acquire may not generate yields as attractive as yields on our current assets, which could result in a decline in our earnings per share over time.
We expect that the assets we acquire or invest in may not generate the economic returns and GAAP yields of our existing portfolio. A significant portion of our securitized residential mortgage loans was originated before the 2008 financial crisis and have mortgage interest rates exceeding mortgage interest rates currently available to newly originated residential mortgage loans. In addition, after the 2008 financial crisis, we acquired residential mortgage-backed securities at a significant discount and re-securitized them, retaining high-yielding subordinate securities.
To maintain our portfolio size and our earnings, we must reinvest in new assets a portion of the cash flows we receive from principal, interest, and loan sales. However, prepayments, defaults, and loan amortization have reduced the supply of these pre-crisis assets. Also, investors seeking higher-yielding assets have created a significant demand for the remaining assets which may make it difficult for us to acquire such assets and reducing the return on assets we do acquire. Accordingly, realized cash flow from new investments could be significantly lower than expected and returns from new investments and acquisitions could be negative. We may also sell assets from time to time as part of our portfolio and capital management strategies. Principal payments, calls, and sales reduce the size of our current portfolio and generate cash for us. If the assets we invest in or acquire in the future earn lower GAAP yields than do the assets we currently own, our reported earnings per share could decline over time as the older assets are paid down or are sold, assuming comparable expenses, credit costs, and market valuation adjustments.
The performance of the assets we own and the investments we make will vary and may not meet our earnings or cash flow expectations. In addition, the cash flows and earnings from, and market values of, securities, loans, and other assets we own may be volatile.
We seek to manage certain of the risks associated with acquiring, holding, selling, and managing real estate loans and securities and other real estate-related investments. No amount of risk management or mitigation, however, can change the variable nature of the cash flows of, fair values of, and financial results generated by these assets. Changes in the credit performance of, or the prepayments on, these investments, including real estate loans and the loans underlying these securities, and changes in interest rates impact the cash flows on these securities and investments, and the impact could be significant for our assets with concentrated risks. Changes in cash flows lead to changes in our return on investment and to potential variability in, and level
12
of reported income. The revenue recognized on some of our assets is based on an estimate of the yield over the remaining life of the asset. Thus, changes in our estimates of expected cash flow from an asset will result in changes in our reported earnings on that asset in the current reporting period. We may be forced to recognize adverse changes in expected future cash flows as a current expense, further adding to earnings volatility.
Changes in the fair values of our assets, liabilities, and derivatives can have various negative effects on us, including reduced earnings, increased earnings volatility, and volatility in our book value.
Fair values for our assets and liabilities, including derivatives, can be volatile and our revenue and income can be impacted by changes in fair values. The fair values can change rapidly and significantly and changes can result from changes in interest rates, perceived risk, supply, demand, and actual and projected cash flows, prepayments, and credit performance. A decrease in fair value may not necessarily be the result of deterioration in future cash flows. Fair values for illiquid assets can be difficult to estimate, which may lead to volatility and uncertainty of earnings and book value.
For GAAP purposes, we may mark to market some, but not all, of the assets and liabilities on our Consolidated Statements of Financial Condition. In addition, valuation adjustments on certain consolidated assets and our derivatives are reflected in our Consolidated Statements of Operations. Assets that are funded with certain liabilities and hedges may have different mark-to-market treatment than the liability or hedge. If we sell an asset that has not been marked to market through our Consolidated Statements of Operations at a reduced market price relative to its cost basis, our reported earnings will be reduced.
Our loan sale profit margins are generally reflective of gains (or losses) over the period from when we identify a loan for purchase until we subsequently sell or securitize the loan. These profit margins may encompass elements of positive or negative market valuation adjustments on loans, hedging gains or losses associated with related risk management activities, and any other related transaction expenses; however, under GAAP, the different elements may be realized unevenly over the course of one or more quarters for financial reporting purposes, with the result that our financial results may be more volatile and less reflective of the underlying economics of our business activity.
Our calculations of the fair value of the assets we own or consolidate are based upon assumptions that are inherently subjective and involve a high degree of management judgment.
We report the fair values of securities, loans, derivatives, and certain other assets on our Consolidated Statements of Financial Condition. In computing the fair values for these assets, we may make several market-based assumptions, including assumptions regarding future interest rates, prepayment rates, discount rates, credit loss rates, and the timing of credit losses. These assumptions are inherently subjective and involve a high degree of management judgment, particularly for illiquid securities and other assets for which market prices are not readily determinable. For further information regarding our assets recorded at fair value see Note 5 to the consolidated financial statements within this Annual Report on Form 10-K. Use of different assumptions could materially affect our fair value calculations and our financial results. Further discussion of the risk of our ownership and valuation of illiquid securities is set forth in the immediately following risk factor.
A significant portion of our investments are illiquid and may be difficult to value.
A significant portion of our investments are not publicly traded and are therefore illiquid. The fair value of securities, reperforming mortgage loans (loans that typically were significantly delinquent and subsequently modified so that the borrower started making payments), and other investments we make that are not publicly traded may not be readily determinable and it may be difficult to obtain third party pricing on such investments. Also, validating third party pricing for illiquid investments may be more subjective than more liquid investments and may not be reliable. Illiquid investments may also experience greater price volatility because an active market does not exist. We value our investments quarterly based on our judgment and in accordance with our valuation policy. Because such valuations are inherently uncertain, our fair value determination may differ materially from the values obtained from third parties or the values that would have been used, if an active trading market existed for these investments. Our results of operations, financial condition and business could be materially adversely affected if our fair value determinations of the investments were materially higher than the values that would exist if a ready market existed for these assets.
The illiquidity of our investments may make it difficult, or impossible for certain assets subject to the Risk Retention Rules, for us to sell. Also, if we quickly liquidate all or a portion of our portfolio (for example, to meet a margin call), we may realize significantly less than the value at which we have previously recorded our investments. Thus, our ability to adjust our portfolio in response to changes in economic and other conditions may be relatively limited, which could adversely affect our results of operations, financial condition and the value of our capital stock. This risk may be more pronounced during any severe market disruption in the mortgage, housing or related sectors.
13
We have experienced, and may in the future experience, declines in the market value of our assets resulting in us recording impairments, which have had or may in the future have, an adverse effect on our results of operations and financial condition.
A decline in the market value of our MBS or other assets may require us to recognize an other-than-temporary impairment, or OTTI, against such assets under GAAP. When the fair value of our MBS is less than its amortized cost, the security is considered impaired. We assess our impaired securities on at least a quarterly basis and designate such impairments as either temporary or other-than-temporary. The determination as to whether an OTTI exists and, if so, the amount we consider other-than-temporarily impaired is subjective, as such determinations are based on both factual and subjective information available at the time of assessment. Thus, the timing and amount of OTTI constitute material estimates that are susceptible to significant change. In the future, we may experience declines in the fair value of our MBS and other assets that could result in additional OTTI that will be recognized in earnings.
Our GAAP financial results may not be an accurate indicator of taxable income and dividend distributions.
Generally, the cumulative net income we report over the life of an asset will be the same for GAAP and tax purposes, although the timing of this income recognition over the life of the asset could be materially different. Differences exist in the accounting for GAAP net income and REIT taxable income, which can lead to significant variances in the amount and timing of when income and losses are recognized under these two measures. Due to these differences, our reported GAAP financial results could materially differ from our determination of taxable income results, which impacts our dividend distribution requirements, and therefore, our GAAP results may not be an accurate indicator of future taxable income and dividend distributions.
Risks Related to Financing and Hedging
Our business strategy involves the use of leverage, and we may not achieve what we believe to be optimal levels of leverage or we may become overleveraged, which may materially adversely affect our liquidity, results of operations or financial condition.
Our business strategy involves the use of borrowing, or leverage. Pursuant to our leverage strategy, we borrow against a substantial portion of the market value of our assets and use the borrowed funds to finance our investment portfolio and the acquisition of additional investment assets. We are not required to maintain any particular debt-to-equity ratio. Future increases in the amount by which the collateral value is required to contractually exceed the amount borrowed in such leverage financing transactions, decreases in the market value of our residential mortgage investments, increases in interest rate volatility and changes in the availability of acceptable financing could cause us to be unable to achieve the amount of leverage we believe to be optimal. The return on our assets and cash available for distribution to our stockholders may be reduced to the extent that changes in market conditions prevent us from achieving the desired amount of leverage on our investments or cause the cost of our financing to increase relative to the income earned on our leveraged assets. If the interest income on the investments that we have purchased with borrowed funds fails to cover the interest expense of the related borrowings, we will experience net interest losses and may experience net losses from operations. Such losses could be significant because of our leveraged structure. The use of leverage to finance our investments involves many other risks, including, among other things, the following:
• |
Adverse developments involving major financial institutions or involving one of our lenders could result in a rapid reduction in our ability to borrow and materially adversely affect our business, profitability, and liquidity. As of December 31, 2018, we had amounts outstanding under repurchase agreements with 30 separate lenders. A material adverse development involving one or more major financial institutions or the financial markets, in general, could result in our lenders reducing our access to funds available under our repurchase agreements or terminating such repurchase agreements altogether. Because substantially all our repurchase agreements are uncommitted and renewable at our lenders’ discretion, our lenders could determine to reduce or terminate our access to future borrowings at virtually any time, which could materially adversely affect our business and profitability. Furthermore, if a few of our lenders became unwilling or unable to continue to provide us with financing, we could be forced to sell assets, including assets in unrealized loss positions, to maintain liquidity. Forced sales, particularly under adverse market conditions, may result in lower sale prices than ordinary market sales made in the normal course of business. If our investments were liquidated at prices below our amortized cost of such assets, we would incur losses, which could adversely affect our earnings. In addition, uncertainty in the global finance market and weak economic conditions in Europe, including the United Kingdom’s decision to exit from the European Union (commonly referred to as “Brexit”), could cause the conditions described above to have a more pronounced effect on our European counterparties.
|
14
• |
Our profitability may be materially adversely affected by a reduction in our leverage. As long as we earn a positive spread between interest and other income we earn on our leveraged assets and our borrowing costs, we believe that we can generally increase our profitability by using greater amounts of leverage. There can be no assurance, however, that repurchase financing will remain an efficient source of long-term financing for our assets. The amount of leverage that we use may be limited because our lenders might not make funding available to us at acceptable rates or they may require that we provide additional collateral to secure our borrowings. If our financing strategy is not viable, we will have to find alternative forms of financing for our assets which may not be available to us on acceptable terms or at acceptable rates. In addition, in response to certain interest rate and investment environments or to changes in market liquidity, we could adopt a strategy of reducing our leverage by selling assets or not reinvesting principal payments as MBS amortize or prepay, thereby decreasing the outstanding amount of our related borrowings. Such an action could reduce interest income, interest expense and net income, the extent of which would depend on the level of reduction in assets and liabilities as well as the sale prices for which the assets were sold.
|
• |
A re-characterization of the repurchase agreements as sales for tax purposes rather than as secured lending transactions would adversely affect our ability to maintain our qualification as a REIT and to maintain our 1940 Act exemption. When we enter a repurchase agreement, we generally sell assets to our counterparty to the agreement for cash. The counterparty is obligated to resell the assets back to us at the end of the transaction term, which is typically 30 to 90 days. We believe that for U.S. federal income tax purposes we will be treated as the owner of the assets that are the subject of repurchase agreements and that the repurchase agreements will be treated as secured lending transactions notwithstanding that such agreement may transfer record ownership of the assets to the counterparty during the term of the agreement. It is possible, however, that the IRS or the SEC could successfully assert that we did not own these assets during the term of the repurchase agreements, in which case we could fail to qualify as a REIT or fail to maintain our 1940 Act exemption, respectively.
|
• |
A decline in the market value of our assets may result in margin calls that may force us to sell assets under adverse market conditions, which may materially adversely affect our liquidity and profitability. In general, the market value of our residential mortgage investments is impacted by changes in interest rates, prevailing market yields and other market conditions, including general economic conditions, home prices, and the real estate market generally. A decline in the market value of our residential mortgage investments may limit our ability to borrow against such assets or result in lenders initiating margin calls, which require a pledge of additional collateral or cash to re-establish the required ratio of borrowing to collateral value, under our repurchase agreements. Posting additional collateral or cash to support our credit will reduce our liquidity and limit our ability to leverage our assets, which could materially adversely affect our business. Thus, we could be forced to sell a portion of our assets, including MBS in an unrealized loss position, to maintain liquidity.
|
• |
If a counterparty to our repurchase transactions defaults on its obligation to resell the underlying security back to us at the end of the transaction term or if we default on our obligations under the repurchase agreement, we could incur losses. When we engage in repurchase transactions, we generally sell assets to the counterparty to the agreement for cash. Because the cash we receive from the counterparty is less than the value of those securities (this difference is referred to as the “haircut”), if the lender defaults on its obligation to transfer the same securities back to us, we would incur a loss on the transaction equal to the amount of the haircut (assuming there was no change in the value of the securities). (See Item 7, “Management’s Discussion and Analysis of Financial Condition and Results of Operations” of this Annual Report on Form 10-K, for further discussion regarding risks related to exposure to financial institution counterparties in light of recent market conditions.) Our exposure to defaults by counterparties may be more pronounced during periods of significant volatility in the market conditions for mortgages and mortgage-related assets as well as the broader financial markets. At December 31, 2018, there was no amount at risk with any counterparty greater than 10% of the Company's equity. In addition, generally, if we default on a repurchase transaction, we could incur a loss equal to the haircut and the counterparty can elect to terminate the transaction and cease entering into additional repurchase transactions with us. In addition, if we default on a transaction under any one agreement and fail to honor the related guarantee, the counterparties on our other repurchase agreements could also declare a default under their respective repurchase agreements. Any losses we incur on our repurchase transactions could materially adversely affect our earnings and thus our cash available for distribution to our stockholders.
|
• |
Our use of repurchase agreements to borrow money may give our lenders greater rights in the event of bankruptcy. In the event of our insolvency or bankruptcy, certain repurchase agreements may qualify for special treatment under the Bankruptcy Code, the effect of which, among other things, would be to allow the creditor under the agreement to avoid the automatic stay provisions of the Bankruptcy Code and take possession of, and liquidate, the collateral under such repurchase agreements without delay.
|
15
An increase in our borrowing costs relative to the interest we receive on our assets may materially adversely affect our profitability.
Our earnings are primarily generated from the difference between the interest income we earn on our investment portfolio, less net amortization of purchase premiums and discounts, and the interest expense we pay on our borrowings. We rely primarily on borrowings under repurchase agreements to finance our investments, which have short-term contractual maturities. In general, if the interest expense on our borrowings increases relative to the interest income we earn on our investments, our profitability may be materially adversely affected. Interest rates are highly sensitive to many factors, including fiscal and monetary policies and domestic and international economic and political conditions, as well as other factors beyond our control. In general, we finance the acquisition of our investments through borrowings in the form of repurchase transactions, which exposes us to interest rate risk on the financed assets. The cost of our borrowings is based on prevailing market interest rates. Because the terms of our repurchase transactions typically range from one to three months at inception, the interest rates on our borrowings generally adjust more frequently (as new repurchase transactions are entered upon the maturity of existing repurchase transactions) than the interest rates on our investments. During a period of rising interest rates (such as during 2018, which is expected to continue during 2019), our borrowing costs generally will increase at a faster pace than our interest earnings on the leveraged portion of our investment portfolio, which could result in a decline in our net interest spread and net interest margin. The severity of any such decline would depend on our asset/liability composition, including the impact of hedging transactions, at the time as well as the magnitude and period over which interest rates increase. Further, an increase in short-term interest rates could also have a negative impact on the market value of our investments. If any of these events happen, we could experience a decrease in net income or incur a net loss during these periods, which may negatively impact our distributions to stockholders.
Changes in banks’ inter-bank lending rate reporting practices or, the method pursuant to which LIBOR is determined or, elimination of LIBOR may adversely affect the value of the financial obligations to be held or issued by us that are linked to LIBOR as well as adjustable-rate mortgage loans we hold.
The interest rates on our repurchase agreements, as well as adjustable-rate mortgage loans in our securitizations, are generally based on LIBOR, which is subject to recent national, international, and other regulatory guidance and proposals for reform. Some of these reforms are already effective while others are still to be implemented. These reforms may cause such benchmarks to perform differently than in the past, or have other consequences which cannot be predicted. In particular, regulators and law enforcement agencies in the U.K. and elsewhere are conducting criminal and civil investigations into whether the banks that contribute information to the British Bankers’ Association, or BBA, in connection with the daily calculation of LIBOR may have been under-reporting or otherwise manipulating or attempting to manipulate LIBOR. A number of BBA member banks have entered settlements with their regulators and law enforcement agencies with respect to this alleged manipulation of LIBOR. Actions by the regulators or law enforcement agencies, as well as ICE Benchmark Administration (the current administrator of LIBOR), may result in changes to the way LIBOR is determined or the establishment of alternative reference rates. For example, on July 27, 2017, the U.K. Financial Conduct Authority announced that it intends to stop persuading or compelling banks to submit LIBOR rates after 2021.
Currently, it is not possible to predict the effect of any such changes, any establishment of alternative reference rates or any other reforms to LIBOR that may be implemented in the U.K. or elsewhere. Uncertainty as to the nature of such potential changes, alternative reference rates or other reforms may adversely affect the rates on our repurchase facilities, securitizations or residential loans held for longer-term investment. If LIBOR is discontinued or is no longer quoted, the applicable base rate used to calculate interest on our repurchase agreements will be determined using alternative methods. One such alternative rate being discussed and tested in the United States is the Secured Overnight Funding Rate, or SOFR. There are significant differences between LIBOR and SOFR such as LIBOR being an unsecured lending rate and SOFR a secured lending rate, another is SOFR is an overnight rate and LIBOR reflects term rates at different maturities. These and other differences create the potential for basis risk between the two rates. The impact of any basis risk difference between LIBOR and SOFR may negatively affect our net interest margin. Any of these alternative methods may result in interest rates that are higher than if the LIBOR Rate was available in its current form, which could have a material adverse effect on our net interest margin.
Our financing facilities may contain covenants that restrict our operations.
Certain financing facilities we may enter contain restrictions, covenants, and representations and warranties that, among other things, may require us to satisfy specified financial, asset quality, loan eligibility, and loan performance tests. If we fail to meet or satisfy any of these covenants or representations and warranties, we would be in default under these agreements and our lenders could elect to declare all amounts outstanding under the agreements to be immediately due and payable, enforce their respective rights against collateral pledged under such agreements, and restrict our ability to make additional borrowings. Certain financing agreements may contain cross-default provisions by a guarantor so that if a default occurs under any guaranty agreement, the lenders under our other agreements could also declare a default under their respective agreements. Further,
16
under our agreements, we are typically required to pledge additional assets to our lenders in the event the estimated fair value of the existing pledged collateral under such agreements declines and such lenders demand additional collateral, which may take the form of additional securities, loans or cash. These restrictions may interfere with our ability to obtain financing or to engage in other business activities, which may have a significant negative impact on our business, financial condition, liquidity and results of operations. A default and resulting repayment acceleration could significantly reduce our liquidity, which could require us to sell our assets to repay amounts due and outstanding. This could also significantly harm our business, financial condition, results of operations, and our ability to make distributions, which could cause the value of our capital stock to decline. A default will also significantly limit our financing alternatives such that we will be unable to pursue our leverage strategy, which could curtail our investment returns.
Hedging against interest rate exposure may not be successful in mitigating the risks associated with interest rates and may adversely affect our earnings, which could reduce our cash available for distribution to our stockholders.
Subject to maintaining our qualification as a REIT, we pursue various hedging strategies to seek to reduce our exposure to losses from adverse changes in interest rates. Our hedging activity varies in scope based on the level and volatility of interest rates, the type of assets held, financing used, and other changing market conditions. There are no perfect hedging strategies, and interest rate hedging may fail to protect us from loss. Alternatively, we may fail to properly assess a risk to our investment portfolio or may fail to recognize a risk entirely, leaving us exposed to losses without the benefit of any offsetting hedging activities. The derivative financial instruments we select may not have the effect of reducing our interest rate risk. The nature and timing of hedging transactions may influence the effectiveness of these strategies. Poorly designed strategies or improperly executed transactions could increase our risk and losses. In addition, hedging activities could result in losses if the event against which we hedge does not occur. For example, interest rate hedging could fail to protect us or adversely affect us because among other things:
• |
interest rate hedging can be expensive, particularly during periods of rising and volatile interest rates; |
• |
available interest rate hedges may not correlate directly with the interest rate risk for which protection is sought; |
• |
the duration of the hedge may not match the duration of the related liability; |
• |
the amount of income that a REIT may earn from hedging transactions to offset interest rate losses may be limited by U.S. federal tax provisions governing REITs; |
• |
the credit quality of the party owing money on the hedge may be downgraded to such an extent that it impairs our ability to sell or assign our side of the hedging transaction; |
• |
the party owing money in the hedging transaction may default on its obligation to pay; and |
• |
the value of derivatives used for hedging may be adjusted from time to time in accordance with accounting rules to reflect changes in fair value. Downward adjustments, or “mark-to-market losses,” would reduce our stockholders’ equity. |
Our hedging transactions, which are intended to limit losses, may limit gains and increase our exposure to losses. Thus, our hedging activity may adversely affect our earnings, which could reduce our cash available for distribution to our stockholders. In addition, some hedging instruments involve risk since they are not currently traded on regulated exchanges, guaranteed by an exchange or its clearing house, or regulated by any U.S. or foreign governmental authorities.
Clearing facilities or exchanges upon which some of our hedging instruments are traded may increase margin requirements on our hedging instruments in the event of uncertainty or adverse developments in financial markets.
In response to events having or expected to have adverse economic consequences or which create market uncertainty, clearing facilities or exchanges upon which some of our hedging instruments, such as interest rate swaps, are traded may require us to post additional collateral against our hedging instruments. Generally, the independent margin goes up in times of interest rate volatility. If future adverse economic developments or market uncertainty result in increased margin requirements for our hedging instruments, it could materially adversely affect our liquidity position, business, financial condition and results of operations.
We have elected not to qualify for hedge accounting treatment for GAAP reporting.
We record derivative and hedge transactions in accordance with GAAP. Our interest rate swaps have not been designated as hedging instruments for accounting purposes. Consequently, all changes in the fair value of swaps are reported as a component of net income in the Consolidated Statements of Operations, rather than Accumulated other comprehensive income, (or AOCI), a component of stockholders' equity, which can make our GAAP net income volatile.
Complying with REIT requirements may limit our ability to hedge effectively.
17
The REIT provisions of the Code substantially limit our ability to hedge our assets and related borrowings. Under these provisions, our annual gross income from non-qualifying hedges, together with any other income not generated from qualifying real estate assets, cannot exceed 25% of our annual gross income. In addition, our aggregate gross income from non-qualifying hedges, fees, and certain other non-qualifying sources cannot exceed 5% of our annual gross income. As a result, we might have to limit our use of advantageous hedging techniques or implement certain hedges through a taxable REIT subsidiary, or a TRS. This could increase the cost of our hedging activities or expose us to greater risks associated with changes in interest rates than we would otherwise want to bear.
Risks Associated with Our Operations
Through certain of our wholly-owned subsidiaries we have engaged in the past, and expect to continue to engage in, securitization transactions relating to residential mortgage loans. These types of transactions and investments expose us to potentially material risks.
A significant part of our business and growth strategy is to engage in various securitization transactions related to mortgage assets, and such transactions expose us to potentially material risks, including without limitation:
Financing Risk: Engaging in securitization transactions and other similar transactions generally require us to incur short-term debt on a recourse basis to finance the accumulation of residential mortgage loans. If investor demand for securitization transactions weakens, we may be unable to complete the securitization of loans accumulated for that purpose, which may hurt our business or financial results.
Diligence Risk: We engage in due diligence with respect to the loans or other assets we are securitizing and make representations and warranties relating to those loans and assets. When conducting due diligence, we rely on resources and data available to us and on a review of the collateral by third parties, each of which may be limited. We may also only conduct due diligence on a sample of a pool of loans or assets we are acquiring and assume that the sample is representative of the entire pool. Our due diligence efforts may not reveal matters which could lead to losses. If our due diligence process is not robust enough, or the scope of our due diligence is limited, we may incur losses. Losses could occur because a counterparty that sold us a loan or other asset refuses or is unable (e.g., due to its financial condition) to repurchase that loan or asset or pay damages to us if we determine after purchase that one or more of the representations or warranties made to us was inaccurate or because we don’t get a representation or warranty that covers a discovered defect or violation. In addition, losses with respect to such loans will be borne by us as the holder of the “first-loss” securities in our securitizations.
Disclosure and Indemnity Risk: When engaging in securitization transactions, we also prepare marketing and disclosure documentation, including term sheets and prospectuses, that include disclosures regarding the securitization transactions, the securitization transaction agreements and the assets being securitized. If our marketing and disclosure documentation are alleged or found to contain inaccuracies or omissions, we may be liable under federal and state securities laws (or under other laws) for damages to third parties that invest in these securitization transactions, including in circumstances where we relied on a third party in preparing accurate disclosures, or we may incur other expenses and costs disputing these allegations or settling claims. Additionally, we typically retain various third-party service providers when we engage in securitization transactions, including underwriters, trustees, administrative and paying agents, servicers and custodians, among others. We frequently contractually agree to indemnify these service providers against various claims and losses they may suffer from providing these services to us or the securitization trust. If any of these service providers are liable for damages to third parties that have invested in these securitization transactions, we may incur costs and expenses because of these indemnities.
Documentation Defects: In recent years, there has also been debate as to whether there are defects in the legal process and legal documents governing transactions in which securitization trusts and other secondary purchasers take legal ownership of residential mortgage loans and establish their rights as priority lien holders on underlying mortgaged property. If there are problems with the establishment of title and lien priority rights or transferred, securitization transactions that we sponsored and third-party sponsored securitizations that we hold investments in may experience losses, which could expose us to losses and could damage our ability to engage in future securitization transactions.
Our ability to profitably execute or participate in future securitizations transactions, including securitizations of residential mortgage loans, is dependent on numerous factors and if we are not able to achieve our desired level of profitability or if we incur losses when executing or participating in future securitizations it could have a material adverse impact on our business and financial results.
There are many factors that can have a significant impact on whether a securitization transaction that we execute or participate in is profitable to us or results in a loss. One of these factors is the price we pay for the mortgage loans that we securitize, which, in the case of residential mortgage loans, is impacted by the level of competition in the marketplace for acquiring
18
residential mortgage loans and the relative desirability to originators or other financial institutions of retaining residential mortgage loans as investments or selling them to third parties such as us. The cost of the short-term debt we use to finance our mortgage loan before securitization impacts the profitability of our securitization transactions. This short-term debt cost is affected by several factors including its availability to us, its interest rate, its duration, and the percentage of our mortgage loans that third parties are willing to provide short-term financing.
After we acquire mortgage loans that we intend to securitize, we can also suffer losses if the value of those loans declines before securitization. Declines in the value of a residential mortgage loan, for example, can be due to, among other things, changes in interest rates, changes in the credit quality of the loan, and changes in the projected yields required by investors to invest in securitization transactions. To the extent we seek to hedge against a decline in loan value due to changes in interest rates, there is a cost of hedging that also affects whether a securitization is profitable.
The price that investors in mortgage-backed securities will pay for securities issued in our securitization transactions also has a significant impact on the profitability of the transactions to us, and these prices are impacted by numerous market forces and factors. In addition, the underwriter(s) or placement agent(s) we select for securitization transactions, and the terms of their engagement and the transaction costs incurred in such securitizations can also impact the profitability of our securitizations. Also, any liability that we may incur, or may be required to reserve for when executing a transaction can cause a loss to us. To the extent that we are not able to profitably execute future securitizations of residential mortgage loans or other assets, including for the reasons described above or for other reasons, it could have a material adverse impact on our business and financial results.
We rely on third parties to perform certain services particularly as it relates to servicing, comply with applicable laws and regulations, and carry out contractual covenants and terms, the failure of which by any of these third parties may adversely impact our business and financial results.
To conduct our business of acquiring loans, engaging in securitization transactions, and investing in third-party issued securities and other assets, we rely on third party service providers to perform certain services, comply with applicable laws and regulations, and carry out contractual covenants and terms. Thus, we are subject to the risks associated with a third party’s failure to perform, including failure to perform due to reasons such as fraud, negligence, errors, miscalculations, or insolvency. For example, if loan servicers experience higher volumes of delinquent loans than they have in the past, there is a risk that their operational infrastructures may not be able to properly process this increased volume. Many loan servicers have been accused of improprieties in the handling of the loan mitigation and foreclosure processes with respect to residential mortgage loans that have gone into default. If a third-party loan servicer fails to fully and properly perform its obligations, loans and securities that we hold as investments may experience losses and securitizations that we have sponsored may experience poor performance, and our ability to engage in future securitization transactions could be harmed.
For a majority of the loans that we hold and securitize, we hold the right to service those loans and we retain a sub-servicer to service those loans. In these circumstances, we are exposed to certain risks, including, without limitation, that we may not be able to enter sub-servicing agreements on favorable terms to us or at all, or that the sub-servicer may not properly service the loan in compliance with applicable laws and regulations or the contractual provisions governing their sub-servicing role, and that we would be held liable for the sub-servicer’s improper acts or omissions. Additionally, in its capacity as a servicer of residential mortgage loans, a sub-servicer will have access to borrowers’ non-public personal information, and we could incur liability for a data breach relating to a sub-servicer or misuse or mismanagement of data by a sub-servicer. We also rely on technology infrastructure and systems of third parties who provide services to us and with whom we transact business. To the extent any one sub-servicer counterparty services a significant percentage of the loans with respect to which we own the servicing rights, the risks associated with our use of that sub-servicer are concentrated around this single sub-servicer counterparty. To the extent that there are significant amounts of advances that need to be funded in respect of loans where we own the servicing right, it could have a material adverse effect on our business and financial results.
We also rely on corporate trustees to act on behalf of us in enforcing our rights as security holders. Under the terms of most RMBS we hold, we do not have the right to directly enforce remedies against the issuer of the security but instead must rely on a trustee to act on behalf of us and other security holders. Should a trustee not be required to act under the terms of the securities, or fail to act, we could experience losses.
We utilize third party analytical models and data to value our investments, and any incorrect, misleading or incomplete information used in connection therewith would subject us to potential risks.
Given the complexity of our investments and strategies, we rely heavily on analytical models and information and data supplied by third-parties, or Third Party Data. Third Party Data is used to value investments or potential investments and to hedge our investments. When we rely on Third Party Data that proves to be incorrect, misleading or incomplete, our decisions expose us
19
to potential risks. For example, by relying on Third Party Data, especially valuation models, we may be induced to buy certain investments at prices that are too high, to sell certain other investments at prices that are too low, or to miss favorable opportunities altogether. Similarly, any hedging based on faulty Third-Party Data may prove to be unsuccessful. Furthermore, any valuations of our investments that are based on valuation models may prove to be incorrect.
These risks include the following: (i) collateral cash flows and/or liability structures may be incorrectly modeled in all or only certain scenarios, or may be modeled based on simplifying assumptions that lead to errors; (ii) information about collateral may be incorrect, incomplete, or misleading; (iii) collateral or bond historical performance (such as historical prepayments, defaults, cash flows, etc.) may be incorrectly reported, or subject to interpretation (e.g., different issuers may report delinquency statistics based on different definitions of what constitutes a delinquent loan); or (iv) collateral or bond information may be outdated, in which case the models may contain incorrect assumptions as to what has occurred since the date information was last updated.
Some of the Third-Party Data we use, such as mortgage prepayment models or mortgage default models, are predictive in nature. The use of predictive models has inherent risks. For example, such models may incorrectly forecast future behavior, leading to potential losses on a cash flow and/or a mark-to-market basis. In addition, the predictive models we use may differ substantially from those models used by other market participants, with the result that valuations based on these predictive models may be substantially higher or lower for certain investments than actual market prices. Furthermore, since predictive models are usually constructed based on historical data supplied by third-parties, the success of relying on such models may depend heavily on the accuracy and reliability of the supplied historical data and the ability of these historical models to accurately reflect future periods.
All valuation models rely on correct market data inputs. Certain assumptions used as inputs to the models may be based on historical trends and these trends may not be indicative of future results. If incorrect market data is used, even a well-designed valuation model may result in incorrect valuations. Even if market data is appropriately captured in the model, the resulting “model prices” will often differ substantially from market prices, especially for securities with complex characteristics, such as derivative securities.
Risks Related to Regulatory Matters and Our 1940 Act Exemption
Our business is subject to extensive regulation.
Our business is subject to extensive regulation by federal and state governmental authorities, self-regulatory organizations, and securities exchanges. We are required to comply with numerous federal and state laws. The laws, rules and regulations comprising this regulatory framework change frequently, as can the interpretation and enforcement of existing laws, rules, and regulations. Some of the laws, rules and regulations to which we are subject are intended primarily to safeguard and protect consumers, rather than stockholders or creditors. From time to time, we may receive requests from federal and state agencies for records, documents, and information regarding our policies, procedures, and practices regarding our business activities. We incur significant ongoing costs to comply with these government regulations.
Although we do not originate or directly service residential mortgage loans, we must comply with various federal and state laws, rules, and regulations because we purchase residential mortgage loans. These rules generally focus on consumer protection and include, among others, rules promulgated under the Dodd-Frank Act and the Gramm-Leach-Bliley Financial Modernization Act of 1999. These requirements can and do change as statutes and regulations are enacted, promulgated, amended, and interpreted, and the recent trend among federal and state lawmakers and regulators have been toward increasing laws, regulations, and investigative proceedings concerning the mortgage industry generally. Although we believe that we have structured our operations and investments to comply with existing legal and regulatory requirements and interpretations, changes in regulatory and legal requirements, including changes in their interpretation and enforcement by lawmakers and regulators, could materially and adversely affect our business and our financial condition, liquidity, and results of operations.
Loss of our 1940 Act exemption would adversely affect us and negatively affect the market price of shares of our capital stock and our ability to distribute dividends.
We conduct our operations so that neither we nor any of our subsidiaries are required to register as an investment company under the 1940 Act. Section 3(a)(1)(A) of the 1940 Act defines an investment company as any issuer that is or holds itself out as being engaged primarily in the business of investing, reinvesting, or trading in securities. Section 3(a)(1)(C) of the 1940 Act defines an investment company as any issuer that is engaged or proposes to engage in the business of investing, reinvesting, owning, holding, or trading in securities and owns or proposes to acquire investment securities having a value exceeding 40% of the value of the issuer’s total assets (exclusive of U.S. Government securities and cash items) on an unconsolidated basis, which we refer to as the 40% test. Excluded from the term “investment securities,” among other things, are U.S. government securities and securities issued by majority-owned subsidiaries that are not themselves investment companies and are not
20
relying on the exclusion from the definition of investment company set forth in Section 3(c)(1) of Section 3(c)(7) of the 1940 Act.
Because we are a holding company that conducts its businesses primarily through wholly-owned subsidiaries and majority-owned subsidiaries, the securities issued by these subsidiaries that are excepted from the definition of “investment company” under Section 3(c)(1) or Section 3(c)(7) of the 1940 Act, together with any other investment securities we may own, may not have a combined value in excess of 40% of the value of our adjusted total assets on an unconsolidated basis. This requirement limits the types of businesses in which we may engage through our subsidiaries. In addition, the assets we and our subsidiaries may acquire are limited by the provisions of the 1940 Act, the rules and regulations promulgated under the 1940 Act and SEC staff interpretative guidance, which may adversely affect our performance.
If the value of securities issued by our subsidiaries that are excepted from the definition of “investment company” by Section 3(c)(1) or 3(c)(7) of the 1940 Act, together with any other investment securities we own, exceeds 40% of our adjusted total assets on an unconsolidated basis, or if one or more of such subsidiaries fail to maintain an exception or exemption from the 1940 Act, we could, among other things, be required either (a) to substantially change the manner in which we conduct our operations to avoid being required to register as an investment company or (b) to register as an investment company under the 1940 Act, either of which could have an adverse effect on us and the market price of our securities. If we were required to register as an investment company under the 1940 Act, we would become subject to substantial regulation with respect to our capital structure (including our ability to use leverage), management, operations, transactions with affiliated persons (as defined in the 1940 Act), portfolio composition, including restrictions with respect to diversification and industry concentration, and other matters.
Certain of our subsidiaries rely on the exemption from registration provided by Section 3(c)(5)(C) of the 1940 Act. Section 3(c)(5)(C) as interpreted by the staff of the SEC, requires us to invest at least 55% of our assets in “mortgages and other liens on and interest in real estate”, or Qualifying Real Estate Assets, and at least 80% of our assets in Qualifying Real Estate Assets plus real estate related assets. The assets that we acquire, therefore, are limited by the provisions of the 1940 Act and the rules and regulations promulgated under the 1940 Act. If the SEC determines that any of our securities are not Qualifying Real Estate Assets or real estate related assets or otherwise believes we do not satisfy the exemption under Section 3(c)(5)(C), we could be required to restructure our activities or sell certain of our assets. The net effect of these factors will be to lower our net interest income. If we fail to qualify for exemption from registration as an investment company, our ability to use leverage would be substantially reduced, and we would not be able to conduct our business as described. Our business will be materially and adversely affected if we fail to qualify for this exemption.
Certain of our subsidiaries may rely on the exemption provided by Section 3(c)(6) which excludes from the definition of “investment company” any company primarily engaged, directly or through majority-owned subsidiaries, in a business, among others, described in Section 3(c)(5)(C) of the 1940 Act (from which not less than 25% of such company’s gross income during its last fiscal year was derived) together with an additional business or additional businesses other than investing, reinvesting, owning, holding or trading in securities. The SEC staff has issued little interpretive guidance with respect to Section 3(c)(6) and any guidance published by the staff could require us to adjust our strategy accordingly.
Certain of our subsidiaries may rely on Section 3(c)(7) for their 1940 Act exemption and, therefore our interest in each of these subsidiaries would constitute an “investment security” for purposes of determining whether we pass the 40% test.
Certain of our subsidiaries may rely on Rule 3a-7 which exempts certain securitization vehicles. There are numerous requirements that must be met to exclude such subsidiaries from the definition of an investment company. Our ability to manage assets held in a special purpose subsidiary that complies with Rule 3a-7 will be limited and we may not be able to purchase or sell assets owned by that subsidiary when we would otherwise desire to do so, which could lead to losses.
The determination of whether an entity is a majority-owned subsidiary of our company is made by us. The 1940 Act defines a majority-owned subsidiary of a person as a company of which 50% or more of the outstanding voting securities are owned by such person, or by another company which is a majority-owned subsidiary of such person. The 1940 Act further defines voting securities as any security presently entitling the owner or holder thereof to vote for the election of directors of a company. We treat companies in which we own at least a majority of the outstanding voting securities as majority-owned subsidiaries for purposes of the 40% test. We have not requested the SEC to approve our treatment of any company as a majority-owned subsidiary and the SEC has not done so. If the SEC were to disagree with our treatment of one or more companies as majority-owned subsidiaries, we would need to adjust our strategy and our assets to continue to pass the 40% test. Any such adjustment in our strategy could have a material adverse effect on us.
There can be no assurance that the laws and regulations governing the 1940 Act status of REITs, including the Division of Investment Management of the SEC providing more specific or different guidance regarding these exemptions, will not change
21
in a manner that adversely affects our operations. If we or our subsidiaries fail to maintain an exception or exemption from the 1940 Act, we could, among other things, be required either to (a) change the manner in which we conduct our operations to avoid being required to register as an investment company, (b) effect sales of our assets in a manner that, or at a time when, we would not otherwise choose to do so, or (c) register as an investment company, any of which could negatively affect the value of our capital stock, the sustainability of our business model, and our ability to make distributions which could have an adverse effect on our business and the market price for our shares of capital stock.
Rapid changes in the values of our MBS, residential mortgage loans, and other real estate-related investments may make it more difficult for us to maintain our qualification as a REIT or our exemption from the 1940 Act.
If the market value or income potential of our MBS, residential mortgage loans, and other real estate-related investments declines because of increased interest rates, prepayment rates or other factors, we may need to increase our real estate investments and income or liquidate our non-qualifying assets to maintain our REIT qualification or our exemption from the 1940 Act. If the decline in real estate asset values or income occurs quickly, this may be especially difficult to accomplish. This difficulty may be exacerbated by the illiquid nature of any non-real estate assets we may own. We may have to make investment decisions that we otherwise would not make absent the REIT and 1940 Act considerations.
We are required to obtain various state licenses to purchase mortgage loans in the secondary market and there is no assurance we will be able to obtain or maintain those licenses.
While we are not required to obtain licenses to purchase mortgage-backed securities, the purchase of residential mortgage loans in the secondary market may, in some circumstances, require us to maintain various state licenses. Acquiring the right to service residential mortgage loans may also, in some circumstances, require us to maintain various state licenses even though we currently do not expect to directly engage in loan servicing ourselves. Thus, we could be delayed in conducting certain business if we were first required to obtain a state license. We cannot assure you that we will be able to obtain all the licenses we need or that we would not experience significant delays in obtaining these licenses. Furthermore, once licenses are issued, we are required to comply with various information reporting and other regulatory requirements to maintain those licenses, and there is no assurance that we will be able to satisfy those requirements or other regulatory requirements applicable to our business of acquiring residential mortgage loans on an ongoing basis. Our failure to obtain or maintain required licenses or our failure to comply with regulatory requirements that are applicable to our business of acquiring residential mortgage loans may restrict our business and investment options and could harm our business and expose us to penalties or other claims.
We Have an Ownership Interest in a Registered Investment Adviser
We own 24.9% of a newly formed registered investment adviser and we are the sole investor in a fund managed by that adviser. While we believe we have structured our investment so that we are not deemed a “control person” with respect to that adviser such as our equity interest is non-voting; we do not have consent rights to the budget or other significant control rights; none of our employees is an officer of the adviser, or have any consent rights or other control of the adviser’s personnel; and we do not have a board seat or similar role in the oversight of the adviser, we cannot assure you that the SEC or a court will not determine that we are a “control person”. Control Persons may be held liable for violations committed by persons under their control. Sanctions the SEC may impose on control persons include industry bars and suspensions, financial penalties, disgorgement of financial proceeds obtained through the violation, and cease and desist orders. Civil litigants may recover financial compensation from control persons for damages suffered because of misconduct by controlled persons. Control persons are not automatically liable for violations committed by the persons under their control. It is a defense to regulatory and private civil liability if the control person acted in good faith and did not induce the act or acts constituting the violation or cause of action. This defense can be established by showing that the control person exercised due care in his supervision of the violator’s activities by maintaining and enforcing a reasonable and proper system of supervision and internal control.
U.S. Federal Income Tax Risks
Your investment has various U.S. federal income tax risks.
This summary of certain tax risks is limited to the U.S. federal tax risks addressed below. Additional risks or issues may exist that are not addressed in this Form 10-K and that could affect the U.S. federal tax treatment of us or our stockholders. This is not intended to be used and cannot be used by any stockholder to avoid penalties that may be imposed on stockholders under the Code. We strongly urge you to seek advice based on your particular circumstances from an independent tax advisor concerning the effects of U.S. federal, state and local income tax law on an investment in common stock or preferred stock and on your individual tax situation.
Complying with REIT requirements may cause us to forego otherwise attractive opportunities.
22
To maintain our qualification as a REIT for U.S. federal income tax purposes, we must continually satisfy various tests regarding the sources of our income, the nature and diversification of our assets, the amounts we distribute to our stockholders and the ownership of our stock. To meet these tests, we may be required to forego investments we might otherwise make. We may be required to make distributions to stockholders at disadvantageous times or when we do not have funds readily available for distribution. Thus, compliance with the REIT requirements may hinder our investment performance.
Complying with REIT requirements may force us to liquidate otherwise attractive investments.
To maintain our qualification as a REIT, we generally must ensure that at the end of each calendar quarter at least 75% of the value of our total assets consists of cash, cash items, government securities and qualifying real estate assets, including certain mortgage loans and mortgage-backed securities. The remainder of our investments in securities (other than government securities and qualifying real estate assets) generally cannot include more than 10% of the outstanding voting securities of any one issuer or more than 10% of the total value of the outstanding securities of any one issuer. In addition, in general, no more than 5% of the value of our assets (other than government securities, qualifying real estate assets, and stock in one or more TRSs) can consist of the securities of any one issuer, and no more than 20% of the value of our total assets can be represented by securities of one or more TRSs. If we fail to comply with these requirements at the end of any quarter, we must correct the failure within 30 days after the end of such calendar quarter or qualify for certain statutory relief provisions to avoid losing our REIT status and suffering adverse tax consequences. Thus, we may be required to liquidate from our portfolio otherwise attractive investments. These actions could have the effect of reducing our income and amounts available for distribution to our stockholders.
Failure to qualify as a REIT would subject us to U.S. federal income tax, which would reduce the cash available for distribution to our stockholders.
We have elected to be treated as a REIT for U.S. federal income tax purposes and intend to operate so that we will qualify as a REIT. However, the U.S. federal income tax laws governing REITs are extremely complex, and interpretations of the U.S. federal income tax laws governing qualification as a REIT are limited. Qualifying as a REIT requires us to meet various tests regarding the nature of our assets and our income, the ownership of our outstanding stock, and the amount of our distributions on an ongoing basis. While we intend to operate so as to maintain our qualification as a REIT, given the highly complex nature of the rules governing REITs, the ongoing importance of factual determinations, including the tax treatment of certain investments we may make, and the possibility of future changes in our circumstances, no assurance can be given that we will so qualify for any particular year. If we fail to qualify as a REIT in any calendar year and we do not qualify for certain statutory relief provisions, we would be required to pay U.S. federal income tax on our taxable income at regular corporate income tax rates. We might need to borrow money or sell assets to pay any such tax. Our payment of income tax would decrease the amount of our income available for distribution to our stockholders. Furthermore, if we fail to maintain our qualification as a REIT and we do not qualify for certain statutory relief provisions, we no longer would be required to distribute substantially all our REIT taxable income to our stockholders. Unless our failure to qualify as a REIT was excused under U.S. federal tax laws, we would be disqualified from taxation as a REIT for the four taxable years following the year during which qualification was lost.
Potential characterization of distributions or gain on sale may be treated as unrelated business taxable income to tax-exempt investors.
If (1) all or a portion of our assets are subject to the rules relating to taxable mortgage pools, (2) we are a ‘‘pension-held REIT,’’ or (3) a tax-exempt stockholder has incurred debt to purchase or hold our capital stock, then a portion of the distributions to and, in the case of a stockholder described in clause (3), gains realized on the sale of capital stock by such tax-exempt stockholder may be subject to U.S. federal income tax as unrelated business taxable income under the Code.
Classification of our securitizations or financing arrangements as a taxable mortgage pool could subject us or certain of our stockholders to increased taxation.
We intend to structure our securitization and financing arrangements so as to not create a taxable mortgage pool. However, if we have borrowings with two or more maturities and, (1) those borrowings are secured by mortgages or mortgage-backed securities and (2) the payments made on the borrowings are related to the payments received on the underlying assets, then the borrowings and the pool of mortgages or mortgage-backed securities to which such borrowings relate may be classified as a taxable mortgage pool under the Code. If any part of our investments were to be treated as a taxable mortgage pool, then our REIT status would not be impaired, but a portion of the taxable income we recognize may, under regulations to be issued by the Treasury Department, be characterized as ‘‘excess inclusion’’ income and allocated among our stockholders to the extent of and generally in proportion to the distributions we make to each stockholder. Any excess inclusion income would:
23
• |
not be allowed to be offset by a stockholder’s net operating losses; |
• |
be subject to a tax as unrelated business income if a stockholder were a tax-exempt stockholder; |
• |
be subject to the application of U.S. federal withholding tax at the maximum rate (without reduction for any otherwise applicable income tax treaty) with respect to amounts allocable to foreign stockholders; and |
• |
be taxable (at the highest corporate tax rate) to us, rather than to our stockholders, to the extent the excess inclusion income relates to stock held by disqualified organizations (generally, tax-exempt organizations not subject to tax on unrelated business income, including governmental organizations). |
Failure to make required distributions would subject us to tax, which would reduce the cash available for distribution to our stockholders.
To maintain our qualification as a REIT, we must distribute to our stockholders each calendar year at least 90% of our REIT taxable income (excluding certain items of non-cash income in excess of a specified threshold), determined without regard to the deduction for dividends paid and excluding net capital gain. To the extent that we satisfy the 90% distribution requirement, but distribute less than 100% of our taxable income, we will be subject to federal corporate income tax on our undistributed income. In addition, we will incur a 4% nondeductible excise tax on the amount, if any, by which our distributions in any calendar year are less than the sum of:
• |
85% of our REIT ordinary income for that year; |
• |
95% of our REIT capital gain net income for that year; and |
• |
any undistributed taxable income from prior years. |
We intend to distribute our REIT taxable income to our stockholders in a manner intended to satisfy the 90% distribution requirement and to avoid both corporate income tax and the 4% nondeductible excise tax. REIT taxable income only includes after-tax TRS net income to the extent such TRS distributes a dividend to the REIT. Therefore, our REIT dividend distributions may or may not include after-tax net income from our TRSs.
Our taxable income may substantially exceed our net income as determined by GAAP. As an example, realized capital losses may be included in our GAAP net income, but may not be deductible in computing our taxable income. In addition, we may invest in assets that generate taxable income in excess of economic income or in advance of the corresponding cash flow from the assets. This may be more likely under the new rules regarding the timing of income on debt securities. To the extent that we generate such non-cash taxable income in a taxable year, we may incur corporate income tax and the 4% nondeductible excise tax on that income if we do not distribute such income to stockholders in that year. In that event, we may be required to use cash reserves, incur debt, or liquidate non-cash assets at rates or at times that we regard as unfavorable to satisfy the distribution requirement and to avoid corporate income tax and the 4% nondeductible excise tax in that year. Moreover, our ability to distribute cash may be limited by available financing facilities. Therefore, our dividend payment level may fluctuate significantly, and, under some circumstances, we may not pay dividends at all.
Our ownership of and relationship with our TRSs will be limited, and a failure to comply with the limits would jeopardize our REIT status and may result in the application of a 100% excise tax.
A REIT may own up to 100% of the equity of one or more TRSs. A TRS may earn income that would not be qualifying income if earned directly by the parent REIT. Both the subsidiary and the REIT must jointly elect to treat the subsidiary as a TRS. Overall, no more than 20% of the value of a REIT’s assets may consist of stock or securities of one or more TRSs. A TRS will pay U.S. federal, state and local income tax at regular corporate rates on any taxable income that it earns. In addition, the TRS rules impose a 100% excise tax on certain transactions between a TRS and its parent REIT that are not conducted on an arm’s-length basis. Our TRS after-tax net income would be available for distribution to us but would not be required to be distributed to us. We anticipate that the aggregate value of the TRS stock and securities owned by us will be less than 20% of the value of our total assets (including the TRS stock and securities). Furthermore, we will monitor the value of our investments in our TRSs to ensure compliance with the rule that no more than 20% of the value of our assets may consist of TRS stock and securities (which is applied at the end of each calendar quarter). In addition, we will scrutinize all our transactions with TRSs to ensure that they are entered on arm’s-length terms to avoid incurring the 100% excise tax described above. There can be no assurance, however, that we will be able to comply with the 20% limitation discussed above or to avoid application of the 100% excise tax discussed above.
The tax on prohibited transactions will limit our ability to engage in transactions, including certain methods of securitizing mortgage loans, that would be treated as sales for U.S. federal income tax purposes.
24
A REIT’s net income from prohibited transactions is subject to a 100% tax. In general, prohibited transactions are sales or other dispositions of property, other than foreclosure property, but including mortgage loans, held primarily for sale to customers in the ordinary course of business. We might be subject to this tax if we sold or securitized our assets in a manner that was treated as a sale for U.S. federal income tax purposes. Therefore, to avoid the prohibited transactions tax, we may choose not to engage in certain sales of assets at the REIT level and may securitize assets only in transactions that are treated as financing transactions and not as sales for tax purposes even though such transactions may not be the optimal execution on a pre-tax basis. We could avoid any prohibited transactions tax concerns by engaging in securitization transactions through a TRS, subject to certain limitations described above. To the extent that we engage in such activities through domestic TRSs, the income associated with such activities will be subject to U.S. federal (and applicable state and local) corporate income tax. There can be no assurance, however, that we will avoid the application of the 100% tax on net income from prohibited transactions described above.
The interest apportionment rules may affect our ability to comply with the REIT asset and gross income tests.
The mortgage loans we acquire may be subject to the interest apportionment rules under Treasury Regulations Section 1.856-5(c), or the Interest Apportionment Regulation, which generally provides that if a mortgage is secured by both real property and other property, a REIT is required to apportion its annual interest income for purposes of the REIT 75% gross income test. If a mortgage is secured by both real property and personal property and the value of the personal property does not exceed 15% of the aggregate value of the property securing the mortgage, the mortgage is treated as secured solely by real property for this purpose.
For purposes of the asset tests applicable to REITs, Revenue Procedure 2014-51 provides a safe harbor under which the IRS will generally not challenge a REIT’s treatment of a loan as being in part a real estate asset in an amount equal to the lesser of the fair market value of the loan or the fair market value of the real property securing the loan at certain relevant testing dates. We believe that all of the mortgage loans that we acquire are secured only by real property. Therefore, we believe that the Interest Apportionment Regulation does not apply to our portfolio.
Nevertheless, if the IRS were to assert successfully that our mortgage loans were secured by property other than real estate, that the Interest Apportionment Regulation applied for purposes of our REIT testing, and that the position taken in Revenue Procedure 2014-51 should be applied to our portfolio, then we might not be able to meet the REIT 75% gross income test, and possibly the asset tests applicable to REITs. If we did not meet these tests, we could lose our REIT status or be required to pay a tax penalty to the IRS.
Even if we remain qualified as a REIT, we may face other tax liabilities that reduce our cash flow.
Even if we remain qualified for taxation as a REIT, we may be subject to certain U.S. federal, state and local taxes on our income and assets, including taxes on any undistributed income, tax on income from some activities conducted because of a foreclosure, excise taxes, state or local income, property and transfer taxes, such as mortgage recording taxes, and other taxes. In addition, to meet the REIT qualification requirements, prevent the recognition of certain types of non-cash income, or to avert the imposition of a 100% tax that applies to certain gains derived by a REIT from dealer property or inventory, we may hold some of our assets through our TRSs or other subsidiary corporations that will be subject to corporate-level income tax at regular corporate rates. In certain circumstances, the ability of our TRSs to deduct net interest expense may be limited. Any of these taxes would decrease cash available for distribution to our stockholders.
We may be subject to adverse legislative or regulatory tax changes that could reduce the market price of our capital stock.
At any time, the U.S. federal income tax laws or regulations governing REITs or the administrative interpretations of those laws or regulations may be amended. We cannot predict when or if any new U.S. federal income tax law, regulation or administrative interpretation, or any amendment to any existing U.S. federal income tax law, regulation or administrative interpretation, will be adopted, promulgated or become effective and any such law, regulation or interpretation may take effect retroactively. We and our stockholders could be adversely affected by any such change in, or any new, U.S. federal income tax law, regulation or administrative interpretation.
Risks Related to Our Organization and Structure
Certain provisions of Maryland Law, of our charter, and of our bylaws contain provisions that may inhibit potential acquisition bids that stockholders may consider favorable, and the market price of our capital stock may be lower as a result.
25
• |
There are ownership limits and restrictions on transferability and ownership in our charter. To qualify as a REIT, not more than 50% of the value of our outstanding stock may be owned, directly or constructively, by five or fewer individuals during the second half of any calendar year. To assist us in satisfying this test, among other things, our charter generally prohibits any person or entity from beneficially or constructively owning more than 9.8% in value or number of shares, whichever is more restrictive, of any class or series of our outstanding capital stock. This restriction may discourage a tender offer or other transactions or a change in the composition of our Board of Directors or control that might involve a premium price for our shares or otherwise be in the best interests of our stockholders and any shares issued or transferred in violation of such restrictions being automatically transferred to a trust for a charitable beneficiary, thereby resulting in a forfeiture of the additional shares.
|
• |
Our charter permits our Board of Directors to issue stock with terms that may discourage a third party from acquiring us. Our charter permits our Board of Directors to amend the charter without stockholder approval to increase the total number of authorized shares of stock or the number of shares of any class or series and to issue common or preferred stock, having preferences, conversion or other rights, voting powers, restrictions, limitations as to dividends or other distributions, qualifications, or terms or conditions of redemption as determined by our board. Thus, our board could authorize the issuance of stock with terms and conditions that could have the effect of discouraging a takeover or other transaction in which holders of some or a majority of our shares might receive a premium for their shares over the then-prevailing market price of our shares.
|
• |
Maryland Control Share Acquisition Act. Maryland law provides that holders of ‘‘control shares’’ of our company (defined as voting shares of stock which, when aggregated with all other shares controlled by the acquiring stockholder, entitle the stockholder to exercise one of three increasing ranges of voting power in electing directors) acquired in a “control share acquisition” (defined as the direct or indirect acquisition of ownership or control of “control shares”) have no voting rights except to the extent approved by our stockholders by the affirmative vote of at least two-thirds of all the votes entitled to be cast on the matter, excluding all interested shares. Our bylaws provide that we are not subject to the “control share” provisions of Maryland law. Our Board, however, may elect to make the “control share” statute applicable to us at any time and may do so without stockholder approval.
|
• |
Business Combinations. We are subject to the “business combination” provisions of Maryland law that, subject to limitations, prohibit certain business combinations (including a merger, consolidation, share exchange, or, in circumstances specified in the statute, an asset transfer or issuance or reclassification of equity securities) between us and an “interested stockholder” (defined generally as any person who beneficially owns 10% or more of our then outstanding voting capital stock or an affiliate or associate of ours who, at any time within the two‑year period before the date in question, was the beneficial owner of 10% or more of our then outstanding voting capital stock) or an affiliate thereof for five years after the most recent date on which the stockholder becomes an interested stockholder. After the five‑year prohibition, any business combination between us and an interested stockholder generally must be recommended by our board of directors and approved by the affirmative vote of at least (i) 80% of the votes entitled to be cast by holders of outstanding shares of our voting capital stock and (ii) two‑thirds of the votes entitled to be cast by holders of voting capital stock of the corporation other than shares held by the interested stockholder with whom or with whose affiliate the business combination is to be effected or held by an affiliate or associate of the interested stockholder. These super‑majority voting requirements do not apply if our common stockholders receive a minimum price, as defined under Maryland law, for their shares in the form of cash or other consideration in the same form as previously paid by the interested stockholder for its shares. These provisions of Maryland law also do not apply to business combinations that are approved or exempted by a board of directors before the time that the interested stockholder becomes an interested stockholder. Pursuant to the statute, our board of directors has by resolution exempted business combinations between us and any other person, provided, that such business combination is first approved by our board of directors (including a majority of our directors who are not affiliates or associates of such person).
|
• |
Unsolicited Takeovers: The “unsolicited takeover” provisions of Maryland law, permit our board of directors, without stockholder approval and regardless of what is currently provided in our charter or bylaws, to implement takeover defenses. These provisions may have the effect of inhibiting a third-party from making an acquisition proposal for us or of delaying, deferring, or preventing a change in control of us under the circumstances that otherwise could provide the holders of shares of common stock with the opportunity to realize a premium over the then current market price.
|
• |
Staggered Board. Our Board of Directors is divided into three classes of directors. Directors of each class are chosen for three-year terms upon the expiration of their current terms, and each year one class of directors is elected by the stockholders. The staggered terms of our directors may reduce the possibility of a tender offer or an attempt at a change in control, even though a tender offer or change in control might be in the best interests of our stockholders.
|
26
Our rights and the rights of our stockholders to take action against our directors and officers are limited, which could limit stockholders’ recourse in the event of actions, not in their best interests.
Our charter limits the liability of our directors and officers to us and our stockholders for money damages, except for liability resulting from:
• |
actual receipt of an improper benefit or profit in money, property or services; or |
• |
a final judgment based upon a finding of active and deliberate dishonesty by the director or officer that was material to the cause of action adjudicated for which Maryland law prohibits such exemption from liability. |
In addition, our charter authorizes us to obligate our company to indemnify our present and former directors and officers for actions taken by them in those capacities to the maximum extent permitted by Maryland law. Our bylaws require us to indemnify each present or former director or officer, to the maximum extent permitted by Maryland law, in the defense of any proceeding to which he or she is made or threatened to be made, a party because of his or her service to us.
Risks Related to Our Capital Stock
The market price and trading volume of our shares of capital stock may be volatile.
The market price of shares of our capital stock, including our common and preferred stock, may be highly volatile and could be subject to wide fluctuations. Also, the trading volume in our shares of capital stock may fluctuate and cause significant price variations to occur. We cannot assure you that the market price of our shares of capital stock will not fluctuate or decline significantly in the future. Some of the factors that could negatively affect our share price or result in fluctuations in the price or trading volume of our shares of common and preferred stock include those set forth under “Risk Factors” and “Special Note Regarding Forward-Looking Statements” and in the information incorporated and deemed to be incorporated by reference herein.
Capital stock eligible for future sale may have adverse consequences for investors and adverse effects on our share price.
We cannot predict the effect, if any, of future sales of capital stock, or the availability of shares for future sales, on the market price of the capital stock. Sales of substantial amounts of capital stock, or the perception that such sales could occur, may adversely affect prevailing market prices for the common stock. In addition, we are not required to offer any such shares to existing shareholders on a pre-emptive basis. Therefore, it may not be possible for existing shareholders to participate in such future share issues, which may dilute the existing shareholders’ interests in us.
Future offerings of debt securities, which would rank senior to our capital stock upon liquidation, and future offerings of equity securities, which would dilute our existing stockholders and may be senior to our capital stock for the purposes of dividend and liquidating distributions, may adversely affect the market price of our capital stock.
In the future, we may attempt to increase our capital resources by making offerings of debt or additional offerings of equity securities, including commercial paper, senior or subordinated notes and series or classes of preferred stock or common stock. Upon liquidation, holders of our debt securities and shares of preferred stock, if any, and lenders with respect to other borrowings will receive a distribution of our available assets before the holders of our common stock. Additional equity offerings may dilute the holdings of our existing stockholders or reduce the market price of our capital stock, or both. Preferred stock, including our Series A, Series B, Series C, and Series D Preferred Stock may have a preference on liquidating distributions or a preference on dividend payments or both that could limit our ability to make a dividend distribution to the holders of our capital stock, including our common stock. Because our decision to issue securities in any future offering will depend on market conditions and other factors beyond our control, we cannot predict or estimate the amount, timing or nature of our future offerings. Thus, holders of our capital stock bear the risk of our future offerings reducing the market price of our capital stock and diluting their stock holdings in us.
There is a risk that you may not receive dividend distributions or those dividend distributions may decrease over time. Changes in the amount of dividend distributions we pay or in the tax characterization of dividend distributions we pay may adversely affect the market price of our common stock or may result in holders of our common stock being taxed on dividend distributions at a higher rate than initially expected.
Our dividend distributions are driven by a variety of factors, including our minimum dividend distribution requirements under the REIT tax laws and our REIT taxable income as calculated for tax purposes pursuant to the tax code. We generally intend to distribute to our common shareholders at least 90% of our REIT taxable income, although our reported financial results for GAAP purposes may differ materially from our REIT taxable income.
27
For 2018, we maintained a regular common dividend at a rate of $0.50 per share of common stock per quarter and in February 2019 our Board of Directors announced its intention to continue to pay regular dividends during 2019 at a rate of $0.50 per share of common stock per quarter. The announcement of the Board's intention does not create an obligation to maintain the regular quarterly common stock dividend at this rate, and despite this intention, we may reduce or eliminate our regular quarterly dividend during 2019. Our ability to pay a dividend of $0.50 per common share per quarter and the dividend on each series of our preferred stock at the stated dividend rate, per quarter in 2019 may be adversely affected by many factors, including the risk factors described herein. These same factors may affect our ability to pay other future dividends. In addition, to the extent we determine that future dividends would represent a return of capital to investors, rather than the distribution of income, we may determine to discontinue dividend payments until such time that dividends would again represent a distribution of income. Any reduction or elimination of our payment of dividend distributions would not only reduce the number of dividends you would receive as a holder of our common stock but could also have the effect of reducing the market price of our common stock.
We may not be able to pay dividends or other distributions on our Capital Stock.
Under Maryland law, no distributions on stock may be made if, after giving effect to the distribution, (i) the corporation would not be able to pay the indebtedness of the corporation as such indebtedness becomes due in the usual course of business or (ii) except in certain limited circumstances when distributions are made from net earnings, the corporation’s total assets would be less than the sum of the corporation’s total liabilities plus, unless the charter provides otherwise (which our charter does, with respect to any outstanding series of preferred stock), the amount that would be needed, if the corporation were to be dissolved at the time of the distribution, to satisfy the preferential rights upon dissolution of stockholders whose preferential rights on dissolution are superior to those receiving the distribution. There can be no guarantee that we will have sufficient cash to pay dividends on any series of our capital stock. Our ability to pay dividends may be impaired if any of the risks described in this Item 1A Risk Factors were to occur. In addition, payment of our dividends depends upon our earnings, our financial condition, maintenance of our REIT qualification and other factors as our board of directors may deem relevant from time to time. We cannot assure you that our business will generate sufficient cash flow from operations or that future borrowings will be available to us in an amount sufficient to enable us to make distributions on any series of our preferred stock.
Dividends payable by REITs generally do not qualify for the reduced tax rates available for some dividends.
The maximum U.S. federal income tax rate applicable to qualified dividend income payable to certain non-corporate U.S. holders is 20%. Dividends payable by REITs, however, generally are not eligible for the reduced qualified dividend rates. For taxable years beginning after December 31, 2017 and before January 1, 2026, non-corporate taxpayers may deduct up to 20% of certain pass-through business income, including “qualified REIT dividends” (generally, dividends received by a REIT shareholder that are not designated as capital gain dividends or qualified dividend income), subject to certain limitations, resulting in an effective maximum U.S. federal income tax rate of 29.6% on such income. Although the reduced U.S. federal income tax rate applicable to qualified dividend income does not adversely affect the taxation of REITs or dividends payable by REITs, the more favorable rates applicable to regular corporate qualified dividends and the reduced corporate tax rate (currently 21%) could cause certain non-corporate investors to perceive investments in REITs to be relatively less attractive than investments in the stocks of non-REIT corporations that pay dividends, which could adversely affect the value of the shares of REITs, including our stock.
Holders of our Preferred Stock have limited voting rights.
The voting rights of holders of any series of our outstanding preferred stock are limited. Our common stock is the only class of our securities that currently carries full voting rights. Holders of any series of our preferred stock may vote only (i) to elect, voting together as a single class, with holders of parity stock having similar voting rights two additional directors to our board of directors if six full quarterly dividends (whether or not consecutive) payable on any series of our preferred stock are in arrears, (ii) on amendments to our charter, including the articles supplementary designating any series of our outstanding preferred stock, that materially and adversely affect the rights of the holders of such series or (iii) to authorize or create, or increase the authorized or issued amount of, additional classes or series of Senior Stock.
Other Business Risks
Market conditions for mortgages and mortgage-related assets as well as the broader financial markets may materially adversely affect the value of the assets in which we invest.
Our results of operations are materially affected by conditions in the markets for mortgages and mortgage-related assets, including MBS, as well as the broader financial markets and the economy generally. Any decline in the value of our investments, or perceived market uncertainty about their value, would likely make it difficult for us to obtain financing on
28
favorable terms or at all, or maintain our compliance with terms of any financing arrangements already in place. Renewed volatility or deterioration in the broader residential mortgage and RMBS markets could materially adversely affect the performance and market value of our investments.
Changes in accounting rules could occur at any time and could impact us in significantly negative ways that we are unable to predict or protect against.
The Financial Accounting Standards Board, or the FASB, and other regulatory bodies that establish the accounting rules applicable to us have recently proposed or enacted a wide array of changes to accounting rules. Moreover, in the future, these regulators may propose additional changes that we do not currently anticipate. Changes to accounting rules that apply to us could significantly impact our business or our reported financial performance in ways that we cannot predict or protect against. We cannot predict whether any changes to current accounting rules will occur or what impact any codified changes will have on our business, results of operations, liquidity or financial condition, directly or through their impact on our business partners or counterparties.
We operate in a highly competitive market for investment opportunities and competitors may be able to compete more effectively for investment opportunities than we can.
We compete with other REITs, public and private funds, commercial and investment banks and commercial finance companies for investment opportunities. Many of our competitors are substantially larger and have considerably greater financial, technical and marketing resources than we do. Several other REITs have investment objectives that overlap with ours, which may create competition for investment opportunities. Some competitors may have a lower cost of funds and access to funding sources that are not available to us. In addition, some of our competitors may have higher risk tolerances or different risk assessments, which could allow them to consider a wider variety of investments and establish more favorable relationships than us. We cannot assure you that the competitive pressures we face will not have a material adverse effect on our business, financial condition and results of operations. Also, this competition may keep us from taking advantage of attractive investment opportunities from time to time, and we can offer no assurance that we will be able to identify and make investments that are consistent with our investment objectives.
We are dependent on information systems and their failure could significantly disrupt our business.
Our business is highly dependent on our information and communications systems. Any failure or interruption of our systems or cyber-attacks or security breaches of our networks or systems could cause delays or other problems in our investment activities as well as subject us to penalties, fines and other regulatory actions, which could have a material adverse effect on operating results, the market price of our common stock and other securities and our ability to pay dividends. We also face the risk of operational failure, termination, or capacity constraints of any of the third parties with which we do business or that facilitate our business activities, including clearing agents or other financial intermediaries we use to facilitate our securities transactions.
We are dependent on our executive officers and other key personnel for our success.
Our success is dependent upon the efforts, experience, diligence, skill, and network of business contacts of our executive officers and key personnel. The departure of any of our executive officers or key personnel could have a material adverse effect on our operations and performance.
We may change our investment strategy, asset allocation, or financing plans without stockholder consent, which may result in riskier investments.
We may change our investment strategy, asset allocation, or financing plans at any time without the consent of our stockholders, which could result in our making investments that are different from, and possibly riskier than, the investments described in this 2018 Form 10-K. A change in our investment strategy or financing plans may increase our exposure to interest rate and default risk and real estate market fluctuations. Furthermore, a change in our asset allocation could result in our making investments in asset categories different from those described in this 2018 Form 10-K. These changes could adversely affect the market price of our capital stock and our ability to make distributions to our stockholders.
We may engage in new business initiatives and invest in different types of assets that we are not accustomed to and these activities could expose us to new, different or increased risks.
We continually evaluate new business opportunities and investment strategies that may allow us to diversify our business. We have and may in the future invest in a variety of mortgage-related and other financial assets that may or may not be closely related to our existing business. Additionally, we may enter other operating businesses that may or may not be closely related to
29
our current business. These new assets or business operations may have new, different or increased risks than what we are currently exposed to in our business and we may not be able to manage these risks successfully. Additionally, when investing in new assets or businesses we will be exposed to the risk that those assets, or income generated by those assets or businesses, will affect our ability to meet the requirements to maintain our qualification as a REIT or our exemption from registration under the 1940 Act. If we are not able to successfully manage the risks associated with new asset types or businesses, it could have an adverse effect on our business, results of operations and financial condition.
Item 1B. Unresolved Staff Comments
None.
Item 2. Properties
As of December 31, 2018, we do not own any property. Our executive and administrative office is located in leased space at 520 Madison Avenue, 32nd Floor, New York, New York 10022, telephone (212) 626-2300. Our office lease expires on August 2021. We believe that this space is suitable and adequate for our current needs. In addition, we have leases through November, 2021, for our off-site back-up facilities and data centers located in Wappingers Falls, New York and Norwalk, Connecticut.
Item 3. Legal Proceedings
None.
Item 4. Mine Safety Disclosures
Not applicable.
Part II
Item 5. Market for Registrant's Common Equity, Related Stockholder Matters and Issuer Purchases of Equity Securities
Our common stock began trading publicly on the NYSE under the trading symbol “CIM” on November 16, 2007. As of January 31, 2019, we had 187,053,396 shares of common stock issued and outstanding which were held by 243 holders of record.
Dividends
We pay quarterly dividends and distribute to our stockholders all or substantially all of our taxable income in each year (subject to certain adjustments). This enables us to qualify for the tax benefits accorded to a REIT under the Code. While our Board of Directors announced its intention to continue to pay regular dividends during 2019 at a rate of $0.50 per share of common stock per quarter, we have not established a set minimum dividend payment level and our ability to pay dividends may be adversely affected for the reasons described under the caption “Risk Factors.” All distributions will be made at the discretion of our Board of Directors and will depend on our taxable income, our financial condition, maintenance of our REIT status and such other factors as our Board of Directors may deem relevant from time to time.
The Board of Directors declared dividends of $2.00 per share during 2018 and 2017.
Purchases of Equity Securities
In February 2018, our Board of Directors reauthorized $100 million under our share repurchase program, or the Repurchase Program. Such authorization does not have an expiration date and, at present, there is no intention to modify or otherwise rescind such authorization. Shares of our common stock may be purchased in the open market, including through block purchases, through privately negotiated transactions, or pursuant to any trading plan that may be adopted in accordance with Rule 10b5-1 of the Securities Exchange Act of 1934, as amended. The timing, manner, price and amount of any repurchases will be determined at our discretion and the program may be suspended, terminated or modified at any time for any reason. Among other factors, the Company intends to only consider repurchasing shares of our common stock when the purchase price is less than the last publicly reported book value per common share. In addition, the Company does not intend to repurchase any shares from directors, officers or other affiliates. The program does not obligate the Company to acquire any specific number of
30
shares, and all repurchases will be made in accordance with Rule 10b-18, which sets certain restrictions on the method, timing, price and volume of stock repurchases.
Pursuant to our Repurchase Program, the Company repurchased approximately 883 thousand shares of its common stock at an average price of $16.81 per share for a total of $15 million during the year ended December 31, 2018.
Share Performance Graph
The following graph and table set forth certain information comparing the yearly percentage change in cumulative total return on our common stock to the cumulative total return of the Standard & Poor’s Composite-500 Stock Index or S&P 500 Index, and the Bloomberg REIT Mortgage Index, or BBG REIT Index, an industry index of mortgage REITs. The comparison is for the period from December 31, 2013 to December 31, 2018 and assumes the reinvestment of dividends. The graph and table assume that $100 was invested in our common stock and each of the two other indices on December 31, 2013.
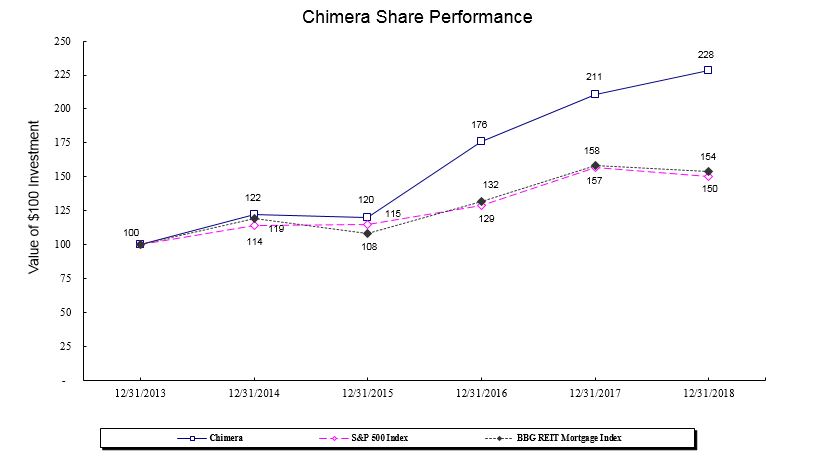
12/31/2013 |
12/31/2014 |
12/31/2015 |
12/31/2016 |
12/31/2017 |
12/31/2018 |
|||||||
Chimera |
100 |
122 |
120 |
176 |
211 |
228 |
||||||
S&P 500 Index |
100 |
114 |
115 |
129 |
157 |
150 |
||||||
BBG REIT Index |
100 |
119 |
108 |
132 |
158 |
154 |
||||||
The information in the share performance graph and table has been obtained from sources believed to be reliable, but neither its accuracy nor its completeness can be guaranteed. The historical information set forth above is not necessarily indicative of future performance. Accordingly, we do not make or endorse any predictions as to future share performance.
The share performance graph and table shall not be deemed, under the Securities Act of 1933, as amended, or the Securities Exchange Act of 1934, as amended, to be (i) “soliciting material” or “filed” or (ii) incorporated by reference by any general statement into any filing made by us with the SEC, except to the extent that we specifically incorporate such share performance graph and table by reference.
Equity Compensation Plan Information
We have adopted a long term stock incentive plan, or Incentive Plan, to provide incentives to our independent directors and employees to stimulate their efforts towards our continued success, long-term growth and profitability and to attract, reward and retain personnel and other service providers. The Incentive Plan authorizes the Compensation Committee of the Board of
31
Directors to grant awards, including incentive stock options as defined under Section 422 of the Code, or ISOs, non-qualified stock options or the NQSOs, restricted shares and other types of incentive awards. The Incentive Plan authorizes the granting of awards for an aggregate of 8,000,000 shares of common stock. For a description of our Incentive Plan, see Note 12 to the Consolidated Financial Statements.
The following table provides information as of December 31, 2018 concerning shares of our common stock authorized for issuance under our existing Incentive Plan.
Plan Category |
Number of Securities
to be Issued Upon
Exercise of
Outstanding Options,
Warrants, and Rights (1)
|
Weighted Average
Exercise Price of
Outstanding
Options, Warrants,
and Rights
|
Number of Securities
Remaining Available
for Future Issuance
Under Equity
Compensation Plans (2)
|
Equity Compensation Plans Approved by Stockholders |
1,808,644 |
— |
5,399,554 |
Equity Compensation Plans Not Approved by Stockholders (3)
|
— |
— |
— |
Total |
1,808,644 |
— |
5,399,554 |
(1) Includes unvested RSUs, PSUs, deferred stock units and related dividends. | |||
(2) Available shares are reduced by the items outstanding in column 1 plus shares previously vested and issued net of units withheld to cover tax withholding requirements. | |||
(3) We do not have any equity plans that have not been approved by our stockholders. | |||
Item 6. Selected Financial Data
The following selected financial data are as of and for the years ended December 31, 2018, 2017, 2016, 2015 and 2014. The selected financial data should be read in conjunction with the more detailed information contained in the Consolidated Financial Statements and Notes thereto contained in Part IV, Financial Statements, and “Management's Discussion and Analysis of Financial Condition and Results of Operations” in Part II, Item 7, included elsewhere in this 2018 Form 10-K.
Consolidated Statements of Financial Condition Highlights | |||||||||||||||
(dollars in thousands, except share and per share data) | |||||||||||||||
December 31, 2018 |
December 31, 2017 |
December 31, 2016 |
December 31, 2015 |
December 31, 2014 |
|||||||||||
Non-Agency Mortgage-Backed Securities |
$ |
2,486,130 |
$ |
2,851,316 |
$ |
3,330,063 |
$ |
3,675,841 |
$ |
3,404,149 |
|||||
Agency Mortgage-Backed securities |
$ |
12,188,950 |
$ |
4,364,828 |
$ |
4,167,754 |
$ |
6,514,824 |
$ |
8,441,522 |
|||||
Securitized loans held for investment, net of allowance for loan losses |
$ |
— |
$ |
— |
$ |
— |
$ |
— |
$ |
626,112 |
|||||
Loans held for investment, at fair value |
$ |
12,572,581 |
$ |
13,678,263 |
$ |
8,753,653 |
$ |
4,768,416 |
$ |
4,699,215 |
|||||
Total assets |
$ |
27,708,639 |
$ |
21,222,070 |
$ |
16,684,908 |
$ |
15,344,646 |
$ |
19,155,005 |
|||||
Repurchase agreements |
$ |
14,030,465 |
$ |
7,250,452 |
$ |
5,600,903 |
$ |
7,439,339 |
$ |
8,455,381 |
|||||
Securitized debt, collateralized by Non-Agency RMBS |
$ |
159,955 |
$ |
205,780 |
$ |
334,124 |
$ |
529,415 |
$ |
704,915 |
|||||
Securitized debt, loans held for investment |
$ |
— |
$ |
— |
$ |
— |
$ |
— |
$ |
521,997 |
|||||
Securitized debt at fair value, loans held for investment |
$ |
8,455,376 |
$ |
9,388,657 |
$ |
6,941,097 |
$ |
3,720,496 |
$ |
3,868,366 |
|||||
Total liabilities |
$ |
24,004,810 |
$ |
17,587,093 |
$ |
13,561,375 |
$ |
12,398,458 |
$ |
15,547,315 |
|||||
Shareholders' equity |
$ |
3,703,829 |
$ |
3,634,977 |
$ |
3,123,533 |
$ |
2,946,188 |
$ |
3,607,690 |
|||||
Book value per common share |
$ |
15.90 |
$ |
16.85 |
$ |
15.87 |
$ |
15.70 |
$ |
17.55 |
|||||
Number of shares outstanding |
187,052,398 |
187,809,288 |
187,739,634 |
187,711,868 |
205,546,144 |
||||||||||
32
Consolidated Statements of Operations Highlights | |||||||||||||||
(dollars in thousands, except share and per share data) | |||||||||||||||
For the Year Ended |
|||||||||||||||
December 31, 2018 |
December 31, 2017 |
December 31, 2016 |
December 31, 2015 |
December 31, 2014 |
|||||||||||
Interest income |
$ |
1,273,316 |
$ |
1,138,758 |
$ |
934,068 |
$ |
872,737 |
$ |
687,795 |
|||||
Interest expense |
$ |
679,108 |
$ |
532,748 |
$ |
347,857 |
$ |
259,365 |
$ |
147,785 |
|||||
Net interest income |
$ |
594,208 |
$ |
606,010 |
$ |
586,211 |
$ |
613,372 |
$ |
540,010 |
|||||
Net income |
$ |
411,637 |
$ |
524,668 |
$ |
551,943 |
$ |
250,349 |
$ |
589,205 |
|||||
Income per share-basic |
$ |
1.97 |
$ |
2.62 |
$ |
2.93 |
$ |
1.25 |
$ |
2.87 |
|||||
Core earnings per basic common share (1)
|
$ |
2.35 |
$ |
2.34 |
$ |
2.42 |
$ |
2.37 |
$ |
2.14 |
|||||
Average shares-basic |
187,146,170 |
187,780,355 |
187,728,634 |
199,563,196 |
205,450,095 |
||||||||||
Dividends declared per share (2)
|
$ |
2.00 |
$ |
2.00 |
$ |
2.44 |
$ |
1.92 |
$ |
1.80 |
|||||
(1) Core Earnings is a non-GAAP measure. See discussion of Core Earnings per basic common share in Management's Discussion and Analysis of Financial Condition and Results of Operations - Core Earnings.
(2) For applicable period as reported in our earnings announcements.
Item 7. Management's Discussion and Analysis of Financial Condition and Results of Operations
The following discussion of our financial condition and results of operations should be read in conjunction with the consolidated financial statements and notes to those statements included in Item 15 of this 2018 Form 10-K. The discussion may contain certain forward-looking statements that involve risks and uncertainties. Forward-looking statements are those that are not historical in nature. As a result of many factors, such as those set forth under “Risk Factors” in this 2018 Form 10-K, our actual results may differ materially from those anticipated in such forward-looking statements.
Executive Summary
We are a publicly traded real estate investment trust, or REIT, that is primarily engaged in the business of investing directly or indirectly through our subsidiaries, on a leveraged basis, in a diversified portfolio of mortgage assets, including residential mortgage loans, Agency RMBS, Non-Agency RMBS, Agency CMBS, and other real estate related securities. Our principal business objective is to deliver shareholder value through the generation of distributable income and through asset performance linked to residential mortgage credit fundamentals. We selectively invest in residential mortgage assets with a focus on credit analysis, projected prepayment rates, interest rate sensitivity and expected return.
We focus our investment activities primarily on acquiring residential mortgage loans and on acquiring Non-Agency and Agency residential and commercial mortgage-backed securities, or MBS. At December 31, 2018, based on the amortized cost balance of our interest earning assets, approximately 47% of our investment portfolio was residential mortgage loans, 47% of our investment portfolio was Agency MBS and 6% of our investment portfolio was Non-Agency RMBS, respectively. At December 31, 2017, based on the amortized cost balance of our interest earning assets, approximately 67% of our investment portfolio was residential mortgage loans, 22% of our investment portfolio was Agency MBS and 11% of our investment portfolio was Non-Agency RMBS, respectively.
Our investment strategy is intended to take advantage of opportunities in the current interest rate and credit environment. We expect to adjust our strategy to changing market conditions by shifting our asset allocations across these various asset classes as interest rate and credit cycles change over time. During 2018, we saw an increase in the relative value of Agency MBS over the residential mortgage loans and shifted our asset mix significantly in favor of Agency MBS as compared to 2017. We believe that our strategy will enable us to pay dividends and preserve capital throughout changing market cycles. We expect to take a long-term view of assets and liabilities, and our reported earnings and estimates of the fair value of our investments at the end of a financial reporting period will not significantly impact our objective of providing attractive risk-adjusted returns to our stockholders over the long-term.
We use leverage to increase returns and to finance the acquisition of our assets. Our income is generated primarily by the difference, or net spread, between the income we earn on our assets and the cost of our borrowings. We expect to finance our investments using a variety of financing sources including, when available, securitizations, warehouse facilities, repurchase agreements, structured asset financing and offerings of our securities. We may manage our debt and interest rate risk by utilizing interest rate hedges, such as interest rate swaps, caps, options and futures to reduce the effect of interest rate fluctuations related to our financing sources.
33
Market Conditions and our Strategy
There are several key factors that impact our financial results, including the interest rate environment and changes in LIBOR rates, U.S. unemployment rates and residential home prices, as well as residential mortgage origination and refinance activity. The interest rate environment is sensitive to actual and anticipated U.S. Federal Reserve actions, availability of adequate and efficient financing sources, rate volatility as well as other market factors. We have operated over the past several years and continue to operate in a volatile interest rate environment.
Financial results were mixed in 2018 as the S&P 500 experienced gains early in 2018 following the trends of 2016 and 2017. The S&P 500 declined in late January but then generally rebounded through September before falling from that point through the end of the year. Overall the S&P lost 6% in 2018, snapping a multi-year streak of gains. The Federal Reserve continued its plan of increasing short term rates, increasing the Fed Funds Target rate four times in 2018 with hikes in March, June, September and December. Longer-term interest rates generally increased during the year, with the 10-year Treasury hitting peaks in October and November before falling to the end of the year. Overall, the short end of the yield curve was up approximately 100 basis points driven by the four rate hikes while the 10-year Treasury was up only 28 basis points, creating a flattening of the yield curve.
The Case-Shiller housing index showed continued strength but the pace of growth started to slow down after the first quarter of 2018. U.S. mortgage rates trended up for most of the year before slipping in November and most of December. The rate of unemployment continues to be historically low, which is generally supportive of the U.S. housing economy.
In 2018, we added approximately $6.9 billion of Agency pass throughs, $943 million of Agency CMBS and $1.7 billion of Loans held for investments. To finance these acquisitions, we added approximately $6.8 billion of repurchase agreements and $1.8 billion of securitized debt.
While the interest rate environment and investor demand was supportive of the value of the assets in our portfolio during 2018, the increase in short-term rates increased our economic interest expense and the cost to finance our portfolio. We added to our interest earning assets in 2018, growing from an average of $18.0 billion in 2017 to $21.8 billion in 2018 and reduced the asset yield by 50 basis points as our asset mix was shifted to lower yielding Agency MBS. Our average interest-bearing liabilities are up from $15.5 billion in 2017 to $18.9 billion in 2018 and economic borrowing costs are up approximately 10 basis points.
Our book value per common share was $15.90 as of December 31, 2018 down from $16.85 as of December 31, 2017 as year-end interest rate declines caused losses in our hedge portfolio. Given the economic environment, we continue to seek high yielding investment opportunities that will deliver a durable dividend to our shareholders while managing risk.
Business Operations
Net Income Summary
The table below presents our net income on a GAAP basis for the year ended December 31, 2018, 2017 and 2016.
34
Net Income | |||||||||
(dollars in thousands, except share and per share data) | |||||||||
For the Year Ended |
|||||||||
December 31, 2018 |
December 31, 2017 |
December 31, 2016 |
|||||||
Net interest income: |
|||||||||
Interest income (1)
|
$ |
1,273,316 |
$ |
1,138,758 |
$ |
934,068 |
|||
Interest expense (2)
|
679,108 |
532,748 |
347,857 |
||||||
Net interest income |
594,208 |
606,010 |
586,211 |
||||||
Other-than-temporary impairments: |
|||||||||
Total other-than-temporary impairment losses |
(2,556 |
) |
(5,169 |
) |
(9,589 |
) |
|||
Portion of loss recognized in other comprehensive income |
(19,235 |
) |
(56,687 |
) |
(48,398 |
) |
|||
Net other-than-temporary credit impairment losses |
(21,791 |
) |
(61,856 |
) |
(57,987 |
) |
|||
Other investment gains (losses): |
|||||||||
Net unrealized gains (losses) on derivatives |
(141,162 |
) |
47,976 |
50,093 |
|||||
Realized gains (losses) on terminations of interest rate swaps |
— |
(16,143 |
) |
(60,616 |
) |
||||
Net realized gains (losses) on derivatives |
18,369 |
(25,645 |
) |
(44,886 |
) |
||||
Net gains (losses) on derivatives |
(122,793 |
) |
6,188 |
(55,409 |
) |
||||
Net unrealized gains (losses) on financial instruments at fair value |
46,632 |
111,410 |
59,552 |
||||||
Net realized gains (losses) on sales of investments |
(2,743 |
) |
9,123 |
18,155 |
|||||
Gains (losses) on extinguishment of debt |
26,376 |
(35,274 |
) |
(477 |
) |
||||
Total other gains (losses) |
(52,528 |
) |
91,447 |
21,821 |
|||||
Other income: |
|||||||||
Other income |
— |
— |
95,000 |
||||||
Total other income |
— |
— |
95,000 |
||||||
Other expenses: |
|||||||||
Compensation and benefits |
35,114 |
30,212 |
26,901 |
||||||
General and administrative expenses |
23,936 |
17,650 |
17,516 |
||||||
Servicing fees |
40,773 |
41,690 |
31,178 |
||||||
Deal expenses |
8,338 |
21,273 |
17,424 |
||||||
Total other expenses |
108,161 |
110,825 |
93,019 |
||||||
Income (loss) before income taxes |
411,728 |
524,776 |
552,026 |
||||||
Income taxes |
91 |
108 |
83 |
||||||
Net income (loss) |
$ |
411,637 |
$ |
524,668 |
$ |
551,943 |
|||
Dividends on preferred stock |
43,197 |
33,484 |
2,449 |
||||||
Net income (loss) available to common shareholders |
$ |
368,440 |
$ |
491,184 |
$ |
549,494 |
|||
Net income (loss) per share available to common shareholders: |
|||||||||
Basic |
$ |
1.97 |
$ |
2.62 |
$ |
2.93 |
|||
Diluted |
$ |
1.96 |
$ |
2.61 |
$ |
2.92 |
|||
Weighted average number of common shares outstanding: |
|||||||||
Basic |
187,146,170 |
187,780,355 |
187,728,634 |
||||||
Diluted |
187,748,862 |
188,287,320 |
188,024,838 |
||||||
Dividends declared per share of common stock |
$ |
2.00 |
$ |
2.00 |
$ |
2.44 |
|||
(1) Includes interest income of consolidated VIEs of $904,830, $914,022 and $678,623 for the years ended December 31, 2018, 2017 and 2016 respectively. See Note 8 to consolidated financial statements for further discussion.
(2) Includes interest expense of consolidated VIEs of $395,255, $390,858 and $249,708 for the years ended December 31, 2018, 2017 and 2016, respectively. See Note 8 to consolidated financial statements for further discussion.
35
Results of Operations for the Years Ended December 31, 2018, 2017 and 2016.
Our primary source of income is interest income earned on our assets, net of interest expense paid on our financing liabilities.
Our net income available to common shareholders decreased by $123 million to $368 million, or $1.97 per average basic common share, for the year ended December 31, 2018 as compared to $491 million, or $2.62 per average basic common share, for the year ended December 31, 2017. The decrease in net income available to common shareholders for the year ended December 31, 2018 is primarily due to an increase in Net losses on derivatives of $129 million, and a decrease in Net unrealized gains on financial instruments at fair value of $65 million, which was offset in part by an increase in Gains on extinguishment of debt of $62 million and a decrease in other than temporary impairment losses of $40 million, compared to the same period of, 2017.
Our net income available to common shareholders decreased by $58 million to $491 million, or $2.62 per average basic common share, for the year ended December 31, 2017 as compared to $549 million, or $2.93 per average basic common share, for the year ended December 31, 2016. The decrease in net income available to common shareholders for the year ended December 31, 2017 is primarily due to a decrease in other income of $95 million, which was a one-time receipt of additional remedies against other parties in the first quarter of 2016, an increase in losses on debt extinguishment of $35 million and an increase in preferred stock dividends of $31 million. These decreases to net income were offset in part by an increase in unrealized gains on financial instruments at fair value of $52 million and an increase in unrealized gains on derivatives of $44 million, compared to the same period of 2016.
Interest Income
The changes in our interest income for the year ended December 31, 2018, as compared to the same period of 2017, are primarily driven by the repositioning of our balance sheet by significantly increasing Agency MBS investments.
Interest income increased by $135 million, or 12%, to $1.3 billion for the year ended December 31, 2018, as compared to $1.1 billion for the same period of 2017. The increase was primarily due to an increase in interest income earned on Agency MBS of $135 million and Loans held for investments of $51 million, which was driven by higher average Agency MBS and Loan held for investment balances, as compared to the same period of 2017. This increase was offset in part by a decrease in interest income on Non-Agency RMBS transferred to consolidated VIEs of $48 million, compared to the same period of 2017.
Interest income increased by $205 million, or 22%, to $1.1 billion for the year ended December 31, 2017, as compared to $934 million for the same period of 2016. The increase was primarily due to an increase in interest income earned on residential mortgage loans of $260 million as compared to the same period of 2016. This increase was offset in part by lower interest income on our Agency MBS of $30 million and Non-agency RMBS transferred to consolidated VIEs of $18 million, compared to the same period of 2016, as in 2017, we reduced our Agency MBS and Non-agency RMBS investments from 2016.
Interest Expense
Interest expense increased by $146 million, or 27%, to $679 million for the year ended December 31, 2018, as compared to $533 million for the same period of 2017. The increase was primarily due to higher interest expenses on repurchase agreements collateralized by Agency MBS of $85 million, repurchase agreements collateralized by RMBS from loan securitization of $38 million and securitized debt, collateralized by loans of $13 million, compared to the same period of 2017. Interest expense is also higher as a result of higher interest rates in 2018 compared to 2017. LIBOR rates have increased during the year ended 2018 following the increases in the Federal funds rate in March 2018, June 2018, September 2018 and December 2018. Interest expense for GAAP reporting does not include the periodic costs of our derivatives, which are reported separately in our GAAP financial statements.
Interest expense increased by $185 million, or 53%, to $533 million for the year ended December 31, 2017, as compared to $348 million for the same period of 2016. The increase was primarily due to increased interest expense on securitized debt, collateralized by seasoned subprime residential mortgage loans of $143 million and repurchase agreements collateralized by RMBS from loan securitization of $41 million, which were driven primarily by higher securitized debt and repurchase agreements collateralized by loan balances compared to the same period of 2016. Interest expense is also higher in 2017 as a result of higher interest rates compared to 2016. LIBOR rates increased during the year ended 2017 following the increases in the Federal fund rate in December 2016, March 2017, June 2017 and December 2017.
Economic Net Interest Income
36
Our “Economic net interest income” is a non-GAAP financial measure, that equals interest income, less interest expense and realized losses on our interest rate swaps. Realized losses on our interest rate swaps are the periodic net settlement payments made or received. For the purpose of computing economic net interest income and ratios relating to cost of funds measures throughout this section, interest expense includes net payments on our interest rate swaps, which is presented as a part of Net realized gains (losses) on derivatives in our Consolidated Statements of Operations. Interest rate swaps are used to manage the increase in interest paid on repurchase agreements in a rising rate environment. Presenting the net contractual interest payments on interest rate swaps with the interest paid on interest-bearing liabilities reflects our total contractual interest payments. We believe this presentation is useful to investors because it depicts the economic value of our investment strategy by showing actual interest expense and net interest income. However, Economic net interest income should not be viewed in isolation and is not a substitute for net interest income computed in accordance with GAAP. Where indicated, interest expense, including interest payments on interest rate swaps, is referred to as economic interest expense. Where indicated, net interest income reflecting interest payments on interest rate swaps, is referred to as economic net interest income.
The following table reconciles the Economic net interest income to GAAP Net interest income for the periods presented.
GAAP Interest Income |
GAAP Interest Expense |
Net Realized (Gains) Losses on Interest Rate Swaps |
Economic Interest Expense |
GAAP Net Interest Income |
Net Realized Gains (Losses) on Interest Rate Swaps |
Other (1)
|
Economic Net Interest Income |
|||||||||||||||||||
For the Year Ended December 31, 2018 |
$ |
1,273,316 |
$ |
679,108 |
$ |
1,488 |
$ |
680,596 |
$ |
594,208 |
$ |
(1,488 |
) |
$ |
760 |
$ |
593,480 |
|||||||||
For the Year Ended December 31, 2017 |
$ |
1,138,758 |
$ |
532,748 |
$ |
15,450 |
$ |
548,198 |
$ |
606,010 |
$ |
(15,450 |
) |
$ |
(1,097 |
) |
$ |
589,463 |
||||||||
For the Year Ended December 31, 2016 |
$ |
934,068 |
$ |
347,857 |
$ |
28,107 |
$ |
375,964 |
$ |
586,211 |
$ |
(28,107 |
) |
$ |
(882 |
) |
$ |
557,222 |
||||||||
For the Quarter Ended December 31, 2018 |
$ |
348,033 |
$ |
193,920 |
$ |
364 |
$ |
194,284 |
$ |
154,113 |
$ |
(364 |
) |
$ |
(140 |
) |
$ |
153,609 |
||||||||
For the Quarter Ended September 30, 2018 |
$ |
321,715 |
$ |
174,671 |
$ |
(242 |
) |
$ |
174,429 |
$ |
147,044 |
$ |
242 |
$ |
321 |
$ |
147,607 |
|||||||||
For the Quarter Ended June 30, 2018 |
$ |
306,436 |
$ |
161,266 |
$ |
(1,246 |
) |
$ |
160,020 |
$ |
145,170 |
$ |
1,246 |
$ |
436 |
$ |
146,852 |
|||||||||
For the Quarter Ended March 31, 2018 |
$ |
297,132 |
$ |
149,251 |
$ |
2,612 |
$ |
151,863 |
$ |
147,881 |
$ |
(2,612 |
) |
$ |
143 |
$ |
145,412 |
|||||||||
(1) Primarily interest expense/(income) on cash and cash equivalents.
Net Interest Rate Spread
The following table shows our average earning assets held, interest earned on assets, yield on average interest earning assets, average debt balance, economic interest expense, economic average cost of funds, economic net interest income, and net interest rate spread for the periods presented.
37
For the Quarter Ended |
|||||||||||||||||
December 31, 2018 |
December 31, 2017 |
||||||||||||||||
(dollars in thousands) |
(dollars in thousands) |
||||||||||||||||
Average Balance |
Interest |
Average Yield/Cost |
Average Balance |
Interest |
Average Yield/Cost |
||||||||||||
Assets: |
|||||||||||||||||
Interest-earning assets (1):
|
|||||||||||||||||
Agency MBS |
$ |
10,577,238 |
$ |
95,941 |
3.6 |
% |
$ |
3,847,658 |
$ |
28,812 |
3.0 |
% |
|||||
Non-Agency RMBS |
1,252,707 |
33,235 |
10.6 |
% |
1,187,349 |
24,608 |
8.3 |
% |
|||||||||
Non-Agency RMBS transferred to consolidated VIEs |
555,314 |
39,394 |
28.4 |
% |
940,931 |
55,916 |
23.8 |
% |
|||||||||
Residential mortgage loans held for investment |
12,228,206 |
179,323 |
5.9 |
% |
13,048,375 |
192,560 |
5.9 |
% |
|||||||||
Total |
$ |
24,613,465 |
$ |
347,893 |
5.7 |
% |
$ |
19,024,313 |
$ |
301,896 |
6.3 |
% |
|||||
Liabilities and stockholders' equity: |
|||||||||||||||||
Interest-bearing liabilities: |
|||||||||||||||||
Repurchase agreements collateralized by: |
|||||||||||||||||
Agency MBS (2)
|
$ |
9,535,298 |
$ |
62,788 |
2.6 |
% |
$ |
3,090,155 |
$ |
15,651 |
2.0 |
% |
|||||
Non-Agency RMBS (2)
|
533,696 |
5,138 |
3.9 |
% |
497,073 |
3,896 |
3.1 |
% |
|||||||||
Re-REMIC repurchase agreements |
577,335 |
6,403 |
4.4 |
% |
867,882 |
7,193 |
3.3 |
% |
|||||||||
RMBS from loan securitizations |
2,435,931 |
23,445 |
3.8 |
% |
2,573,351 |
21,236 |
3.3 |
% |
|||||||||
Securitized debt, collateralized by Non-Agency RMBS |
164,043 |
2,259 |
5.5 |
% |
219,446 |
3,796 |
6.9 |
% |
|||||||||
Securitized debt, collateralized by loans |
8,531,109 |
94,251 |
4.4 |
% |
9,451,052 |
96,801 |
4.1 |
% |
|||||||||
Total |
$ |
21,777,412 |
$ |
194,284 |
3.6 |
% |
$ |
16,698,959 |
$ |
148,573 |
3.6 |
% |
|||||
Economic net interest income/net interest rate spread |
$ |
153,609 |
2.1 |
% |
$ |
153,323 |
2.7 |
% |
|||||||||
Net interest-earning assets/net interest margin |
$ |
2,836,053 |
2.5 |
% |
$ |
2,325,354 |
3.2 |
% |
|||||||||
Ratio of interest-earning assets to interest bearing liabilities |
1.13 |
1.14 |
|||||||||||||||
(1) Interest-earning assets at amortized cost |
|||||||||||||||||
(2) Interest includes net cash paid/received on swaps |
|||||||||||||||||
38
For the Year Ended |
|||||||||||||||||
December 31, 2018 |
December 31, 2017 |
||||||||||||||||
(dollars in thousands) |
(dollars in thousands) |
||||||||||||||||
Average Balance |
Interest |
Average Yield/Cost |
Average Balance |
Interest |
Average Yield/Cost |
||||||||||||
Assets: |
|||||||||||||||||
Interest-earning assets (1): |
|||||||||||||||||
Agency MBS |
$ |
7,116,064 |
$ |
239,472 |
3.4 |
% |
$ |
3,752,141 |
$ |
104,969 |
2.8 |
% |
|||||
Non-Agency RMBS |
1,175,108 |
111,584 |
9.5 |
% |
1,286,329 |
112,969 |
8.8 |
% |
|||||||||
Non-Agency RMBS transferred to consolidated VIEs |
728,098 |
183,126 |
25.2 |
% |
1,039,498 |
230,924 |
22.2 |
% |
|||||||||
Residential mortgage loans held for investment |
12,776,512 |
739,894 |
5.8 |
% |
11,878,741 |
688,799 |
5.8 |
% |
|||||||||
Total |
$ |
21,795,782 |
$ |
1,274,076 |
5.8 |
% |
$ |
17,956,709 |
$ |
1,137,661 |
6.3 |
% |
|||||
Liabilities and stockholders' equity: |
|||||||||||||||||
Interest-bearing liabilities: |
|||||||||||||||||
Repurchase agreements collateralized by: |
|||||||||||||||||
Agency MBS (2) |
$ |
6,085,643 |
$ |
138,078 |
2.3 |
% |
$ |
3,120,474 |
$ |
53,525 |
1.7 |
% |
|||||
Non-Agency RMBS (2)
|
442,771 |
15,740 |
3.6 |
% |
674,832 |
19,914 |
3.0 |
% |
|||||||||
Re-REMIC repurchase agreements |
699,380 |
28,591 |
4.1 |
% |
578,206 |
19,114 |
3.3 |
% |
|||||||||
RMBS from loan securitizations |
2,588,376 |
102,933 |
4.0 |
% |
1,950,662 |
64,785 |
3.3 |
% |
|||||||||
Securitized debt, collateralized by Non-Agency RMBS |
181,461 |
10,192 |
5.6 |
% |
268,254 |
18,787 |
7.0 |
% |
|||||||||
Securitized debt, collateralized by loans |
8,903,820 |
385,062 |
4.3 |
% |
8,920,108 |
372,073 |
4.2 |
% |
|||||||||
Total |
$ |
18,901,451 |
$ |
680,596 |
3.6 |
% |
$ |
15,512,536 |
$ |
548,198 |
3.5 |
% |
|||||
Economic net interest income/net interest rate spread |
$ |
593,480 |
2.2 |
% |
$ |
589,463 |
2.8 |
% |
|||||||||
Net interest-earning assets/net interest margin |
$ |
2,894,331 |
2.7 |
% |
$ |
2,444,173 |
3.3 |
% |
|||||||||
Ratio of interest-earning assets to interest bearing liabilities |
1.15 |
1.16 |
|||||||||||||||
(1) Interest-earning assets at amortized cost |
|||||||||||||||||
(2) Interest includes net cash paid/received on swaps |
|||||||||||||||||
Economic Net Interest Income and the Average Earning Assets
Our economic net interest income increased by $4 million to $593 million for the year ended December 31, 2018 from $589 million for the same period of 2017. Our net interest rate spread, which equals the yield on our average interest-earning assets less the economic average cost of funds decreased by 60 basis points for the year ended December 31, 2018, as compared to the same period of 2017. The net interest margin, which equals the economic net interest income as a percentage of the net average balance of our interest-earning assets less our interest-bearing liabilities also decreased by 60 basis points for the year ended December 31, 2018, as compared to the same period of 2017. Average net interest-earning assets increased by $450 million to $2.9 billion for the year ended December 31, 2018 compared to the same period of 2017. This increase in average net interest-earning assets was primarily driven by an increase in our average investments in Agency MBS and residential mortgage loans, which was partially offset by an increase in our repurchase agreements.
Economic Interest Expense and the Cost of Funds
The borrowing rate at which we are able to finance our assets using repurchase agreements and securitized debt is typically correlated to LIBOR and the term of the financing. The table below shows our average borrowed funds, economic interest expense, average cost of funds (inclusive of realized losses on interest rate swaps), average one-month LIBOR, average three-month LIBOR and average one-month LIBOR relative to average three-month LIBOR.
39
Average Debt Balance |
Economic Interest Expense (1)
|
Average Cost of Funds |
Average One-Month LIBOR |
Average Three-Month LIBOR |
Average One-Month LIBOR Relative to Average Three-Month LIBOR |
|||||||||
(Ratios have been annualized, dollars in thousands) |
||||||||||||||
For The Year Ended December 31, 2018 |
$ |
18,901,451 |
$ |
680,596 |
3.60 |
% |
2.02 |
% |
2.30 |
% |
(0.28 |
)% |
||
For The Year Ended December 31, 2017 |
$ |
15,512,536 |
$ |
548,198 |
3.53 |
% |
1.11 |
% |
1.26 |
% |
(0.15 |
)% |
||
For The Year Ended December 31, 2016 |
$ |
12,676,437 |
$ |
375,964 |
3.00 |
% |
0.50 |
% |
0.74 |
% |
(0.24 |
)% |
||
For The Quarter Ended December 31, 2018 |
$ |
21,777,412 |
$ |
194,284 |
3.57 |
% |
2.35 |
% |
2.62 |
% |
(0.27 |
)% |
||
For The Quarter Ended September 30, 2018 |
$ |
19,348,075 |
$ |
174,429 |
3.61 |
% |
2.11 |
% |
2.34 |
% |
(0.23 |
)% |
||
For The Quarter Ended June 30, 2018 |
$ |
17,883,143 |
$ |
160,020 |
3.58 |
% |
1.97 |
% |
2.34 |
% |
(0.37 |
)% |
||
For The Quarter Ended March 31, 2018 |
$ |
16,642,471 |
$ |
151,863 |
3.65 |
% |
1.65 |
% |
1.92 |
% |
(0.27 |
)% |
||
(1) Includes effect of realized losses on interest rate swaps.
Average interest-bearing liabilities increased by $3.4 billion for the year ended December 31, 2018, as compared to the same period of 2017. Economic interest expense increased by $132 million for the year ended December 31, 2018, as compared to the same period of 2017. The increase in average interest-bearing liabilities and economic interest expense is a result of the increase in the amount of our repurchase agreements as well as the increase in LIBOR.
Average one-month and three-month LIBOR were up 91 basis points and 104 basis points, respectively, during the year ended December 31, 2018, as compared to the same period of 2017, contributing to the increase in economic interest expense. While we do acquire interest rate hedges to mitigate changes in interest rate risks, the hedges may not fully offset interest expense movements.
Net Other-than-temporary Credit Impairment Losses
OTTI losses are generated when fair values decline below our amortized cost basis, an unrealized loss, and the expected future cash flows decline from prior periods, an adverse change. When an unrealized loss and an adverse change in cash flows occur, we will recognize an OTTI loss in earnings. In addition, if we intend to sell a security, or believe we will be required to sell a security in an unrealized loss position, we will recognize an OTTI loss in earnings equal to the unrealized loss.
OTTI losses were $22 million, $62 million and $58 million for the years ended December 31, 2018, 2017 and 2016, respectively. Of these amounts, $19 million, $53 million and $39 million of the OTTI for the years ended December 31, 2018, 2017 and 2016, respectively, were related to securities included in our consolidated VIEs. As of December 31, 2018, we had three Non-agency RMBS securities subject to OTTI in an unrealized loss position totaling $513 thousand for which we did not recognize impairment. We continue to monitor our investment portfolio and will record an OTTI for all investments in an unrealized loss position for which we do not believe we will recover our amortized cost prior to maturity or sale.
Net Gains (losses) on derivatives
Our interest rate swaps are primarily used to economically hedge the effects of changes in interest rates on our portfolio, specifically our floating rate debt. Therefore, we included the periodic interest costs of the interest rate swaps for the years ended December 31, 2018 and 2017 on these economic hedges in our presentation of economic net interest income and our net interest spreads. As we do not account for these as hedges for GAAP presentation, we present these gains and losses separately in the Consolidated Statements of Operations. The decrease in the net periodic interest cost of the interest rate swaps are primarily due to the increase in interest rates and changes in our swap portfolio balance during the year.
The table below shows a summary of our net gains (losses) on derivative instruments, for the year ended December 31, 2018, 2017 and 2016, respectively.
40
For the Year Ended |
|||||||||
December 31, 2018 |
December 31, 2017 |
December 31, 2016 |
|||||||
(dollars in thousands) |
|||||||||
Periodic interest cost of interest rate swaps, net |
$ |
(1,488 |
) |
$ |
(15,450 |
) |
$ |
(28,106 |
) |
Realized gains (losses) on derivative instruments, net: |
|||||||||
Treasury Futures |
21,333 |
(4,061 |
) |
(9,170 |
) |
||||
Swaptions |
(1,476 |
) |
(6,134 |
) |
(7,044 |
) |
|||
Other Derivative Assets |
— |
— |
(566 |
) |
|||||
Swaps - Terminations |
— |
(16,143 |
) |
(60,616 |
) |
||||
Total realized gains (losses) on derivative instruments, net |
19,857 |
(26,338 |
) |
(77,396 |
) |
||||
Unrealized gains (losses) on derivative instruments, net: |
|||||||||
Interest Rate Swaps |
(125,595 |
) |
43,697 |
47,170 |
|||||
Treasury Futures |
(16,928 |
) |
1,768 |
378 |
|||||
Swaptions |
1,361 |
2,511 |
2,545 |
||||||
Total unrealized gains (losses) on derivative instruments, net: |
(141,162 |
) |
47,976 |
50,093 |
|||||
Total gains (losses) on derivative instruments, net |
$ |
(122,793 |
) |
$ |
6,188 |
$ |
(55,409 |
) |
|
The net gains and losses on our derivatives include both unrealized and realized gains and losses. Realized gains and losses include the net cash paid and received on our interest rate swaps during the period as well as sales and settlements of our Treasury Futures and swaptions. The realized loss on our derivative instruments is primarily a result of the pay fixed leg of our swaps carried at a higher interest rate than the receive floating leg of these same swaps, resulting in a net payment on the periodic settlement of the swaps during the year.
Unrealized gains and losses include the change in market value, period over period, on our derivatives portfolio. Changes in market value are generally a result of changes in interest rates. We may or may not ultimately realize these unrealized derivative gains and losses depending on trade activity, changes in interest rates and the values of the underlying securities. During the year ended December 31, 2018, we recognized total net losses on derivatives of $123 million, compared to net gains on derivatives of $6 million during the year ended December 31, 2017. This was primarily driven by higher unrealized losses on interest rate swaps in 2018 as compared to 2017.
There were no swap terminations during the year ended December 31, 2018. We paid $16 million to terminate interest rate swaps with a notional value of $250 million during the year ended December 31, 2017. Our Treasury futures positions remained unchanged at $620 million of notional value during the year ended December 31, 2018 and 2017. We reduced our swaptions by $338 million of notional value to $53 million at December 31, 2018, as compared to the $391 million notional value at December 31, 2017.
Changes in our derivative positions were a result of changes in our portfolio composition and changes in interest rates.
We had net realized gains on our short futures positions of $21 million for the year ended December 31, 2018, and net realized losses of $4 million and $9 million during the years ended December 31, 2017 and 2016, respectively. The realized gains and losses were driven primarily by changes in interest rates during these periods, which affects the Treasury futures prices, resulting in realized gains or losses on our short futures positions. Treasury futures are not included in our economic interest expense and economic net interest income.
Net Unrealized Gains (Losses) on Financial Instruments at Fair Value
We have elected the fair value option with changes in fair value reflected in earnings for our IO MBS securities, certain Non-Agency RMBS securities which receive residual cash flows, Loans held for investment, and the related financing for the loans consolidated as a VIE in our statement of financial condition. In addition, we have elected to account for Agency MBS investments acquired on or after July 1, 2017 under the fair value option. All Agency MBS investments owned prior to July 1, 2017 will continue to be carried at fair value with changes in fair value reported in other comprehensive income (OCI) as available-for-sale investments.
IO MBS securities represent the right to receive the interest on a pool of mortgage backed securities, including both Agency and Non-Agency mortgage pools. The fair value of IO MBS securities are heavily impacted by changes in expected prepayment
41
rates. When IO securities prepay faster than expectations, the holder of the IO security will receive less interest on the investment due to the reduced principal.
We invest in overcollateralization classes of several seasoned pools of mortgage loans. These holdings generally do not have a traditional original and current face or notional face value amount and pay cash based on guidance in the trust documents when excess cash is available. Many of these holdings do not pay any interest and may never pay interest. We have elected to carry these overcollateralization classes at fair value with changes in fair value reflected in earnings.
The Net unrealized gains on financial instruments at fair value for the year ended December 31, 2018 were $47 million. The year to date 2018 gains on financial instruments at fair value were primarily driven by unrealized gains on Securitized debt collateralized by loans held for investment of $52 million and Non-Agency RMBS of $21 million, offset in part by unrealized losses on Loans held for investments of $27 million. For the year ended December 31, 2017, the Net unrealized gains on financial instruments at fair value were $111 million, which were primarily driven by unrealized gains on Loans held for investment of $206 million, offset in part by unrealized losses on Securitized debt collateralized by loans held for investment of $78 million.
Gains and Losses on Sales of Assets and Extinguishment of Securitized Debt
For the years ended December 31, 2018, 2017 and 2016, we had net realized losses of $3 million, net realized gains of $9 million and $18 million, respectively, on sales of investments. We do not forecast sales of investments as we generally expect to invest for long term gains. However, from time to time, we may sell assets to create liquidity necessary to pursue new opportunities, achieve targeted leverage ratios as well as for gains when prices indicate a sale is most beneficial to us, or is the most prudent course of action to maintain a targeted risk adjusted yield for our investors.
When we acquire our outstanding securitized debt, we extinguish the outstanding debt and recognize a gain or loss based on the difference between the carrying value of the debt and the cost to acquire the debt which is reflected in the Consolidated Statements of Operations as a gain or loss on extinguishment of debt.
There were no securitized debt collateralized by Non-Agency RMBS acquisitions during the year ended December 31, 2018. During the year ended December 31, 2017, we acquired securitized debt collateralized by Non-Agency RMBS with an amortized cost balance of $166 thousand for $167 thousand. This transaction resulted in a net loss on the extinguishment of debt of $1 thousand, which is reflected in earnings for the year ended December 31, 2017. During the year ended December 31, 2016, we acquired securitized debt collateralized by Non-Agency RMBS with an amortized cost balance of $10 million for $11 million. This transaction resulted in a net loss on the extinguishment of debt of $355 thousand, which is reflected in earnings for the year ended December 31, 2016.
During the year ended December 31, 2018, we acquired securitized debt collateralized by loans with an amortized cost balance of $861 million for $835 million. These transactions resulted in a net gain on the extinguishment of debt of $26 million, which is reflected in earnings for the year ended December 31, 2018. During the year ended December 31, 2017, we acquired securitized debt collateralized by loans with an amortized cost balance of $1.0 billion for $1.1 billion. This transaction resulted in a net loss on the extinguishment of debt of $35 million. During the year ended December 31, 2016, we acquired securitized debt collateralized by loans with an amortized cost balance of $609 million for $609 million. These transactions resulted in a net loss on the extinguishment of debt of $122 thousand. This loss is reflected in earnings for the year ended December 31, 2016. As our securitized debt is carried at fair value with changes in fair value reflected in earnings some of these losses were recognized during prior periods.
Compensation, General and Administrative Expenses and Deal Expenses
The table below shows our total compensation and benefit expense, general and administrative, or G&A expenses, and deal expenses as compared to average total assets and average equity for the periods presented.
42
Total Compensation, G&A and Deal Expenses |
Total Compensation, G&A and Deal Expenses/Average Assets |
Total Compensation, G&A and Deal Expenses/Average Equity |
|||||
(Ratios have been annualized, dollars in thousands) |
|||||||
For The Year Ended December 31, 2018 |
$ |
67,388 |
0.28 |
% |
1.81 |
% |
|
For The Year Ended December 31, 2017 |
$ |
69,135 |
0.34 |
% |
1.98 |
% |
|
For The Year Ended December 31, 2016 |
$ |
61,841 |
0.38 |
% |
2.06 |
% |
|
For The Quarter Ended December 31, 2018 |
$ |
20,126 |
0.30 |
% |
2.11 |
% |
|
For The Quarter Ended September 30, 2018 |
$ |
15,629 |
0.26 |
% |
1.65 |
% |
|
For The Quarter Ended June 30, 2018 |
$ |
16,644 |
0.30 |
% |
1.82 |
% |
|
For The Quarter Ended March 31, 2018 |
$ |
14,988 |
0.28 |
% |
1.64 |
% |
|
Compensation and benefit costs were $35 million, $30 million and $27 million for the years ended December 31, 2018, 2017 and 2016, respectively. The increases in Compensation and benefit costs for each year were primarily driven by higher bonuses and stock based compensation.
G&A expenses were $24 million, $18 million and $18 million for the years ended December 31, 2018, 2017 and 2016, respectively. The G&A expenses are primarily comprised of auditing, information technology, legal and consulting expenses. The increases in G&A expenses during 2018, were primarily driven by higher legal expenses, due diligence fees and investment manager fees as compared to the same period of 2017. G&A expenses were relatively unchanged during 2017 as compared to 2016.
The Company incurred deal expenses of $8 million, $21 million and $17 million for the years ended December 31, 2018, 2017 and 2016, respectively. The decrease in deal expenses year ended December 31, 2018 was driven by lower securitization activity compared to the same period of 2017. The deal expenses increased during 2017 as compared to 2016, primarily due to increased securitization activity as during 2017.
Servicing Fees
Servicing fees expenses were $41 million, $42 million and $31 million during the years ended December 31, 2018, 2017 and 2016, respectively. These servicing fees are related to the consolidation of the whole loan securitization vehicles and are paid from interest income earned by the VIEs. The servicing fees range from 20 to 50 basis points of unpaid principal balances of our consolidated VIEs.
Core earnings
Core earnings is a non-GAAP measure and is defined as GAAP net income excluding unrealized gains on the aggregate portfolio, impairment losses, realized gains on sales of investments, realized gains or losses on futures, realized gains or losses on swap terminations, gain on deconsolidation, extinguishment of debt and certain other non-recurring gains or losses. As defined, core earnings include interest income and expense as well as realized losses on interest rate swaps used to hedge interest rate risk and other expenses. Management believes that the presentation of core earnings provides investors with a useful measure to facilitate comparisons of financial performance between our REIT peers, but has important limitations. We believe core earnings as described above helps evaluate our financial performance without the impact of certain transactions but is of limited usefulness as an analytical tool. Therefore, core earnings should not be viewed in isolation and is not a substitute for net income or net income per basic share computed in accordance with GAAP.
The following table provides GAAP measures of net income and net income per basic share available to common stockholders for the periods presented and details with respect to reconciling the line items to core earnings and related per average basic common share amounts:
43
For the Year Ended |
|||||||||
December 31, 2018 |
December 31, 2017 |
December 31, 2016 |
|||||||
(dollars in thousands, except per share data) |
|||||||||
GAAP Net income available to common stockholders |
$ |
368,440 |
$ |
491,184 |
$ |
549,494 |
|||
Adjustments: |
|||||||||
Net other-than-temporary credit impairment losses |
21,791 |
61,856 |
57,987 |
||||||
Net unrealized (gains) losses on derivatives |
141,162 |
(47,976 |
) |
(50,093 |
) |
||||
Net unrealized (gains) losses on financial instruments at fair value |
(46,632 |
) |
(111,410 |
) |
(59,552 |
) |
|||
Net realized (gains) losses on sales of investments |
2,743 |
(9,123 |
) |
(18,155 |
) |
||||
(Gains) losses on extinguishment of debt |
(26,376 |
) |
35,274 |
477 |
|||||
Realized (gains) losses on terminations of interest rate swaps |
— |
16,143 |
60,616 |
||||||
Net realized (gains) losses on derivatives - Futures(1)
|
(21,333 |
) |
4,061 |
9,170 |
|||||
Total other (gains) losses |
— |
— |
(95,000 |
) |
|||||
Core Earnings |
$ |
439,795 |
$ |
440,009 |
$ |
454,944 |
|||
GAAP net income per basic common share |
$ |
1.97 |
$ |
2.62 |
$ |
2.93 |
|||
Core earnings per basic common share(2)
|
$ |
2.35 |
$ |
2.34 |
$ |
2.42 |
|||
For the Quarters Ended |
|||||||||||||||
December 31, 2018 |
September 30, 2018 |
June 30, 2018 |
March 31, 2018 |
December 31, 2017 |
|||||||||||
(dollars in thousands, except per share data) |
|||||||||||||||
GAAP Net income available to common stockholders |
$ |
(117,235 |
) |
$ |
147,361 |
$ |
108,708 |
$ |
229,607 |
$ |
98,208 |
||||
Adjustments: |
|||||||||||||||
Net other-than-temporary credit impairment losses |
4,269 |
7,233 |
9,131 |
1,158 |
18,179 |
||||||||||
Net unrealized (gains) losses on derivatives |
319,673 |
(71,197 |
) |
(25,895 |
) |
(81,419 |
) |
(28,074 |
) |
||||||
Net unrealized (gains) losses on financial instruments at fair value |
(84,836 |
) |
34,306 |
18,364 |
(14,466 |
) |
47,637 |
||||||||
Net realized (gains) losses on sales of investments |
(1,213 |
) |
6,123 |
(2,167 |
) |
— |
586 |
||||||||
(Gains) losses on extinguishment of debt |
(7,055 |
) |
(9,263 |
) |
(387 |
) |
(9,670 |
) |
(12,742 |
) |
|||||
Net realized (gains) losses on Futures (1)
|
(4,320 |
) |
(2,799 |
) |
2,210 |
(16,424 |
) |
(8,204 |
) |
||||||
Core Earnings |
$ |
109,283 |
$ |
111,764 |
$ |
109,964 |
$ |
108,786 |
$ |
115,590 |
|||||
GAAP net income per basic common share |
$ |
(0.63 |
) |
$ |
0.79 |
$ |
0.58 |
$ |
1.22 |
$ |
0.52 |
||||
Core earnings per basic common share(2)
|
$ |
0.58 |
$ |
0.60 |
$ |
0.59 |
$ |
0.58 |
$ |
0.62 |
|||||
(1) Included in net realized gains (losses) on derivatives in the Consolidated Statements of Operations. | |||||||||||||||
(2) We note that core and taxable earnings will typically differ, and may materially differ, due to differences on realized gains and losses on investments and related hedges, credit loss recognition, | |||||||||||||||
timing differences in premium amortization, accretion of discounts, equity compensation and other items. | |||||||||||||||
Our core earnings for the year ended December 31, 2018 were $440 million, or $2.35 per average basic common share, which remained relatively unchanged compared to $440 million, or $2.34 per average basic common share, for the year ended December 31, 2017.
Net Income (Loss) and Return on Total Stockholders' Equity
The table below shows our Net Income, Economic Net Interest Income and Core Earnings, each as a percentage of average stockholders' equity. Return on average equity is defined as our GAAP net income (loss) as a percentage of average equity. Average equity is defined as the average of our beginning and ending stockholders' equity balance for the period reported. Economic Net Interest Income and Core Earnings are non-GAAP measures as defined in previous sections.
44
Return on Average Equity |
Economic Net Interest Income/Average Equity * |
Core Earnings/Average Equity |
||||
(Ratios have been annualized) |
||||||
For the Year Ended December 31, 2018 |
11.08 |
% |
15.98 |
% |
11.84 |
% |
For the Year Ended December 31, 2017 |
15.00 |
% |
16.85 |
% |
12.58 |
% |
For the Year Ended December 31, 2016 |
18.42 |
% |
18.59 |
% |
15.18 |
% |
For the Quarter Ended December 31, 2018 |
(10.80 |
)% |
16.13 |
% |
11.48 |
% |
For the Quarter Ended September 30, 2018 |
16.64 |
% |
15.61 |
% |
11.82 |
% |
For the Quarter Ended June 30, 2018 |
12.91 |
% |
16.05 |
% |
12.02 |
% |
For the Quarter Ended March 31, 2018 |
26.17 |
% |
15.92 |
% |
11.91 |
% |
* Includes effect of realized losses on interest rate swaps.
Return on average equity decreased by 392 basis points for the year ended December 31, 2018, as compared to the same period of 2017. Economic net interest income as a percentage of average equity decreased by 87 basis points, driven primarily by higher interest expense related to the increase in LIBOR rates. Core earnings as a percentage of average equity decreased by 74 basis points for the year ended December 31, 2018 compared to the year ended December 31, 2017, which was primarily driven by a higher average equity balance due to preferred stock issuance.
Financial Condition
Portfolio Review
During the year ended December 31, 2018, on an aggregate basis, we purchased $9.7 billion of investments, sold $791 million of investments and received $2.9 billion in principal payments related to our Agency, Non-Agency RMBS and Loans held for investments portfolio.
The following table summarizes certain characteristics of our portfolio at December 31, 2018 and December 31, 2017.
December 31, 2018 |
December 31, 2017 |
|||||
Interest earning assets at period-end (1)
|
$ |
27,247,661 |
$ |
20,894,407 |
||
Interest bearing liabilities at period-end |
$ |
22,645,796 |
$ |
16,844,889 |
||
GAAP Leverage at period-end |
6.1:1 |
4.6:1 |
||||
GAAP Leverage at period-end (recourse) |
3.8:1 |
2.0:1 |
||||
Portfolio Composition, at amortized cost |
||||||
Non-Agency RMBS |
4.7 |
% |
5.9 |
% |
||
Senior |
2.8 |
% |
2.9 |
% |
||
Senior, interest only |
1.1 |
% |
1.3 |
% |
||
Subordinated |
0.8 |
% |
1.7 |
% |
||
Subordinated, interest only |
0.0 |
% |
0.0 |
% |
||
RMBS transferred to consolidated VIEs |
2.1 |
% |
4.6 |
% |
||
Agency MBS |
46.7 |
% |
22.2 |
% |
||
Residential |
35.0 |
% |
11.8 |
% |
||
Commercial |
11.2 |
% |
9.8 |
% |
||
Interest-only |
0.5 |
% |
0.6 |
% |
||
Loans held for investment |
46.5 |
% |
67.3 |
% |
||
Fixed-rate percentage of portfolio |
95.8 |
% |
93.7 |
% |
||
Adjustable-rate percentage of portfolio |
4.2 |
% |
6.3 |
% |
||
(1) Excludes cash and cash equivalents.
GAAP leverage at period-end is calculated as a ratio of our repurchase agreements and securitized debt liabilities over GAAP book value. GAAP recourse leverage is calculated as a ratio of our repurchase agreements over GAAP book value.
45
The following table presents details of each asset class in our portfolio at December 31, 2018 and December 31, 2017. The principal or notional value represents the interest income earning balance of each class. The weighted average figures are weighted by each investment’s respective principal/notional value in the asset class.
December 31, 2018 |
||||||||||||||||||||||||||
|
Principal or Notional Value at Period-End
(dollars in thousands)
|
Weighted Average Amortized Cost Basis |
Weighted Average Fair Value |
Weighted Average Coupon |
Weighted Average Yield at Period-End (1)
|
Weighted Average 3 Month CPR at Period-End |
Weighted Average 12 Month CPR at Period-End |
Weighted Average Delinquency Pipeline 60+ |
Weighted Average Loss Severity(2)
|
Weighted Average Credit Enhancement |
Principal Writedowns During the Quarter
(dollars in thousands)
|
||||||||||||||||
Non-Agency Mortgage-Backed Securities |
||||||||||||||||||||||||||
Senior |
$ |
1,122,782 |
$ |
65.10 |
$ |
82.79 |
4.7 |
% |
11.5 |
% |
11.4 |
% |
14.0 |
% |
16.8 |
% |
42.7 |
% |
7.7 |
% |
$ |
4,145 |
||||
Senior, interest only |
$ |
5,642,053 |
$ |
5.05 |
$ |
4.45 |
1.2 |
% |
8.3 |
% |
10.8 |
% |
13.4 |
% |
10.9 |
% |
53.3 |
% |
— |
% |
$ |
— |
||||
Subordinated |
$ |
394,037 |
$ |
56.60 |
$ |
70.16 |
4.0 |
% |
9.9 |
% |
11.3 |
% |
15.6 |
% |
10.3 |
% |
44.3 |
% |
9.4 |
% |
$ |
3,478 |
||||
Subordinated, interest only |
$ |
221,549 |
$ |
4.48 |
$ |
5.26 |
1.1 |
% |
16.4 |
% |
15.1 |
% |
15.1 |
% |
9.5 |
% |
29.2 |
% |
— |
% |
$ |
— |
||||
RMBS transferred to consolidated VIEs |
$ |
1,288,412 |
$ |
42.33 |
$ |
78.97 |
5.3 |
% |
30.2 |
% |
13.2 |
% |
15.0 |
% |
16.1 |
% |
51.0 |
% |
0.1 |
% |
$ |
9,269 |
||||
Agency Mortgage-Backed Securities |
||||||||||||||||||||||||||
Residential |
$ |
8,984,249 |
$ |
102.47 |
$ |
102.12 |
4.0 |
% |
3.6 |
% |
5.9 |
% |
10.7 |
% |
0.1 |
% |
N/A |
N/A |
$ |
— |
||||||
Commercial |
$ |
2,895,680 |
$ |
101.98 |
$ |
99.50 |
3.6 |
% |
3.4 |
% |
— |
% |
— |
% |
— |
% |
N/A |
N/A |
$ |
— |
||||||
Interest-only |
$ |
3,028,572 |
$ |
4.49 |
$ |
4.40 |
0.8 |
% |
4.3 |
% |
2.1 |
% |
4.9 |
% |
0.2 |
% |
N/A |
N/A |
$ |
— |
||||||
Loans held for investment |
$ |
12,432,582 |
$ |
98.48 |
$ |
101.27 |
6.6 |
% |
5.8 |
% |
10.0 |
% |
10.4 |
% |
7.7 |
% |
57.1 |
% |
N/A |
$ |
33,717 |
|||||
(1) Bond Equivalent Yield at period end. Weighted Average Yield is calculated using each investment's respective amortized cost.
(2) Calculated based on reported losses to date, utilizing widest data set available (i.e., life-time losses, 12-month loss, etc.)
46
December 31, 2017 |
||||||||||||||||||||||||||
|
Principal or Notional Value at Period-End
(dollars in thousands)
|
Weighted Average Amortized Cost Basis |
Weighted Average Fair Value |
Weighted Average Coupon |
Weighted Average Yield at Period-End (1)
|
Weighted Average 3 Month CPR at Period-End |
Weighted Average 12 Month CPR at Period-End |
Weighted Average Delinquency Pipeline 60+ |
Weighted Average Loss Severity(2)
|
Weighted Average Credit Enhancement |
Principal Writedowns During the Quarter (dollars in thousands) |
||||||||||||||||
Non-Agency Mortgage-Backed Securities |
||||||||||||||||||||||||||
Senior |
$ |
821,869 |
$ |
68.97 |
$ |
79.83 |
3.6 |
% |
7.4 |
% |
13.3 |
% |
13.7 |
% |
21.3 |
% |
45.8 |
% |
9.2 |
% |
$ |
3,233 |
||||
Senior, interest only |
$ |
4,834,289 |
$ |
5.39 |
$ |
4.27 |
1.3 |
% |
7.8 |
% |
13.6 |
% |
14.4 |
% |
17.1 |
% |
52.5 |
% |
0.0 |
% |
$ |
— |
||||
Subordinated |
$ |
501,455 |
$ |
66.77 |
$ |
80.01 |
4.1 |
% |
9.6 |
% |
18.8 |
% |
15.4 |
% |
15.2 |
% |
45.1 |
% |
16.8 |
% |
$ |
3,502 |
||||
Subordinated, interest only |
$ |
201,378 |
$ |
3.66 |
$ |
3.89 |
0.8 |
% |
11.8 |
% |
13.7 |
% |
14.6 |
% |
13.0 |
% |
46.2 |
% |
0.0 |
% |
$ |
— |
||||
RMBS transferred to consolidated VIEs |
$ |
1,940,229 |
$ |
47.05 |
$ |
81.42 |
4.9 |
% |
22.6 |
% |
15.0 |
% |
16.4 |
% |
17.9 |
% |
49.0 |
% |
1.3 |
% |
$ |
10,678 |
||||
Agency Mortgage-Backed Securities |
||||||||||||||||||||||||||
Residential |
$ |
2,227,128 |
$ |
105.53 |
$ |
104.27 |
3.8 |
% |
2.9 |
% |
12.1 |
% |
14.5 |
% |
0.7 |
% |
N/A |
N/A |
$ |
— |
||||||
Commercial |
$ |
1,894,594 |
$ |
102.26 |
$ |
102.31 |
3.6 |
% |
3.2 |
% |
1.5 |
% |
— |
% |
0.0 |
% |
N/A |
N/A |
$ |
— |
||||||
Interest-only |
$ |
3,021,840 |
$ |
3.68 |
$ |
3.45 |
0.7 |
% |
3.4 |
% |
4.9 |
% |
8.8 |
% |
0.1 |
% |
N/A |
N/A |
$ |
— |
||||||
Loans held for investment |
$ |
13,525,820 |
$ |
98.44 |
$ |
101.20 |
6.5 |
% |
5.9 |
% |
10.8 |
% |
11.0 |
% |
4.1 |
% |
45.8 |
% |
N/A |
$ |
30,469 |
|||||
(1) Bond Equivalent Yield at period end. Weighted Average Yield is calculated using each investment's respective amortized cost.
(2) Calculated based on reported losses to date, utilizing widest data set available (i.e., life-time losses, 12-month loss, etc.)
Based on the projected cash flows for our Non-Agency RMBS that are not of high credit quality, a portion of the original purchase discount is designated as Accretable Discount, which reflects the purchase discount expected to be accreted into interest income, and a portion is designated as Non-Accretable Difference, which represents the contractual principal on the security that is not expected to be collected. The amount designated as Non-Accretable Difference may be adjusted over time, based on the actual performance of the security, its underlying collateral, actual and projected cash flow from such collateral, economic conditions and other factors. If the performance of a security is more favorable than previously estimated, a portion of the amount designated as Non-Accretable Difference may be transferred to accretable discount and accreted into interest income over time. Conversely, if the performance of a security is less favorable than previously estimated, an OTTI may be recognized resulting in an increase in the amounts designated as Non-Accretable Difference.
The following table presents changes to Accretable Discount (net of premiums) as it pertains to our Non-Agency RMBS portfolio, excluding premiums on IOs, during the previous five quarters.
For the Quarters Ended |
|||||||||||||||
Accretable Discount (Net of Premiums) |
December 31, 2018 |
September 30, 2018 |
June 30, 2018 |
March 31, 2018 |
December 31, 2017 |
||||||||||
(dollars in thousands) |
|||||||||||||||
Balance, beginning of period |
$ |
539,020 |
$ |
540,269 |
$ |
555,444 |
$ |
582,193 |
$ |
622,982 |
|||||
Accretion of discount |
(36,287 |
) |
(35,184 |
) |
(38,110 |
) |
(37,309 |
) |
(39,640 |
) |
|||||
Purchases |
4,589 |
1,966 |
3,098 |
— |
(2,914 |
) |
|||||||||
Sales and deconsolidation |
(625 |
) |
(986 |
) |
(6,439 |
) |
174 |
— |
|||||||
Transfers from/(to) credit reserve, net |
(934 |
) |
32,955 |
26,276 |
10,386 |
1,765 |
|||||||||
Balance, end of period |
$ |
505,763 |
$ |
539,020 |
$ |
540,269 |
$ |
555,444 |
$ |
582,193 |
|||||
Liquidity and Capital Resources
General
47
Liquidity measures our ability to meet cash requirements, including ongoing commitments to repay our borrowings, purchase RMBS, residential mortgage loans and other assets for our portfolio, pay dividends and other general business needs. Our principal sources of capital and funds for additional investments primarily include earnings, principal paydowns and sales from our investments, borrowings under securitizations and re-securitizations, repurchase agreements and other financing facilities including warehouse facilities, and proceeds from equity or other securities offerings. We also maintain a certain amount of liquid, un-levered securities that we can either finance with recourse or sell if we have liquidity needs.
To meet our short term (one year or less) liquidity needs, we expect to continue to borrow funds in the form of repurchase agreements and, subject to market conditions, other types of financing. The terms of the repurchase transaction borrowings under our master repurchase agreements generally conform to the terms in the standard master repurchase agreement as published by the Securities Industry and Financial Markets Association, or SIFMA, as to repayment and margin requirements. In addition, each lender typically requires that we include supplemental terms and conditions to the standard master repurchase agreement. Typical supplemental terms and conditions include changes to the margin maintenance requirements, required haircuts or the percentage that is subtracted from the value of RMBS that collateralizes the financing, purchase price maintenance requirements, and requirements that all disputes related to the repurchase agreement be litigated or arbitrated in a particular jurisdiction. These provisions may differ for each of our lenders.
Based on our current portfolio, leverage ratio and available borrowing arrangements, we believe our assets will be sufficient to enable us to meet anticipated short-term liquidity requirements. However, a decline in the value of our collateral could cause a temporary liquidity shortfall due to the timing of margin calls on the financing arrangements and the actual receipt of the cash related to principal paydowns. If our cash resources are insufficient to satisfy our liquidity requirements, we may have to sell investments, potentially at a loss, issue debt or additional common or preferred equity securities.
To meet our longer term liquidity needs (greater than one year), we expect our principal sources of capital and funds to continue to be provided by earnings, principal paydowns and sales from our investments, borrowings under securitizations and re-securitizations, repurchase agreements and other financing facilities, as well as proceeds from equity or other securities offerings.
In addition to the principal sources of capital described above, we may enter into warehouse facilities and use longer dated structured repurchase agreements. The use of any particular source of capital and funds will depend on market conditions, availability of these facilities, and the investment opportunities available to us.
Current Period
We held cash and cash equivalents of approximately $47 million, $64 million and $178 million at December 31, 2018, 2017 and 2016, respectively. As a result of our operating, investing and financing activities described below, our cash position decreased by $17 million from December 31, 2017 to December 31, 2018.
Our operating activities provided net cash of approximately $298 million, $487 million and $553 million for the years ended December 31, 2018, 2017 and 2016, respectively. The cash provided by our operations is primarily due to interest received in excess of interest paid during the period. For the years ended December 31, 2018, 2017 and 2016, interest received net of interest paid was $636 million, $580 million and $582 million, respectively.
Our investing activities used cash of $6.0 billion, $4.3 billion and $1.3 billion for the years ended December 31, 2018, 2017 and 2016, respectively. During the year ended December 31, 2018, we used cash for investment purchases of $9.7 billion, primarily Agency MBS and Loans held for investments. This cash used was offset in part by cash received for principal repayments on our Agency MBS, Non-Agency RMBS, and Loans held for investments of $2.9 billion and sale of investments of $791 million. During the year ended December 31, 2017, we purchased investments of $7.9 billion, primarily Loans held for investments. This cash used was offset in part by cash received for principal repayments on our Agency MBS, Non-Agency MBS and securitized loans of $2.8 billion and investment sales of $749 million. During the year ended December 31, 2016, we purchased investments of $6.1 billion, primarily Loans held for investments. The cash used was offset in part by cash received on sales of investments of $2.7 billion, primarily Agency RMBS, and principal repayments on our Agency MBS, Non-Agency MBS and securitized loans of $2.2 billion.
Our financing activities provided cash of $5.7 billion, $3.7 billion and $781 million for the years ended December 31, 2018, 2017 and 2016, respectively. During the year ended December 31, 2018, we received cash from net proceeds on our repurchase agreements of $6.8 billion, debt issuance of $1.8 billion, and Series C preferred stock offering of $252 million. These receipts of cash were offset in part by cash used for repayment of principal on our securitized debt of $2.7 billion, common and preferred dividends paid of $418 million, and repurchase of common stock of $15 million. During the year ended December 31, 2017, we received cash of $5.2 billion from debt issuance, $1.6 billion from net proceeds received on repurchase agreements
48
and $314 million from our Series B preferred stock offering. These receipts of cash provided were offset in part by repayment of principal on our securitized debt of $3.0 billion and common and preferred dividends paid of $412 million. During the year ended December 31, 2016, we received cash of $4.8 billion on debt issuance. The cash provided was offset in part by net proceeds paid on repurchase agreements of $1.8 billion, repayment of principal on our securitized debt of $1.9 billion, and dividends paid of $454 million.
Our recourse leverage was 3.8:1 and 2.0:1 for the year ended December 31, 2018, 2017, respectively. Our recourse leverage excludes the securitized debt which can only be repaid from the proceeds on the assets securing this debt in their respective VIEs. Our recourse leverage is presented as a ratio of our repurchase agreements, which are recourse to our assets and our equity.
We believe that our cash balances and liquid Agency portfolio provides an appropriate level of liquidity. Even though we have unrestricted Agency MBS investments, we expect to meet our future cash needs primarily from principal and interest payments on our portfolio and do not anticipate the need to sell unrestricted Agency MBS investments to meet our liquidity needs. We expect to continue to finance our MBS portfolio largely through repurchase agreements and loans through the securitization market. In addition, we may from time to time sell securities, issue debt, or issue equity as a source of cash to fund new purchases.
At December 31, 2018 and December 31, 2017 the remaining maturities on our RMBS and loan repurchase agreements were as follows.
December 31, 2018 |
December 31, 2017 |
|||||
(dollars in thousands) |
||||||
Overnight |
$ |
— |
$ |
— |
||
1 to 29 days |
6,326,232 |
4,745,342 |
||||
30 to 59 days |
4,620,656 |
1,206,769 |
||||
60 to 89 days |
1,504,695 |
592,865 |
||||
90 to 119 days |
169,244 |
— |
||||
Greater than or equal to 120 days |
1,409,638 |
705,476 |
||||
Total |
$ |
14,030,465 |
$ |
7,250,452 |
||
Average remaining maturity of Repurchase agreements secured by: | ||||||
Agency MBS |
30 days |
28 days |
||||
Non-agency MBS and Loans held for investment |
231 days |
93 days |
||||
We collateralize the repurchase agreements we use to finance our operations with our MBS investments. Our counterparties negotiate a ‘haircut’, which is the difference expressed in percentage terms between the fair value of the collateral and the amount the counterparty will lend to us, when we enter into a financing transaction. The size of the haircut reflects the perceived risk associated with holding the MBS by the lender. The haircut provides lenders with a cushion for daily market value movements that reduce the need for a margin call to be issued or margin to be returned as normal daily increases or decreases in MBS market values occur. At December 31, 2018, and December 31, 2017, the weighted average haircut on our repurchase agreements collateralized by Agency MBS was 4.8% and 5.1%, respectively. At December 31, 2018, the weighted average haircut on our repurchase agreements collateralized by Non-Agency MBS and Loans held for investments was 24.7% compared to 26.2% at December 31, 2017. At December 31, 2018, the weighted average borrowing rates for our repurchase agreements collateralized by Agency MBS was 2.55% and Non-Agency MBS and Loans held for investments was 4.04%. At December 31, 2017, the weighted average borrowing rates for our repurchase agreements collateralized by Agency MBS was 1.47% and Non-Agency MBS and Loans held for investment was 3.41%, respectively.
As the fair value of the Non-Agency MBS is more difficult to determine, as well as more volatile period to period than Agency MBS, the Non-Agency MBS typically requires a larger haircut. In addition, when financing assets using standard form of SIFMA Master Repurchase Agreements, the counterparty to the agreement typically nets its exposure to us on all outstanding repurchase agreements and issues margin calls if movement of the fair values of the assets in the aggregate exceeds their allowable exposure to us. A decline in asset fair values could create a margin call, or may create no margin call depending on the counterparty’s specific policy. In addition, counterparties consider a number of factors, including their aggregate exposure to us as a whole and the number of days remaining before the repurchase transaction closes prior to issuing a margin call. See
49
Note 5 to our Consolidated Financial Statements for a discussion on how we determine the fair values of the RMBS collateralizing our repurchase agreements.
The table below presents our average daily repurchase balance and the repurchase balance at each period end for the periods presented. Our balance at period-end tends to fluctuate from the average daily balances due to the adjusting of the size of our portfolio by using leverage. We continue to deploy capital for strategic purchases of investments.
Period |
Average Repurchase Balance |
Repurchase Balance at Period End |
||||
(dollars in thousands) |
||||||
Year Ended December 31, 2018 |
$ |
9,816,170 |
$ |
14,030,465 |
||
Year Ended December 31, 2017 |
$ |
6,324,174 |
$ |
7,250,452 |
||
Year Ended December 31, 2016 |
$ |
6,482,334 |
$ |
5,600,903 |
||
Quarter End December 31, 2018 |
$ |
13,082,260 |
$ |
14,030,465 |
||
Quarter End September 30, 2018 |
$ |
10,235,288 |
$ |
11,143,102 |
||
Quarter End June 30, 2018 |
$ |
8,527,325 |
$ |
9,127,048 |
||
Quarter End March 31, 2018 |
$ |
7,257,048 |
$ |
7,202,924 |
||
We are not required to maintain any specific leverage ratio. We believe the appropriate leverage for the particular assets we are financing depends on the credit quality and risk of those assets. At December 31, 2018 and December 31, 2017, the carrying value of our total debt was approximately $22.6 billion and $16.8 billion, respectively, which represented a leverage ratio for both periods of approximately 6.1:1 and 4.6:1. We include our repurchase agreements and securitized debt in the numerator of our leverage ratio and stockholders’ equity as the denominator.
At December 31, 2018, we had repurchase agreements with 30 counterparties. All of our repurchase agreements are secured by Agency, Non-Agency RMBS and Loans held for investments or, in limited circumstances, cash. Under these repurchase agreements we may not be able to reclaim our collateral but still be obligated to pay our repurchase obligations. We mitigate this risk by spreading our exposure to multiple counterparties, as well as ensuring our counterparties are highly rated. Therefore, we believe the risk of loss of our collateral posted is mitigated by the terms of our agreements. As of December 31, 2018 and December 31, 2017, we had $15.8 billion and $8.8 billion, respectively, of securities pledged against our repurchase agreement obligations.
At December 31, 2018, our repurchase agreements have original maturities ranging from less than 30 days to 1,817 days and a weighted average original maturity of 135 days. We expect to renew most of our repurchase agreements at maturity. When we renew our repurchase agreements, there is a risk that we will not be able to obtain as favorable an interest rate as a result of rising rates.
We offset the interest rate risk of our repurchase agreements primarily through the use of interest rate swaps, swaptions and treasury futures. The average remaining maturities on our interest rate swaps at December 31, 2018 range from less than 1 year to 30 years and have a weighted average maturity of approximately 7 years. All of our swaps are cleared by a central clearing house. When our interest rate swaps are in a net loss position (expected cash payments are in excess of expected cash receipts on the swaps), we post collateral as required by the terms of our swap agreements. As of December 31, 2018, we have two swaption counterparties and two futures counterparties.
Exposure to Financial Counterparties
We actively manage the number of repurchase agreement counterparties. The following table summarizes our exposure to our repurchase agreement counterparties at December 31, 2018:
50
December 31, 2018 | ||||||||||
Country |
Number of Counterparties |
Repurchase Agreement Financing |
Interest Rate Swaps at Fair Value |
Exposure (1)
|
||||||
(dollars in thousands) | ||||||||||
United States |
14 |
$ |
6,528,957 |
$ |
(118,136 |
) |
$ |
746,804 |
||
Japan |
4 |
2,557,183 |
— |
336,082 |
||||||
Canada |
4 |
1,921,025 |
— |
241,648 |
||||||
United Kingdom |
2 |
870,710 |
— |
46,882 |
||||||
Netherlands |
1 |
596,285 |
— |
30,761 |
||||||
France |
2 |
590,103 |
35,798 |
84,071 |
||||||
Switzerland |
1 |
514,303 |
— |
198,240 |
||||||
South Korea |
1 |
365,022 |
— |
23,764 |
||||||
China |
1 |
86,877 |
— |
4,837 |
||||||
Total |
30 |
$ |
14,030,465 |
$ |
(82,338 |
) |
$ |
1,713,089 |
||
(1) Represents the amount of securities pledged as collateral to each counterparty less the aggregate of repurchase agreement financing and unrealized loss on swaps for each counterparty.
Over the past several years, several large European financial institutions have experienced financial difficulty and have been either rescued by government assistance or by other large European banks or institutions. Some of these financial institutions or their U.S. subsidiaries have provided us financing under repurchase agreements or we have entered into interest rate swaps with such institutions. We have entered into repurchase agreements or exchange cleared interest rate swaps with 6 counterparties as of December 31, 2018 that are either domiciled in Europe or is a U.S.-based subsidiary of a European-domiciled financial institution.
If the European credit volatility, including countries that may choose to leave the Euro zone as Britain has, continues to impact these major European financial institutions, it is possible that it will also impact the operations of their U.S. subsidiaries. Our financings and operations could be adversely affected by such events. We monitor our exposure to our repurchase agreement and swap counterparties on a regular basis, using various methods, including review of recent rating agency actions, financial relief plans, credit spreads or other developments and by monitoring the amount of cash and securities collateral pledged and the associated loan amount under repurchase agreements or the fair value of swaps with our counterparties. We make reverse margin calls on our counterparties to recover excess collateral as permitted by the agreements governing our financing arrangements or interest rate swaps, or may try to take other actions to reduce the amount of our exposure to a counterparty when necessary.
At December 31, 2018, we did not use credit default swaps or other forms of credit protection to hedge the exposures summarized in the table above.
Stockholders’ Equity
In February 2018, our Board of Directors reauthorized $100 million under our share repurchase program, or the Repurchase Program. Such authorization does not have an expiration date and, at present, there is no intention to modify or otherwise rescind such authorization. Shares of our common stock may be purchased in the open market, including through block purchases, through privately negotiated transactions, or pursuant to any trading plan that may be adopted in accordance with Rule 10b5-1 of the Securities Exchange Act of 1934, as amended. The timing, manner, price and amount of any repurchases will be determined at our discretion and the program may be suspended, terminated or modified at any time for any reason. Among other factors, we intend to only consider repurchasing shares of our common stock when the purchase price is less than the last publicly reported book value per common share. In addition, we do not intend to repurchase any shares from directors, officers or other affiliates. The program does not obligate us to acquire any specific number of shares, and all repurchases will be made in accordance with Rule 10b-18, which sets certain restrictions on the method, timing, price and volume of stock repurchases.
Pursuant to our Repurchase Program, during the first quarter of 2018, we repurchased approximately 883 thousand shares of our common stock at an average price of $16.81 per share for a total of $15 million. There were no other stock repurchases during the year ended December 31, 2018. Other than a de minimis amount issued under our Dividend Reinvestment Plan and
51
as discussed below under “Restricted Stock Grants,” we did not issue any common shares during the years ended December 31, 2018 and 2017.
In September 2018, we issued 10,400,000 shares of 7.75% Series C Fixed-to-Floating Rate Cumulative Redeemable Preferred Stock, par value $0.01 per share, or the Series C Preferred Stock, at a public offering price of $25.00 per share and for net proceeds to us of $252 million. The Series C Preferred Stock is redeemable at $25.00 per share plus accrued and unpaid dividends (whether or not authorized or declared) exclusively at our option commencing in September 30, 2025, subject to our right, under limited circumstances, to redeem the Series C Preferred Stock prior to that date. The initial dividend rate for the Series C Preferred Stock, from and including September 20, 2018, to but not including September 30, 2025, will be equal to 7.75% per annum of the $25.00 liquidation preference per share (equivalent to the fixed annual rate of $1.9375 per share). On and after September 30, 2025, dividends on the Series C Preferred Stock will accumulate at a percentage of the $25.00 liquidation preference equal to an annual floating rate of the three-month LIBOR plus a spread of 4.743% per annum. The Series C Preferred Stock is entitled to receive, when and as declared, a dividend at a rate of 7.75% per year on the $25.00 liquidation preference before the common stock is paid any dividends and is senior to the common stock with respect to distributions upon liquidation, dissolution or winding up.
We declared dividends to Series A preferred stockholders of $12 million, or $2.00 per preferred share, during the year ended December 31, 2018 and 2017, respectively.
We declared dividends to Series B preferred stockholders of $26 million and $22 million, or $2.00 and $1.68 per preferred share, during the year ended December 31, 2018 and 2017, respectively.
We declared dividends to Series C preferred stock holders of $6 million, or $0.54 per preferred share during the year ended December 31, 2018.
Restricted Stock Unit Grants
During the years ended December 31, 2018 and 2017, we granted certain of our employees and directors Restricted Stock Units, or RSU awards. RSU awards are designed to reward our employees for services provided over the previous year. Generally, the RSU awards vest equally over a three-year period beginning from the grant date and will fully vest after three years. The RSU awards are valued at the market price of our common stock on the grant date and the employees must be employed by us on the vesting dates to receive the RSU awards. We granted 335 thousand and 204 thousand RSU awards during the year ended December 31, 2018 and 2017, with a grant date fair value of $6 million and $4 million, respectively, which will be recognized as compensation expense on a straight-line basis over the three year vesting period.
During the years ended December 31, 2018 and 2017, we granted certain employees 133 thousand and 144 thousand Performance Share Units, or PSU awards, respectively. PSU awards are designed to align compensation with our future performance. The PSU awards include a three-year performance period ending on December 31, 2020 and December 31, 2019, respectively. The final number of shares that will vest will be between 0% to 150% of the total PSU awards granted based on our total shareholder return as compared to an index of comparable financial institutions and will cliff vest at the end of the performance period. The PSU awards are measured at fair value on the grant date which will be recognized as compensation expense ratably over the three-year vesting period. Fair value is determined using a Monte Carlo valuation model developed to value the specific features of the PSU awards, including market based conditions. Inputs into the model include our historical volatility, the peer average historical volatility, and the correlation coefficient of the volatility. In addition, inputs also included the share price at the beginning of the measurement period and an estimated total shareholder return for both us and the peer group of comparable financial institutions. Based on the model results, the 133 thousand PSU awards granted during 2018 had a grant date value of $2 million that will cliff vest on December 31, 2020. The 144 thousand PSU awards granted during 2017 had a grant date value of $3 million which will cliff vest on December 31, 2019.
At December 31, 2018 and December 31, 2017, there were approximately 1.2 million and 770 thousand unvested shares of restricted stock units issued to our employees, respectively.
Contractual Obligations and Commitments
The following tables summarize our contractual obligations at December 31, 2018 and December 31, 2017. The estimated principal repayment schedule of the securitized debt is based on expected cash flows of the residential mortgage loans or RMBS, as adjusted for expected principal writedowns on the underlying collateral of the debt.
52
December 31, 2018 | |||||||||||||||
(dollars in thousands) | |||||||||||||||
Contractual Obligations |
Within One Year |
One to Three Years |
Three to Five Years |
Greater Than or Equal to Five Years |
Total |
||||||||||
Repurchase agreements |
$ |
13,521,878 |
$ |
257,916 |
$ |
250,671 |
$ |
— |
$ |
14,030,465 |
|||||
Securitized debt, collateralized by Non-Agency RMBS |
23,602 |
30,803 |
8,047 |
3,605 |
66,057 |
||||||||||
Securitized debt at fair value, collateralized by loans held for investment |
1,608,381 |
2,587,635 |
1,949,060 |
2,237,259 |
8,382,335 |
||||||||||
Interest expense on RMBS repurchase agreements (1)
|
85,434 |
584 |
1,434 |
— |
87,452 |
||||||||||
Interest expense on securitized debt (1)
|
372,841 |
536,560 |
320,566 |
422,531 |
1,652,498 |
||||||||||
Total |
$ |
15,612,136 |
$ |
3,413,498 |
$ |
2,529,778 |
$ |
2,663,395 |
$ |
24,218,807 |
|||||
(1) Interest is based on variable rates in effect as of December 31, 2018.
December 31, 2017 | |||||||||||||||
(dollars in thousands) | |||||||||||||||
Contractual Obligations |
Within One Year |
One to Three Years |
Three to Five Years |
Greater Than or Equal to Five Years |
Total |
||||||||||
Repurchase agreements |
$ |
6,903,337 |
$ |
347,115 |
$ |
— |
$ |
— |
$ |
7,250,452 |
|||||
Securitized debt, collateralized by Non-Agency RMBS |
42,217 |
45,916 |
16,524 |
4,867 |
109,524 |
||||||||||
Securitized debt at fair value, collateralized by loans held for investment |
1,819,018 |
2,872,572 |
2,140,434 |
2,439,872 |
9,271,896 |
||||||||||
Interest expense on RMBS repurchase agreements (1)
|
30,091 |
978 |
— |
— |
31,069 |
||||||||||
Interest expense on securitized debt (1)
|
392,416 |
606,509 |
368,553 |
472,640 |
1,840,118 |
||||||||||
Total |
$ |
9,187,079 |
$ |
3,873,090 |
$ |
2,525,511 |
$ |
2,917,379 |
$ |
18,503,059 |
|||||
(1) Interest is based on variable rates in effect as of December 31, 2017.
Not included in the table above are the unfunded construction loan commitments of $1.1 billion and $567 million as of December 31, 2018 and December 31, 2017, respectively, which will primarily be paid within one year of reported periods and are reported under Payables for investments purchased in our Consolidated Statements of Financial Condition.
We have made a $25 thousand investment to acquire 24.9% ownership interest in KAH Capital through one of our taxable REIT subsidiary. In addition to the investment in KAH Capital, we have made a $150 million capital commitment to Hains Point (Hains Point), which is KAH Capital’s initial fund for which we are the sole investor. KAH Capital will manage the investments in Hains Point including asset selection, repurchase and other financing arrangements as well as hedging transactions. Capital calls for investments made in Hains Point are subject to our consent and approval. We expect that KAH Capital will earn $6.5 million over approximately 3 years for its investment advisory services.
Off-Balance Sheet Arrangements
We do not have any relationships with unconsolidated entities or financial partnerships, such as entities often referred to as structured finance or special purpose entities, which would have been established for the purpose of facilitating off-balance sheet arrangements or other contractually narrow or limited purposes. Further, we have not guaranteed any obligations of unconsolidated entities nor do we have any commitment or intent to provide funding to any such entities.
Capital Expenditure Requirements
At December 31, 2018 and December 31, 2017, we had no material commitments for capital expenditures.
Dividends
53
To maintain our qualification as a REIT, we must pay annual dividends to our stockholders of at least 90% of our taxable income (subject to certain adjustments). We intend to pay regular quarterly dividends to our stockholders. Before we pay any dividend, we must first meet any operating requirements and scheduled debt service on our financing facilities and other debt payable.
Inflation
A significant portion of our assets and liabilities are interest rate sensitive in nature. As a result, interest rates and other factors influence our performance far more so than does inflation. Changes in interest rates do not necessarily correlate with inflation rates or changes in inflation rates. Our consolidated financial statements are prepared in accordance with GAAP and our distributions will be determined by our Board of Directors consistent with our obligation to distribute to our stockholders at least 90% of our REIT taxable income (subject to certain adjustments) on an annual basis in order to maintain our REIT qualification; in each case, our activities and financial condition are measured with reference to historical cost or fair market value without considering inflation.
Critical Accounting Policies and Estimates
Accounting policies are integral to understanding our Management’s Discussion and Analysis of Financial Condition and Results of Operations. The preparation of financial statements in accordance with GAAP requires management to make certain judgments and assumptions, on the basis of information available at the time of the financial statements, in determining accounting estimates used in the preparation of these statements. Our significant accounting policies and accounting estimates are described in Note 2 to the Consolidated Financial Statements. Critical accounting policies are described in this section. An accounting policy is considered critical if it requires management to make assumptions or judgments about matters that are highly uncertain at the time the accounting estimate was made or require significant management judgment in interpreting the accounting literature. If actual results differ from our judgments and assumptions, or other accounting judgments were made, this could have a significant and potentially adverse impact on our financial condition, results of operations and cash flows. These critical accounting policies were developed by management, and reviewed by our auditors, prior to being presented to and discussed with the Audit Committee of the Board of Directors.
The consolidated financial statements include, on a consolidated basis, our accounts, the accounts of our wholly-owned subsidiaries, and variable interest entities, or VIEs, for which we are the primary beneficiary. All significant intercompany balances and transactions have been eliminated in consolidation.
Use of Estimates
The preparation of financial statements in conformity with GAAP requires management to make estimates and assumptions that affect the reported amounts of assets and liabilities and disclosure of contingent assets and liabilities at the date of the financial statements and the reported amounts of revenues and expenses during the reporting period. Although our estimates contemplate current conditions and how we expect them to change in the future, it is reasonably possible that actual conditions could be different than anticipated in those estimates, which could materially adversely impact our results of operations and our financial condition. Management has made significant estimates in several areas, including OTTI of Non-Agency RMBS, valuation of Loans held for investments, Agency and Non-Agency RMBS and interest rate swaps and income recognition on Loans held for investments and Non-Agency RMBS. Actual results could differ materially from those estimates.
Interest Income and Impairment on Non-Agency and Agency Residential Mortgage-Backed Securities
We invest in RMBS representing interests in obligations backed by pools of residential mortgage loans. We delineate between (1) Agency RMBS and (2) Non-Agency RMBS as follows: The Agency RMBS are mortgage pass-through certificates, collateralized mortgage obligations, or CMOs, and other RMBS representing interests in or obligations backed by pools of residential mortgage loans issued or guaranteed as to principal and/or interest repayment by agencies of the U.S. Government or federally chartered corporations such as Ginnie Mae, Freddie Mac or Fannie Mae. The Non-Agency RMBS are not issued or guaranteed by Fannie Mae, Freddie Mac, or Ginnie Mae and are therefore subject to credit risk.
We hold certain of our RMBS as available-for-sale, record these investments at estimated fair value as described in Note 5 of our consolidated financial statements, and include unrealized gains and losses considered to be temporary in Other comprehensive income in our Consolidated Statements of Operations. The unrealized gains and losses on RMBS investments for which we have elected fair value option, are included in Net unrealized gains and losses on financial instruments at fair value in our Consolidated Statements of Operations. From time to time, as part of the overall management of our portfolio, we may sell any of our RMBS investments and recognize a realized gain or loss as a component of earnings in our Consolidated Statements of Operations utilizing the average method.
54
Our accounting policies for recognition of interest income and OTTI related to RMBS are described in Note 2 of the consolidated financial statements. As noted therein, there are three different accounting models that may be applicable for purposes of the recognition of interest income and OTTI on RMBS, and include the following:
ASC 310-20, Nonrefundable Fees and Other Costs (ASC 310-20) - applies to certain Agency MBS and certain Non-Agency RMBS of high credit quality that, at the time of purchase, we expect to collect all contractual cash flows and the security cannot be contractually prepaid in such a way that we would not recover substantially all of our recorded investment.
ASC 310-30, Loans and Debt Securities Acquired with Deteriorated Credit Quality (ASC 310-30) - applies to Non-Agency RMBS where there is evidence of deterioration in credit quality and we do not expect to collect all contractual cash flows of the security.
ASC 325-40, Beneficial Interests in Securitized Financial Assets (ASC 325-40) - applies to certain Non-Agency RMBS and Agency MBS for which we have elected fair value option and are not within the scope of ASC 310-20 or ASC 310-30. These include Non-Agency RMBS which is not of high credit quality at the time of purchase or that can be contractually prepaid or otherwise settled in such a way that we would not recover substantially all of our recorded investment.
The determination of which accounting model to apply will have a significant impact on the amounts of interest income and OTTI losses reflected in the results of operations because each accounting model has different requirements regarding the cash flows used to calculate interest income and impairments (i.e., contractual cash flows vs. expected cash flows) and the manner of such calculations, and the impact of changes in prepayment assumptions on interest income or OTTI losses.
For Agency and Non-Agency MBS accounted for under ASC 310-20, the amount of interest income recorded over the life of a security will be equal to the contractual cash flows of the security and the accretion/amortization of any purchase discount or premium. The amount of interest income reported in any particular financial reporting period will, however, vary depending on the actual and estimated prepayments on the security. For Agency MBS purchased at a premium to the principal amount, increases in prepayment speeds will generally result in a reduction of the recorded amount of interest income in a particular financial reporting period whereas decreases in prepayment speeds will generally result in an increase in the amount of interest income in a particular financial reporting period. The opposite is generally the case for Agency MBS purchased at a discount to the principal amount. That is, as prepayment speeds increase, interest income reported in a particular financial reporting period will generally increase, whereas interest income reported in a particular financial reporting period will generally decrease when prepayment speeds decline. However, volatility in the reported amount of interest income will result when there are significant changes in actual or future expected prepayment speeds regardless of the direction of those changes. This volatility is because the accounting model that we apply under ASC 310-20 requires us to record a cumulative adjustment, on a retrospective basis from the acquisition date of the security, when there are changes in prepayment speeds. That cumulative adjustment at each reporting date is intended to reflect the most current estimate of the timing of prepayments over the life of the security (both actual prepayments that have occurred in the past and the timing of prepayments that will occur in the future).
Agency MBS and Non-Agency RMBS accounted for under ASC 310-20 may experience an OTTI loss. The OTTI loss recognized in earnings will be calculated based on the present value of the contractual cash flows expected to be collected. Subsequent to recognition of an OTTI loss, we recognize income on these securities under ASC 310-30 as further described below.
For Non-Agency RMBS accounted for under ASC 310-30 or ASC 325-40, the reported amounts of interest income and OTTI are significantly impacted by management judgments around both the amount and timing of credit losses (defaults) and prepayments. Interest income on these Non-Agency RMBS is recognized initially and in subsequent periods based on the timing and amount of cash flows expected to be collected, as opposed to being based on contractual cash flows. The accounting models in ASC 310-30 and ASC 325-40 do not provide for delineations between individual changes in cash flow estimates based on expected defaults or prepayments. Accordingly, we are required to consider the overall impact on the amount and timing of future cash flows whether due to changes in default expectations or prepayments to determine the amount of interest income to recognize. Furthermore, the overall impact on the amount and timing of future cash flows whether due to changes in default expectations or prepayments also impacts the amount of OTTI losses recognized in earnings.
Non-Agency RMBS accounted for under ASC 310-30 or ASC 325-40 is generally purchased at a discount to the principal amount. At the original acquisition date, we estimate the timing and amount of cash flows expected to be collected and calculate the present value of those amounts to our purchase price. In each subsequent financial reporting period, we are required to revise our estimates of the remaining timing and amount of cash flows expected to be collected. Depending on the nature of the changes in the timing or amount of cash flows expected to be collected, whether due to changes in default expectations or prepayment assumptions, the following will occur:
55
• |
If there is a positive change in the amount and timing of future cash flows expected to be collected from the previous estimate used for accounting purposes, the effective interest rate in future accounting periods may increase resulting in an increase in the reported amount of interest income in future periods. A positive change in the amount and timing of future cash flows expected to be collected from the previous estimate used for accounting purposes must be considered significant for Non-Agency RMBS accounted for under ASC 310-30 for the effective interest rate in future accounting periods to increase. A positive change in the amount and timing of future cash flows expected to be collected is considered to have occurred when the net present value of future cash flows expected to be collected has increased from the previous estimate. This can occur from a change in either the timing of when cash flows are expected to be collected (i.e., from changes in prepayment speeds or the timing of estimated defaults) or in the amount of cash flows expected to be collected (i.e., from reductions in estimates of future defaults). Furthermore, a positive change could occur on an overall basis in situations where the positive impact of a change in the timing of cash flows exceeds the negative impact of increased defaults, or when the positive impact of a decline in estimated defaults exceeds the negative impact of an extension of the timing of receipt of cash flows. |
• |
If there is a negative (or adverse) change in the amount and timing of future cash flows expected to be collected from the previous estimate used for accounting purposes, and the securities’ fair value is below its amortized cost, an OTTI loss equal to the adverse change in cash flows expected to be collected, discounted using the securities’ effective rate before impairment, is required to be recorded in current period earnings. For Non-Agency RMBS accounted for under ASC 310-30, while the effective interest rate used to accrete interest income after an OTTI has been recognized will be the same, the amount of interest income recorded in future periods will decline because of the reduced balance of the amortized cost basis of the investment to which such effective interest rate is applied. |
Additionally, for Non-Agency RMBS accounted for under ASC 325-40, while the effective interest rate used to accrete interest income during the period directly after an OTTI has been recognized will be the same, the amount of interest income recorded in such future period will decline, absent an increase in cash flows expected to be collected, because of the reduced amount of the amortized cost basis of the investment to which such effective interest rate is applied. An adverse change in the amount and timing of future cash flows expected to be collected is considered to have occurred when the net present value of future cash flows expected to be collected has decreased from the most previous estimate. This change can occur from a change in either the timing of when cash flows are expected to be collected (i.e., from changes in prepayment speeds or the timing of estimated defaults) or in the amount of cash flows expected to be collected (i.e., from increases in estimates of future defaults). Furthermore, an adverse change could occur on an overall basis in situations where the negative impact of a change in the timing of cash flows exceeds the positive impact of a decline in estimated defaults, or when the negative impact of an increase in estimated defaults exceeds the positive impact of a shortening of the timing of receipt of cash flows.
The accounting models in ASC 310-30 and ASC 325-40 are impacted by both assumptions of prepayments and assumptions of credit losses (defaults) and, accordingly, changes in the amounts of recorded interest income or OTTI losses over financial reporting periods cannot be considered to result solely from the impact of changes in the credit profile of the investment or solely from the impact of changes in prepayment speeds. Furthermore, while there may be some level of correlation between assumptions for defaults and prepayments as general market interest rates change, in the recent market conditions that correlation has not been direct or predictable.
Interest Income on Loans held for investments at fair value
Interest income on Loans held for investments at fair value is accounted for under ASC 325-40. Interest income on these Loans held for investments at fair value is recognized initially and in subsequent periods based on the timing and amount of cash flows expected to be collected, as opposed to being based on contractual cash flows. The accounting models in ASC 325-40 do not provide for delineations between individual changes in cash flow estimates based on expected defaults or prepayments. Accordingly, we are required to consider the overall impact on the amount and timing of future cash flows whether due to changes in default expectations or prepayments to determine the amount of interest income to recognize. At the original acquisition date, we estimate the timing and amount of cash flows expected to be collected and calculate the present value of those amounts to our purchase price. In each subsequent financial reporting period, we are required to revise our estimates of the remaining timing and amount of cash flows expected to be collected.
Determination of appropriate accounting model for Non-Agency RMBS
As discussed in Note 2 to the consolidated financial statements, the determination of the appropriate accounting model for Non-Agency RMBS is dependent on management’s assessment and judgment related to the following factors made as of the acquisition date:
56
• |
Our assessment of the credit quality of the asset, including its credit rating at the acquisition date and whether the security has experienced deterioration in credit quality since its inception. |
• |
Our assessment of the probability of collection of all contractual cash flows. |
• |
Our assessment of whether the security can be contractually prepaid such that we would not recover our initial investment. |
The most critical judgment inherent in the determination of the appropriate accounting model is our assessment of the cash flows expected to be collected at the acquisition date. In making this accounting judgment, we consider expected defaults and prepayments as further described below.
Impact of prepayment assumptions on MBS accounted for under ASC 310-20
Changes in actual prepayments will impact the amount of interest income recognized in each financial reporting period for MBS accounted for under ASC 310-20. We estimate expected prepayment as further described below.
Impact of default and prepayment assumptions on Non-Agency RMBS accounted for under ASC 310-30 and ASC 325-40
In determining the OTTI related to credit losses for Non-Agency RMBS securities accounted for under ASC 310-30 and ASC 325-40, we compare the present value of the remaining cash flows expected to be collected at the purchase date (or last date previously revised) against the present value of the cash flows expected to be collected at the current financial reporting date. The discount rate used to calculate the present value of expected future cash flows is the effective interest rate or effective yield used for income recognition purposes.
Variable Interest Entities
VIEs are defined as entities in which equity investors (i) do not have the characteristics of a controlling financial interest, and/or (ii) do not have sufficient equity at risk for the entity to finance its activities without additional subordinated financial support from other parties. The entity that consolidates a VIE is known as its primary beneficiary, and is generally the entity with (i) the power to direct the activities that most significantly impact the VIE’s economic performance, and (ii) the right to receive benefits from the VIE or the obligation to absorb losses of the VIE that could be significant to the VIE. For VIEs’ that do not have substantial on-going activities, the power to direct the activities that most significantly impact the VIEs’ economic performance may be determined by an entity’s involvement with the design of the VIE.
Our Consolidated Statements of Financial Condition contain the assets and liabilities related to twenty-nine consolidated variable interest entities, or VIEs. Due to the non-recourse nature of these VIEs our net exposure to loss from investments in these entities is limited to our retained beneficial interests.
At December 31, 2018, we consolidated twenty-five residential mortgage loan securitizations and four RMBS re-securitization transactions which are VIEs. The residential mortgage loan securitizations contain jumbo prime and sub prime residential mortgage loans. The RMBS re-securitization transactions contain Non-Agency RMBS comprised of primarily what we classify as collateral backed by Alt-A first lien mortgages of 2005-2007 vintages. We categorize collateral as Alt-A regardless of whether the loans were originally described as “prime” if the behavior of the collateral when we purchased the security more resembles typical Alt-A collateral. We define Alt-A collateral characteristics to be evidenced by the 60+ day delinquency bucket of the pool being greater than 5% and the weighted average FICO scores at the time of origination as greater than 650.
Our determination to consolidate these twenty-nine VIEs was significantly influenced by management’s judgment related to the activities that most significantly impact the economic performance of these entities and the identification of the party with the power over such activities. For the residential mortgage loan securitizations, we determined that our ability to direct the servicer resulted in us having the power that most significantly impacts the economic performance of the VIE. For the four consolidated RMBS re-securitization transactions, we determined that no party has power over any ongoing activities of the entities and therefore the determination of the primary beneficiary should be based on involvement with the initial design of the entity. Since we transferred the RMBS to the securitization entities, we determined we had the power over the design of the entity, which resulted in us being considered the primary beneficiary. This determination was influenced by the amount of economic exposure to the financial performance of the entity and required a significant management judgment in determining that we should consolidate these four entities.
Due to the consolidation of these VIEs, our actual ownership interests in the securitization and re-securitizations have been eliminated in consolidation and the Consolidated Statements of Financial Condition reflect both the assets held and non-recourse debt issued to third parties by these VIEs. In addition, our operating results and cash flows include the gross amounts
57
related to the assets and liabilities of the VIEs as opposed to the actual economic interests we own in these VIEs. Our interest in these VIEs is restricted to the beneficial interests we retained in these transactions. We are not obligated to provide any financial support to these VIEs.
Our Consolidated Statements of Financial Condition separately present: (i) our direct assets and liabilities, and (ii) the assets and liabilities of our consolidated securitization vehicles. Assets of all consolidated VIEs can only be used to satisfy the obligations of those VIEs, and the liabilities of consolidated VIEs are non-recourse to us.
We have aggregated all the assets and liabilities of the consolidated securitization vehicles due to our determination that these entities are substantively similar and therefore a further disaggregated presentation would not be more meaningful. The notes to our consolidated financial statements describe our direct assets and liabilities and the assets and liabilities of our consolidated securitization vehicles. See Note 8 to our consolidated financial statements for additional information related to our investments in VIEs.
Fair Value Measurements
The Financial Accounting Standards Board, or FASB, defines fair value, establishes a framework for measuring fair value, and requires certain disclosures about fair value measurements under GAAP. Specifically, this guidance defines fair value based on exit price, or the price that would be received upon the sale of an asset or the transfer of a liability in an orderly transaction between market participants at the measurement date. Valuation techniques for RMBS are based on models that consider the estimated cash flows expected to be collected from the underlying collateral and an estimated market-based yield reflective of the unique attributes of the tranche including, but not limited to, assumptions related to prepayment speeds, the frequency and severity of defaults and attributes of the collateral underlying such securities. Estimates of the fair value of RMBS are particularly sensitive to assumptions related to the expected timing of prepayments, the extent of defaults, and the severity of expected losses. Management reviews the fair values generated by the model to determine whether prices are reflective of the current market. Management indirectly corroborates its estimates of the fair value using pricing models by comparing its results to independent prices provided by third party pricing services.
To the extent the inputs used to estimate fair value are observable, the values would be categorized in Level 2 of the fair value hierarchy; otherwise they would be categorized as Level 3. The Company’s fair value estimation process utilizes inputs other than quoted prices that are observed in the market. The Company’s estimate of prepayment, default and severity curves all involve adjustments that are deemed to be significant to the fair value measurement process, which renders the resulting Non-Agency fair value estimates Level 3 inputs in the fair value hierarchy. Level 3 assets represent approximately 55% and 79% of total assets measured at fair value on a recurring basis as of December 31, 2018 and 2017, respectively. Level 3 liabilities represent approximately 98% and 100% of total liabilities measured at fair value on a recurring basis as of December 31, 2018 and 2017.
Our assets and liabilities which are measured at fair value are discussed in Note 5 to our consolidated financial statements.
Recent Accounting Pronouncements
Refer to Note 2(o) in the Notes to Consolidated Financial Statements for a discussion of accounting guidance recently adopted by the Company or expected to be adopted by the Company in the future.
Item 7A. Quantitative and Qualitative Disclosures about Market Risk
The primary components of our market risk are related to credit risk, interest rate risk, prepayment risk, market value risk and real estate risk. While we do not seek to avoid risk completely, we believe the risk can be quantified from historical experience and we seek to actively manage that risk and to maintain capital levels consistent with the risks we undertake.
Credit Risk
We are subject to credit risk in connection with our investments in Non-Agency RMBS and residential mortgage loans and face more credit risk on assets we own which are rated below ‘‘AAA’’. The credit risk related to these investments pertains to the ability and willingness of the borrowers to pay, which is assessed before credit is granted or renewed and periodically reviewed throughout the loan or security term. We believe that residual loan credit quality, and thus the quality of our assets, is primarily determined by the borrowers’ credit profiles and loan characteristics.
In connection with loan acquisitions, we or a third party performs an independent review of the mortgage file to assess the origination and servicing of the mortgage loan as well as our ability to enforce the contractual rights in the mortgage.
58
Depending on the size of the loans, we may not review all of the loans in a pool, but rather a sample of loans for diligence review based upon specific risk-based criteria such as property location, loan size, effective loan-to-value ratio, borrower’s credit score and other criteria we believe to be important indicators of credit risk. Additionally, we obtain representations and warranties from each seller with respect to the residential mortgage loans, including the origination and servicing of the mortgage loan as well as the enforceability of the lien on the mortgaged property. A seller who breaches these representations and warranties in making a loan that we purchase may be obligated to repurchase the loan from us. Our resources include a portfolio management system, as well as third party software systems. We utilize third party due diligence firms to perform an independent mortgage loan file review to ensure compliance with existing guidelines. In addition to statistical sampling techniques, we create adverse credit and valuation samples, which we individually review.
Additionally, the Non-Agency RMBS and other ABS which we acquire for our portfolio are reviewed by us to ensure that they satisfy our risk based criteria. Our review of Non-Agency RMBS and other ABS includes utilizing a robust portfolio management system. Our review of Non-Agency RMBS and other ABS is based on quantitative and qualitative analysis of the risk-adjusted returns on Non-Agency RMBS and other ABS. This analysis includes an evaluation of the collateral characteristics supporting the RMBS such as borrower payment history, credit profiles, geographic concentrations, credit enhancement, seasoning, and other pertinent factors.
Interest Rate Risk
Interest rate risk is highly sensitive to many factors, including governmental, monetary and tax policies, domestic and international economic and political considerations and other factors beyond our control. We are subject to interest rate risk in connection with our investments and our related debt obligations, which are generally repurchase agreements, warehouse facilities and securitization/re-securitization trusts. Our repurchase agreements and warehouse facilities may be of limited duration that is periodically refinanced at current market rates. We intend to mitigate this risk through utilization of derivative contracts, primarily interest rate swap agreements, swaptions, futures and mortgage options.
Interest Rate Effects on Net Interest Income
Our operating results depend, in large part, on differences between the income from our investments and our borrowing costs. Most of our warehouse facilities and repurchase agreements provide financing based on a floating rate of interest calculated on a fixed spread over LIBOR. The fixed spread varies depending on the type of underlying asset which collateralizes the financing. During periods of rising interest rates, the borrowing costs associated with our investments tend to increase while the income earned on our investments may remain substantially unchanged or decrease. This will result in a narrowing of the net interest spread between the related assets and borrowings and may even result in losses. Further, during this portion of the interest rate and credit cycles, defaults could increase and result in credit losses to us, which could adversely affect our liquidity and operating results. Such delinquencies or defaults could also have an adverse effect on the spread between interest-earning assets and interest-bearing liabilities. Hedging techniques are partly based on assumed levels of prepayments of our fixed-rate and hybrid adjustable-rate residential mortgage loans and RMBS. If prepayments are slower or faster than assumed, the life of the residential mortgage loans and RMBS will be longer or shorter, which would reduce the effectiveness of any hedging strategies we may use and may cause losses on such transactions.
Interest Rate Effects on Fair Value
Another component of interest rate risk is the effect changes in interest rates will have on the fair value of the assets we acquire. We face the risk that the fair value of our assets will increase or decrease at different rates than that of our liabilities, including our hedging instruments. We primarily assess our interest rate risk by estimating the duration of our assets compared to the duration of our liabilities and hedges. Duration essentially measures the market price volatility of financial instruments as interest rates change. We generally calculate duration using various financial models and empirical data. Different models and methodologies can produce different duration numbers for the same securities.
It is important to note that the impact of changing interest rates on fair value can change significantly when interest rates change beyond 100 basis points from current levels. Therefore, the volatility in the fair value of our assets could increase significantly when interest rates change beyond 100 basis points. In addition, other factors impact the fair value of our interest rate-sensitive investments and hedging instruments, such as the shape of the yield curve, market expectations as to future interest rate changes and other market conditions. Accordingly, in the event of changes in actual interest rates, the change in the fair value of our assets would likely differ from that shown below and such difference might be material and adverse to our stockholders.
Interest Rate Cap Risk
59
We may also invest in adjustable-rate residential mortgage loans and RMBS. These are mortgages or RMBS in which the underlying mortgages are typically subject to periodic and lifetime interest rate caps and floors, which limit the amount by which the security’s interest yield may change during any given period. However, our borrowing costs pursuant to our financing agreements will not be subject to similar restrictions. Therefore, in a period of increasing interest rates, interest rate costs on our borrowings could increase without limitation by caps, while the interest-rate yields on our adjustable-rate residential mortgage loans and RMBS would effectively be limited. This problem will be magnified to the extent we acquire adjustable-rate RMBS that are not based on mortgages which are fully indexed. In addition, the mortgages or the underlying mortgages in an RMBS may be subject to periodic payment caps that result in some portion of the interest being deferred and added to the principal outstanding. This could result in our receipt of less cash income on our adjustable-rate mortgages or RMBS than we need in order to pay the interest cost on our related borrowings. These factors could lower our net interest income or cause a net loss during periods of rising interest rates, which would harm our financial condition, cash flows and results of operations.
Interest Rate Mismatch Risk
We fund a substantial portion of our acquisitions of RMBS with borrowings that have interest rates based on indices and re-pricing terms similar to, but of somewhat shorter maturities than, the interest rate indices and re-pricing terms of the mortgages and RMBS. In most cases the interest rate indices and re-pricing terms of our mortgage assets and our funding sources will not be identical, thereby creating an interest rate mismatch between assets and liabilities. Our cost of funds would likely rise or fall more quickly than would our earnings rate on assets. During periods of changing interest rates, such interest rate mismatches could negatively impact our financial condition, cash flows and results of operations. To mitigate interest rate mismatches, we may utilize the hedging strategies discussed above. Our analysis of risks is based on our experience, estimates, models and assumptions. These analyses rely on models which utilize estimates of fair value and interest rate sensitivity. Actual economic conditions or implementation of investment decisions by our management may produce results that differ significantly from the estimates and assumptions used in our models and the projected results shown in this Form 10-K.
Our profitability and the value of our portfolio (including derivatives) may be adversely affected during any period as a result of changing interest rates. The following table quantifies the potential changes in net interest income and portfolio value for our Agency MBS portfolio and related swaptions, Treasury futures and our swap portfolio, if interest rates go up or down 50 and 100 basis points, assuming parallel movements in the yield curves. All changes in income and value are measured as percentage changes from the projected net interest income and portfolio value at the base interest rate scenario. The base interest rate scenario assumes interest rates at December 31, 2018 and various estimates regarding prepayment and all activities are made at each level of rate change. Actual results could differ significantly from these estimates.
December 31, 2018 |
||||
Change in Interest Rate |
Projected Percentage Change in Net Interest Income (1)
|
Projected Percentage Change in Portfolio Value with Effect of Interest Rate Swaps and Other Hedging Transactions (2)
|
||
-100 Basis Points |
10.98 |
% |
(1.16 |
)% |
-50 Basis Points |
5.58 |
% |
(0.30 |
)% |
Base Interest Rate |
— |
— |
||
+50 Basis Points |
(9.35 |
)% |
(0.24 |
)% |
+100 Basis Points |
(21.10 |
)% |
(0.90 |
)% |
(1) Change in annual economic net interest income. Includes interest expense on interest rate swaps.
(2) Projected Percentage Change in Portfolio Value is based on instantaneous moves in interest rates.
Prepayment Risk
As we receive prepayments of principal on these investments, premiums and discounts on such investments will be amortized or accreted into interest income. In general, an increase in prepayment rates will accelerate the amortization of purchase premiums, thereby reducing the interest income earned on the investments. Conversely, discounts on such investments are accelerated and accreted into interest income increasing interest income.
Extension Risk
Management computes the projected weighted-average life of our investments based on assumptions regarding the rate at which the borrowers will prepay the underlying mortgages. In general, when fixed-rate or hybrid adjustable-rate residential mortgage loans or RMBS are acquired via borrowings, we may, but are not required to, enter into an interest rate swap agreement or other hedging instrument that attempts to fix our borrowing costs for a period close to the anticipated average life
60
of the fixed-rate portion of the related assets. This strategy is designed to protect us from rising interest rates as the borrowing costs are managed to maintain a net interest spread for the duration of the fixed-rate portion of the related assets. However, if prepayment rates decrease in a rising interest rate environment, the life of the fixed-rate portion of the related assets could extend beyond the term of the swap agreement or other hedging instrument. This could have a negative impact on our results from operations, as borrowing costs would no longer be fixed after the end of the hedging instrument while the income earned on the fixed and hybrid adjustable-rate assets would remain fixed. In extreme situations, we may be forced to sell assets to maintain adequate liquidity, which could cause us to incur losses.
61
Basis Risk
We seek to limit our interest rate risk by hedging portions of our portfolio through interest rate swaps and other types of hedging instruments. Interest rate swaps are generally tied to underlying Treasury benchmark interest rates. Basis risk relates to the risk of the spread between our RMBS and underlying hedges widening. Such a widening may cause a decline in the fair value of our RMBS that is greater than the increase in fair value of our hedges resulting in a net decline in book value. The widening of mortgage-backed securities yields and Treasury benchmark interest rates may result from a variety of factors such as anticipated or actual monetary policy actions or other market factors.
Market Risk
Market Value Risk
Certain of our available-for-sale securities are reflected at their estimated fair value with unrealized gains and losses excluded from earnings and reported in other comprehensive income if no OTTI has been recognized in earnings. The estimated fair value of these securities fluctuates primarily due to changes in interest rates, prepayment speeds, market liquidity, credit quality, and other factors. Generally, in a rising interest rate environment, the estimated fair value of these securities would be expected to decrease; conversely, in a decreasing interest rate environment, the estimated fair value of these securities would be expected to increase. As market volatility increases or liquidity decreases, the fair value of our investments may be adversely impacted.
Real Estate Market Risk
We own assets secured by real property and may own real property directly in the future. Residential property values are subject to volatility and may be affected adversely by a number of factors, including, but not limited to, national, regional and local economic conditions and unemployment (which may be adversely affected by industry slowdowns and other factors); local real estate conditions (such as an oversupply of housing); changes or continued weakness in specific industry segments; construction quality, age and design; demographic factors; natural disasters and other acts of God; and retroactive changes to building or similar codes. In addition, decreases in property values reduce the value of the collateral and the potential proceeds available to a borrower to repay our loans, which could also cause us to incur losses.
Risk Management
Subject to maintaining our REIT status, we seek to manage risk exposure to protect our portfolio of residential mortgage loans, RMBS, and other assets and related debt against the effects of major interest rate changes. We generally seek to manage risk by:
• |
monitoring and adjusting, if necessary, the reset index and interest rate related to our RMBS and our financings; |
• |
attempting to structure our financing agreements to have a range of different maturities, terms, amortizations and interest rate adjustment periods; |
• |
using derivatives, financial futures, swaps, options, caps, floors and forward sales to adjust the interest rate sensitivity of our investments and our borrowings; |
• |
using securitization financing to lower average cost of funds relative to short-term financing vehicles further allowing us to receive the benefit of attractive terms for an extended period of time in contrast to short term financing and maturity dates of the investments not included in the securitization; and |
• |
actively managing, through assets selection, on an aggregate basis, the interest rate indices, interest rate adjustment periods, and gross reset margins of our investments and the interest rate indices and adjustment periods of our financings. |
Our efforts to manage our assets and liabilities are concerned with the timing and magnitude of the re-pricing of assets and liabilities. We attempt to control risks associated with interest rate movements. Methods for evaluating interest rate risk include an analysis of our interest rate sensitivity “gap,” which is the difference between interest-earning assets and interest-bearing liabilities maturing or re-pricing within a given time period. A gap is considered positive when the amount of interest-rate sensitive assets exceeds the amount of interest-rate sensitive liabilities. A gap is considered negative when the amount of interest-rate sensitive liabilities exceeds interest-rate sensitive assets. During a period of rising interest rates, a negative gap would tend to adversely affect net interest income, while a positive gap would tend to result in an increase in net interest income. During a period of falling interest rates, a negative gap would tend to result in an increase in net interest income, while a positive gap would tend to affect net interest income adversely. Because different types of assets and liabilities with the same or similar maturities may react differently to changes in overall market rates or conditions, changes in interest rates may affect net interest income positively or negatively even if an institution were perfectly matched in each maturity category.
62
The following table sets forth the estimated maturity or re-pricing of our interest-earning assets and interest-bearing liabilities at December 31, 2018. The amounts of assets and liabilities shown within a particular period were determined in accordance with the contractual terms of the assets and liabilities, except adjustable-rate residential mortgage loans, and securities are included in the period in which their interest rates are first scheduled to adjust and not in the period in which they mature and includes the effect of the interest rate swaps. The interest rate sensitivity of our assets and liabilities in the table could vary substantially based on actual prepayments.
December 31, 2018 | |||||||||||||||
(dollars in thousands) | |||||||||||||||
Within 3 Months |
3-12 Months |
1 Year to 3 Years |
Greater than
3 Years
|
Total |
|||||||||||
Rate sensitive assets |
$ |
237,187 |
$ |
960,792 |
$ |
— |
$ |
26,067,180 |
$ |
27,265,159 |
|||||
Cash equivalents |
47,486 |
— |
— |
— |
47,486 |
||||||||||
Total rate sensitive assets |
$ |
284,673 |
$ |
960,792 |
$ |
— |
$ |
26,067,180 |
$ |
27,312,645 |
|||||
Rate sensitive liabilities |
16,599,654 |
5,886,188 |
— |
— |
22,485,842 |
||||||||||
Interest rate sensitivity gap |
$ |
(16,314,981 |
) |
$ |
(4,925,396 |
) |
$ |
— |
$ |
26,067,180 |
$ |
4,826,803 |
|||
Cumulative rate sensitivity gap |
$ |
(16,314,981 |
) |
$ |
(21,240,377 |
) |
$ |
(21,240,377 |
) |
$ |
4,826,803 |
||||
Cumulative interest rate sensitivity gap as a percentage of total rate sensitive assets |
(60 |
)% |
(78 |
)% |
(78 |
)% |
18 |
% |
|||||||
Our analysis of risks is based on our management’s experience, estimates, models and assumptions. These analyses rely on models which utilize estimates of fair value and interest rate sensitivity. Actual economic conditions or implementation of investment decisions by our management may produce results that differ significantly from the estimates and assumptions used in our models and the projected results shown in the above tables and in this Form 10-K. These analyses contain certain forward-looking statements and are subject to the safe harbor statement set forth under the heading, “Special Note Regarding Forward-Looking Statements.”
Item 8. Financial Statements and Supplementary Data
Our consolidated financial statements and the related notes, together with the Reports of Independent Registered Public Accounting Firm thereon, are set forth beginning on page 69 of this 2018 Form 10-K.
Item 9. Changes in and Disagreements with Accountants on Accounting and Financial Disclosure
None.
Item 9A. Controls and Procedures
a) Evaluation of Disclosure Controls and Procedures
Disclosure controls and procedures (as defined in Rules 13a-15(e) and 15d-15(e) of the Securities Exchange Act of 1934, as amended, or the Exchange Act) are designed to ensure that information required to be disclosed in reports filed or submitted under the Exchange Act is recorded, processed, summarized and reported within the time periods specified in SEC rules and forms and that such information is accumulated and communicated to management, including the Chief Executive Officer and Chief Financial Officer, to allow timely decisions regarding required disclosures.
Our management, including our Chief Executive Officer and Chief Financial Officer, reviewed and evaluated the effectiveness of the design and operation of our disclosure controls and procedures covering the preparation and review of this 2018 annual report. Based on such evaluation, our Chief Executive Officer and Chief Financial Officer have concluded that, as of the end of such period, our disclosure controls and procedures were effective.
(b) Management’s Report on Internal Control Over Financial Reporting
63
Management of the Company is responsible for establishing and maintaining adequate internal control over financial reporting. Internal control over financial reporting is defined in Rule 13a-15(f) and 15d-15(f) under the Exchange Act, as a process designed by, or under the supervision of, our principal executive and principal financial officers and effected by our board of directors, management and other personnel to provide reasonable assurance regarding the reliability of financial reporting and the preparation of financial statements for external purposes in accordance with accounting principles generally accepted in the United States and includes those policies and procedures that:
• |
pertain to the maintenance of records that in reasonable detail accurately and fairly reflect the transactions and dispositions of our assets; |
• |
provide reasonable assurance that transactions are recorded as necessary to permit preparation of financial statements in accordance with accounting principles generally accepted in the United States, and that receipts and expenditures of the Company are being made only in accordance with authorizations of our management and directors; and |
• |
provide reasonable assurance regarding prevention or timely detection of unauthorized acquisition, use or disposition of our assets that could have a material effect on the financial statements. |
Because of its inherent limitations, internal control over financial reporting may not prevent or detect all misstatements. Projections of any evaluation of effectiveness to future periods are subject to the risks that controls may become inadequate because of changes in conditions or that the degree of compliance with the policies or procedures may deteriorate.
Management assessed the effectiveness of our internal control over financial reporting as of December 31, 2018. In making this assessment, management used the criteria set forth by the Committee of Sponsoring Organizations of the Treadway Commission (COSO) in the 2013 Internal Control-Integrated Framework.
Based on this assessment, management concluded that, as of December 31, 2018, our internal control over financial reporting was effective.
The effectiveness of our internal control over financial reporting as of December 31, 2018 has been audited by Ernst & Young LLP, an independent registered public accounting firm, as stated in their report which is included in page 70 under Item 8. "Financial Statements and Supplementary Data."
(c) Changes in Internal Control over Financial Reporting
There was no change in our internal control over financial reporting that occurred during the quarter and year ended December 31, 2018 that has materially affected, or is reasonably likely to materially affect, our internal control over financial reporting.
Item 9B. Other Information
None.
Part III.
Item 10. Directors, Executive Officers and Corporate Governance
We expect to file with the SEC, in April 2019 (and, in any event, not later than 120 days after the close of our last fiscal year), a definitive proxy statement, or the Proxy Statement, pursuant to SEC Regulation 14A in connection with our Annual Meeting of Stockholders to be held on or about May 30, 2019. The information to be included in the Proxy Statement regarding the Company’s directors, executive officers, and certain other matters required by Item 401 of Regulation S-K is incorporated herein by reference.
The information to be included in the Proxy Statement regarding compliance with Section 16(a) of the 1934 Act required by Item 405 of Regulation S-K is incorporated herein by reference.
The information to be included in the Proxy Statement regarding the Company’s Code of Business Conduct and Ethics required by Item 406 of Regulation S-K is incorporated herein by reference.
The information to be included in the Proxy Statement regarding certain matters pertaining to the Company’s corporate governance required by Item 407(c)(3), (d)(4) and (d)(5) of Regulation S-K is incorporated by reference.
64
Item 11. Executive Compensation
The information to be included in the Proxy Statement regarding executive compensation and other compensation related matters required by Items 402 and 407(e)(4) and (e)(5) of Regulation S-K is incorporated herein by reference.
Item 12. Security Ownership of Certain Beneficial Owners and Management and Related Stockholder Matters
Table to be included in the Proxy Statement, which will contain information relating to beneficial ownership of the Company's capital stock required by 201(d) and 403 of Regulation S-K, is incorporated herein by reference.
Item 13. Certain Relationships and Related Transactions and Director Independence
The information to be included in the Proxy Statement regarding transactions with related persons, promoters and certain control persons and director independence required by Items 404 and 407(a) of Regulation S-K is incorporated herein by reference.
Item 14. Principal Accountant Fees and Services
The information to be included in the Proxy Statement concerning principal accounting fees and services and the Audit Committee’s pre-approval policies and procedures required by Item 14 is incorporated herein by reference.
Item 15. Exhibits
EXHIBIT INDEX | |
|
Exhibit
Number
|
Description |
2.1 |
|
2.2 |
|
3.1 |
|
3.2 |
|
3.3 |
|
3.4 |
|
3.5 |
|
3.6 |
|
3.7 |
|
3.8 |
|
65
3.9 |
|
3.10 |
|
3.11 |
|
4.1 |
|
4.2 |
|
4.3 |
|
4.4 |
|
4.5 |
|
10.1† |
|
10.2† |
|
10.3† |
|
10.4† |
|
10.5† |
|
10.6† |
|
10.7† |
|
10.8† |
|
10.9† |
|
10.10† |
|
10.11† |
|
10.12† |
|
10.13† |
|
66
10.14† |
|
10.15† |
|
10.16† |
|
10.17† |
|
10.18† |
|
10.19† |
|
10.20† |
|
10.21 |
|
10.22 |
|
10.23 |
|
10.24 |
|
10.25 |
|
10.26 |
|
21.1 |
|
23.1 |
|
4.4 |
|
31.1 |
|
31.2 |
|
32.1 |
|
32.2 |
|
101.INS* |
XBRL Instance Document |
101.SCH* |
XBRL Taxonomy Extension Schema Document |
101.CAL* |
XBRL Taxonomy Extension Calculation Linkbase Document |
101.LAB* |
XBRL Taxonomy Extension Labels Linkbase Document |
67
101.PRE* |
XBRL Taxonomy Extension Presentation Linkbase Document |
101.DEF* |
XBRL Taxonomy Extension Definition Linkbase Document |
† |
Represents a management contract or compensatory plan or arrangement |
* |
This exhibit is being furnished rather than filed, and shall not be deemed incorporated by reference into any filing, in accordance with Item 601 of Regulation S-K |
68
CHIMERA INVESTMENT CORPORATION
FINANCIAL STATEMENTS
Reports of Independent Registered Public Accounting Firm |
|
Consolidated Financial Statements |
|
Consolidated Statements of Financial Condition as of December 31, 2018 and 2017 |
|
Consolidated Statements of Operations for the years ended December 31, 2018, 2017 and 2016 |
|
Consolidated Statements of Comprehensive Income for the years ended December 31, 2018, 2017 and 2016 |
|
Consolidated Statements of Changes in Stockholders' Equity for the years ended December 31, 2018, 2017 and 2016 |
|
Consolidated Statements of Cash Flows for the years ended December 31, 2018, 2017 and 2016 |
|
Notes to Consolidated Financial Statements |
|
69
REPORT OF INDEPENDENT REGISTERED PUBLIC ACCOUNTING FIRM
To the Stockholders and the Board of Directors of Chimera Investment Corporation
Opinion on the Financial Statements
We have audited the accompanying consolidated statements of financial condition of Chimera Investment Corporation (the Company) as of December 31, 2018 and 2017, the related consolidated statements of operations, comprehensive income, changes in stockholders' equity and cash flows for each of the three years in the period ended December 31, 2018, and the related notes (collectively referred to as the “consolidated financial statements”). In our opinion, the consolidated financial statements present fairly, in all material respects, the financial position of the Company at December 31, 2018 and 2017, and the results of its operations and its cash flows for each of the three years in the period ended December 31, 2018, in conformity with U.S. generally accepted accounting principles.
We also have audited, in accordance with the standards of the Public Company Accounting Oversight Board (United States) (PCAOB), the Company's internal control over financial reporting as of December 31, 2018, based on criteria established in Internal Control-Integrated Framework issued by the Committee of Sponsoring Organizations of the Treadway Commission (2013 framework), and our report dated February 21, 2019 expressed an unqualified opinion thereon.
Basis for Opinion
These financial statements are the responsibility of the Company's management. Our responsibility is to express an opinion on the Company’s financial statements based on our audits. We are a public accounting firm registered with the PCAOB and are required to be independent with respect to the Company in accordance with the U.S. federal securities laws and the applicable rules and regulations of the Securities and Exchange Commission and the PCAOB.
We conducted our audits in accordance with the standards of the PCAOB. Those standards require that we plan and perform the audit to obtain reasonable assurance about whether the financial statements are free of material misstatement, whether due to error or fraud. Our audits included performing procedures to assess the risks of material misstatement of the financial statements, whether due to error or fraud, and performing procedures that respond to those risks. Such procedures included examining, on a test basis, evidence regarding the amounts and disclosures in the financial statements. Our audits also included evaluating the accounting principles used and significant estimates made by management, as well as evaluating the overall presentation of the financial statements. We believe that our audits provide a reasonable basis for our opinion.
/s/ Ernst & Young LLP
We have served as the Company’s auditor since 2012.
New York, New York
February 21, 2019
70
REPORT OF INDEPENDENT REGISTERED PUBLIC ACCOUNTING FIRM
To the Stockholders and the Board of Directors of Chimera Investment Corporation
Opinion on Internal Control over Financial Reporting
We have audited Chimera Investment Corporation’s internal control over financial reporting as of December 31, 2018, based on criteria established in Internal Control-Integrated Framework issued by the Committee of Sponsoring Organizations of the Treadway Commission (2013 framework) (the COSO criteria). In our opinion, Chimera Investment Corporation (the Company) maintained, in all material respects, effective internal control over financial reporting as of December 31, 2018, based on the COSO criteria.
We also have audited, in accordance with the standards of the Public Company Accounting Oversight Board (United States) (PCAOB), the consolidated statements of financial condition of the Company as of December 31, 2018 and 2017, the related consolidated statements of operations, comprehensive income, changes in stockholders' equity and cash flows for each of the three years in the period ended December 31, 2018, and the related notes and our report dated February 21, 2019 expressed an unqualified opinion thereon.
Basis for Opinion
The Company’s management is responsible for maintaining effective internal control over financial reporting and for its assessment of the effectiveness of internal control over financial reporting included in the accompanying Management’s Report on Internal Control Over Financial Reporting. Our responsibility is to express an opinion on the Company’s internal control over financial reporting based on our audit. We are a public accounting firm registered with the PCAOB and are required to be independent with respect to the Company in accordance with the U.S. federal securities laws and the applicable rules and regulations of the Securities and Exchange Commission and the PCAOB.
We conducted our audit in accordance with the standards of the PCAOB. Those standards require that we plan and perform the audit to obtain reasonable assurance about whether effective internal control over financial reporting was maintained in all material respects.
Our audit included obtaining an understanding of internal control over financial reporting, assessing the risk that a material weakness exists, testing and evaluating the design and operating effectiveness of internal control based on the assessed risk, and performing such other procedures as we considered necessary in the circumstances. We believe that our audit provides a reasonable basis for our opinion.
Definition and Limitations of Internal Control Over Financial Reporting
A company’s internal control over financial reporting is a process designed to provide reasonable assurance regarding the reliability of financial reporting and the preparation of financial statements for external purposes in accordance with generally accepted accounting principles. A company’s internal control over financial reporting includes those policies and procedures that (1) pertain to the maintenance of records that, in reasonable detail, accurately and fairly reflect the transactions and dispositions of the assets of the company; (2) provide reasonable assurance that transactions are recorded as necessary to permit preparation of financial statements in accordance with generally accepted accounting principles, and that receipts and expenditures of the company are being made only in accordance with authorizations of management and directors of the company; and (3) provide reasonable assurance regarding prevention or timely detection of unauthorized acquisition, use, or disposition of the company’s assets that could have a material effect on the financial statements.
71
Because of its inherent limitations, internal control over financial reporting may not prevent or detect misstatements. Also, projections of any evaluation of effectiveness to future periods are subject to the risk that controls may become inadequate because of changes in conditions, or that the degree of compliance with the policies or procedures may deteriorate.
/s/ Ernst & Young LLP
New York, New York
February 21, 2019
72
CHIMERA INVESTMENT CORPORATION | ||||||
CONSOLIDATED STATEMENTS OF FINANCIAL CONDITION | ||||||
(dollars in thousands, except share and per share data) | ||||||
December 31, 2018 |
December 31, 2017 |
|||||
Cash and cash equivalents |
$ |
47,486 |
$ |
63,569 |
||
Non-Agency RMBS, at fair value |
2,486,130 |
2,851,316 |
||||
Agency MBS, at fair value |
12,188,950 |
4,364,828 |
||||
Loans held for investment, at fair value |
12,572,581 |
13,678,263 |
||||
Accrued interest receivable |
123,442 |
100,789 |
||||
Other assets |
252,582 |
114,391 |
||||
Derivatives, at fair value, net |
37,468 |
48,914 |
||||
Total assets (1)
|
$ |
27,708,639 |
$ |
21,222,070 |
||
Liabilities: |
||||||
Repurchase agreements ($15.8 billion and $8.8 billion, pledged as collateral, respectively) |
$ |
14,030,465 |
$ |
7,250,452 |
||
Securitized debt, collateralized by Non-Agency RMBS ($1.0 billion and $1.6 billion pledged as collateral, respectively) |
159,955 |
205,780 |
||||
Securitized debt at fair value, collateralized by loans held for investment ($12.3 billion and $13.3 billion pledged as collateral, respectively) |
8,455,376 |
9,388,657 |
||||
Payable for investments purchased |
1,136,157 |
567,440 |
||||
Accrued interest payable |
110,402 |
61,888 |
||||
Dividends payable |
95,986 |
95,365 |
||||
Accounts payable and other liabilities |
16,469 |
17,191 |
||||
Derivatives, at fair value, net |
— |
320 |
||||
Total liabilities (1)
|
$ |
24,004,810 |
$ |
17,587,093 |
||
Commitments and Contingencies (See Note 15) |
||||||
Stockholders' Equity: |
||||||
Preferred Stock, par value of $0.01 per share, 100,000,000 shares authorized: |
||||||
8.00% Series A cumulative redeemable: 5,800,000 shares issued and outstanding, respectively ($145,000 liquidation preference) |
$ |
58 |
$ |
58 |
||
8.00% Series B cumulative redeemable: 13,000,000 shares issued and outstanding, respectively ($325,000 liquidation preference) |
130 |
130 |
||||
7.75% Series C cumulative redeemable: 10,400,000 and 0 shares issued and outstanding, respectively ($260,000 liquidation preference) |
104 |
— |
||||
Common stock: par value $0.01 per share; 300,000,000 shares authorized, 187,052,398 and 187,809,288 shares issued and outstanding, respectively |
1,871 |
1,878 |
||||
Additional paid-in-capital |
4,072,093 |
3,826,691 |
||||
Accumulated other comprehensive income |
626,832 |
796,902 |
||||
Cumulative earnings |
3,379,489 |
2,967,852 |
||||
Cumulative distributions to stockholders |
(4,376,748 |
) |
(3,958,534 |
) |
||
Total stockholders' equity |
$ |
3,703,829 |
$ |
3,634,977 |
||
Total liabilities and stockholders' equity |
$ |
27,708,639 |
$ |
21,222,070 |
||
(1) The Company's consolidated statements of financial condition include assets of consolidated variable interest entities (“VIEs”) that can only be used to settle obligations and liabilities of the VIE for which creditors do not have recourse to the primary beneficiary (Chimera Investment Corporation). As of December 31, 2018 and December 31, 2017, total assets of consolidated VIEs were $13,392,951 and $14,987,464, respectively, and total liabilities of consolidated VIEs were $8,652,158 and $9,631,820, respectively. See Note 8 for further discussion.
See accompanying notes to consolidated financial statements.
73
CHIMERA INVESTMENT CORPORATION | |||||||||
CONSOLIDATED STATEMENTS OF OPERATIONS | |||||||||
(dollars in thousands, except share and per share data) | |||||||||
For the Year Ended |
|||||||||
December 31, 2018 |
December 31, 2017 |
December 31, 2016 |
|||||||
Net interest income: |
|||||||||
Interest income (1)
|
$ |
1,273,316 |
$ |
1,138,758 |
$ |
934,068 |
|||
Interest expense (2)
|
679,108 |
532,748 |
347,857 |
||||||
Net interest income |
594,208 |
606,010 |
586,211 |
||||||
Other-than-temporary impairments: |
|||||||||
Total other-than-temporary impairment losses |
(2,556 |
) |
(5,169 |
) |
(9,589 |
) |
|||
Portion of loss recognized in other comprehensive income |
(19,235 |
) |
(56,687 |
) |
(48,398 |
) |
|||
Net other-than-temporary credit impairment losses |
(21,791 |
) |
(61,856 |
) |
(57,987 |
) |
|||
Other investment gains (losses): |
|||||||||
Net unrealized gains (losses) on derivatives |
(141,162 |
) |
47,976 |
50,093 |
|||||
Realized gains (losses) on terminations of interest rate swaps |
— |
(16,143 |
) |
(60,616 |
) |
||||
Net realized gains (losses) on derivatives |
18,369 |
(25,645 |
) |
(44,886 |
) |
||||
Net gains (losses) on derivatives |
(122,793 |
) |
6,188 |
(55,409 |
) |
||||
Net unrealized gains (losses) on financial instruments at fair value |
46,632 |
111,410 |
59,552 |
||||||
Net realized gains (losses) on sales of investments |
(2,743 |
) |
9,123 |
18,155 |
|||||
Gains (losses) on extinguishment of debt |
26,376 |
(35,274 |
) |
(477 |
) |
||||
Total other gains (losses) |
(52,528 |
) |
91,447 |
21,821 |
|||||
Other income: |
|||||||||
Other income |
— |
— |
95,000 |
||||||
Total other income |
— |
— |
95,000 |
||||||
Other expenses: |
|||||||||
Compensation and benefits |
35,114 |
30,212 |
26,901 |
||||||
General and administrative expenses |
23,936 |
17,650 |
17,516 |
||||||
Servicing fees |
40,773 |
41,690 |
31,178 |
||||||
Deal expenses |
8,338 |
21,273 |
17,424 |
||||||
Total other expenses |
108,161 |
110,825 |
93,019 |
||||||
Income (loss) before income taxes |
411,728 |
524,776 |
552,026 |
||||||
Income taxes |
91 |
108 |
83 |
||||||
Net income (loss) |
$ |
411,637 |
$ |
524,668 |
$ |
551,943 |
|||
Dividends on preferred stock |
43,197 |
33,484 |
2,449 |
||||||
Net income (loss) available to common shareholders |
$ |
368,440 |
$ |
491,184 |
$ |
549,494 |
|||
Net income (loss) per share available to common shareholders: |
|||||||||
Basic |
$ |
1.97 |
$ |
2.62 |
$ |
2.93 |
|||
Diluted |
$ |
1.96 |
$ |
2.61 |
$ |
2.92 |
|||
Weighted average number of common shares outstanding: |
|||||||||
Basic |
187,146,170 |
187,780,355 |
187,728,634 |
||||||
Diluted |
187,748,862 |
188,287,320 |
188,024,838 |
||||||
(1) Includes interest income of consolidated VIEs of $904,830, $914,022 and $678,623 for the years ended December 31, 2018, 2017 and 2016 respectively. See Note 8 to consolidated financial statements for further discussion.
(2) Includes interest expense of consolidated VIEs of $395,255, $390,858 and $249,708 for the years ended December 31, 2018, 2017 and 2016, respectively . See Note 8 to consolidated financial statements for further discussion.
See accompanying notes to consolidated financial statements.
74
CHIMERA INVESTMENT CORPORATION | |||||||||
CONSOLIDATED STATEMENTS OF COMPREHENSIVE INCOME (LOSS) | |||||||||
(dollars in thousands, except share and per share data) | |||||||||
For the Year Ended |
|||||||||
December 31, 2018 |
December 31, 2017 |
December 31, 2016 |
|||||||
Comprehensive income (loss): |
|||||||||
Net income (loss) |
$ |
411,637 |
$ |
524,668 |
$ |
551,943 |
|||
Other comprehensive income: |
|||||||||
Unrealized gains (losses) on available-for-sale securities, net |
(185,570 |
) |
24,218 |
(88,527 |
) |
||||
Reclassification adjustment for net losses included in net income for other-than-temporary credit impairment losses |
21,791 |
61,856 |
57,987 |
||||||
Reclassification adjustment for net realized losses (gains) included in net income |
(6,291 |
) |
(7,278 |
) |
(25,145 |
) |
|||
Other comprehensive income (loss) |
(170,070 |
) |
78,796 |
(55,685 |
) |
||||
Comprehensive income (loss) before preferred stock dividends |
$ |
241,567 |
$ |
603,464 |
$ |
496,258 |
|||
Dividends on preferred stock |
$ |
43,197 |
$ |
33,484 |
$ |
2,449 |
|||
Comprehensive income (loss) available to common stock shareholders |
$ |
198,370 |
$ |
569,980 |
$ |
493,809 |
|||
75
CHIMERA INVESTMENT CORPORATION | |||||||||||||||||||||||||||
CONSOLIDATED STATEMENTS OF CHANGES IN STOCKHOLDERS' EQUITY | |||||||||||||||||||||||||||
(dollars in thousands, except per share data) | |||||||||||||||||||||||||||
Series A Preferred Stock Par Value |
Series B Preferred Stock Par Value |
Series C Preferred Stock Par Value |
Common Stock Par Value |
Additional Paid-in Capital |
Accumulated Other Comprehensive Income |
Cumulative Earnings |
Cumulative Distributions to Stockholders |
Total |
|||||||||||||||||||
Balance, December 31, 2015 |
$ |
— |
$ |
— |
$ |
— |
$ |
1,877 |
$ |
3,366,566 |
$ |
773,791 |
$ |
1,891,241 |
$ |
(3,087,287 |
) |
$ |
2,946,188 |
||||||||
Net income (loss) |
— |
— |
— |
— |
— |
— |
551,943 |
— |
551,943 |
||||||||||||||||||
Other comprehensive income (loss) |
— |
— |
— |
— |
— |
(55,685 |
) |
— |
— |
(55,685 |
) |
||||||||||||||||
Stock based compensation |
— |
— |
— |
— |
2,206 |
— |
— |
— |
2,206 |
||||||||||||||||||
Common dividends declared |
— |
— |
— |
— |
— |
— |
— |
(458,735 |
) |
(458,735 |
) |
||||||||||||||||
Preferred dividends declared |
— |
— |
— |
— |
— |
— |
— |
(2,449 |
) |
(2,449 |
) |
||||||||||||||||
Issuance of preferred stock |
58 |
— |
— |
— |
140,007 |
— |
— |
— |
140,065 |
||||||||||||||||||
Balance, December 31, 2016 |
$ |
58 |
$ |
— |
$ |
— |
$ |
1,877 |
$ |
3,508,779 |
$ |
718,106 |
$ |
2,443,184 |
$ |
(3,548,471 |
) |
$ |
3,123,533 |
||||||||
Balance, December 31, 2016 |
$ |
58 |
$ |
— |
$ |
— |
$ |
1,877 |
$ |
3,508,779 |
$ |
718,106 |
$ |
2,443,184 |
$ |
(3,548,471 |
) |
$ |
3,123,533 |
||||||||
Net income (loss) |
— |
— |
— |
— |
— |
— |
524,668 |
— |
524,668 |
||||||||||||||||||
Other comprehensive income (loss) |
— |
— |
— |
— |
— |
78,796 |
— |
— |
78,796 |
||||||||||||||||||
Stock based compensation |
— |
— |
— |
1 |
3,613 |
— |
— |
— |
3,614 |
||||||||||||||||||
Common dividends declared |
— |
— |
— |
— |
— |
— |
— |
(376,579 |
) |
(376,579 |
) |
||||||||||||||||
Preferred dividends declared |
— |
— |
— |
— |
— |
— |
— |
(33,484 |
) |
(33,484 |
) |
||||||||||||||||
Issuance of preferred stock |
— |
130 |
— |
— |
314,299 |
— |
— |
— |
314,429 |
||||||||||||||||||
Balance, December 31, 2017 |
$ |
58 |
$ |
130 |
$ |
— |
$ |
1,878 |
$ |
3,826,691 |
$ |
796,902 |
$ |
2,967,852 |
$ |
(3,958,534 |
) |
$ |
3,634,977 |
||||||||
Balance, December 31, 2017 |
$ |
58 |
$ |
130 |
$ |
— |
$ |
1,878 |
$ |
3,826,691 |
$ |
796,902 |
$ |
2,967,852 |
$ |
(3,958,534 |
) |
$ |
3,634,977 |
||||||||
Net income (loss) |
— |
— |
— |
— |
— |
— |
411,637 |
— |
411,637 |
||||||||||||||||||
Other comprehensive income (loss) |
— |
— |
— |
— |
— |
(170,070 |
) |
— |
— |
(170,070 |
) |
||||||||||||||||
Repurchase of common stock |
— |
— |
— |
(8 |
) |
(14,826 |
) |
— |
— |
— |
(14,834 |
) |
|||||||||||||||
Stock based compensation |
— |
— |
— |
1 |
8,796 |
— |
— |
— |
8,797 |
||||||||||||||||||
Common dividends declared |
— |
— |
— |
— |
— |
— |
— |
(375,017 |
) |
(375,017 |
) |
||||||||||||||||
Preferred dividends declared |
— |
— |
— |
— |
— |
— |
— |
(43,197 |
) |
(43,197 |
) |
||||||||||||||||
Issuance of preferred stock |
— |
— |
104 |
— |
251,432 |
— |
— |
— |
251,536 |
||||||||||||||||||
Balance, December 31, 2018 |
$ |
58 |
$ |
130 |
$ |
104 |
$ |
1,871 |
$ |
4,072,093 |
$ |
626,832 |
$ |
3,379,489 |
$ |
(4,376,748 |
) |
$ |
3,703,829 |
||||||||
See accompanying notes to consolidated financial statements.
76
CHIMERA INVESTMENT CORPORATION | |||||||||
CONSOLIDATED STATEMENTS OF CASH FLOWS | |||||||||
(dollars in thousands) | |||||||||
(Unaudited) | |||||||||
For the Year Ended |
|||||||||
December 31, 2018 |
December 31, 2017 |
December 31, 2016 |
|||||||
Cash Flows From Operating Activities: |
|||||||||
Net income |
$ |
411,637 |
$ |
524,668 |
$ |
551,943 |
|||
Adjustments to reconcile net income to net cash provided by (used in) operating activities: |
|||||||||
(Accretion) amortization of investment discounts/premiums, net |
28,633 |
(25,422 |
) |
(3,127 |
) |
||||
Accretion (amortization) of deferred financing costs and securitized debt discounts/premiums, net |
(13,124 |
) |
7,395 |
1,543 |
|||||
Amortization of swaption premium |
1,476 |
6,269 |
6,559 |
||||||
Net unrealized losses (gains) on derivatives |
141,162 |
(47,976 |
) |
(50,093 |
) |
||||
Margin (paid) received on derivatives |
(320,899 |
) |
31,442 |
56,050 |
|||||
Net unrealized losses (gains) on financial instruments at fair value |
(46,632 |
) |
(111,410 |
) |
(59,552 |
) |
|||
Net realized losses (gains) on sales of investments |
2,743 |
(9,123 |
) |
(18,155 |
) |
||||
Net other-than-temporary credit impairment losses |
21,791 |
61,856 |
57,987 |
||||||
(Gain) loss on extinguishment of debt |
(26,376 |
) |
35,274 |
477 |
|||||
Equity-based compensation expense |
8,797 |
3,614 |
2,204 |
||||||
Changes in operating assets: |
|||||||||
Decrease (increase) in accrued interest receivable, net |
(22,652 |
) |
(21,091 |
) |
(13,450 |
) |
|||
Decrease (increase) in other assets |
63,235 |
18,080 |
3,994 |
||||||
Changes in operating liabilities: |
|||||||||
Increase (decrease) in accounts payable and other liabilities |
(722 |
) |
498 |
5,290 |
|||||
Increase (decrease) in accrued interest payable, net |
48,515 |
13,217 |
11,237 |
||||||
Net cash provided by (used in) operating activities |
$ |
297,584 |
$ |
487,291 |
$ |
552,907 |
|||
Cash Flows From Investing Activities: |
|||||||||
Agency MBS portfolio: |
|||||||||
Purchases |
$ |
(7,917,661 |
) |
$ |
(1,326,178 |
) |
$ |
(1,040,290 |
) |
Sales |
16,184 |
743,937 |
2,570,025 |
||||||
Principal payments |
524,989 |
423,506 |
649,961 |
||||||
Non-Agency RMBS portfolio: |
|||||||||
Purchases |
(133,247 |
) |
(15,262 |
) |
(203,400 |
) |
|||
Sales |
19,928 |
5,045 |
95,399 |
||||||
Principal payments |
521,109 |
568,339 |
532,701 |
||||||
Loans held for investment: |
|||||||||
Purchases |
(1,671,330 |
) |
(6,120,543 |
) |
(4,897,370 |
) |
|||
Sales |
754,806 |
— |
— |
||||||
Principal payments |
1,859,155 |
1,788,408 |
1,022,414 |
||||||
Acquisition of investments in consolidated VIEs |
— |
(398,261 |
) |
— |
|||||
Net cash provided by (used in) investing activities |
$ |
(6,026,067 |
) |
$ |
(4,331,009 |
) |
$ |
(1,270,560 |
) |
Cash Flows From Financing Activities: |
|||||||||
Proceeds from repurchase agreements |
$ |
71,279,975 |
$ |
44,120,574 |
$ |
34,202,707 |
|||
Payments on repurchase agreements |
(64,499,287 |
) |
(42,471,025 |
) |
(36,041,143 |
) |
|||
Net proceeds from preferred stock offerings |
251,536 |
314,429 |
140,065 |
||||||
Payments on repurchase of common stock |
(14,834 |
) |
— |
— |
|||||
Proceeds from securitized debt borrowings, collateralized by loans held for investment |
1,769,539 |
5,152,469 |
4,797,255 |
||||||
Payments on securitized debt borrowings, collateralized by loans held for investment |
(2,613,038 |
) |
(2,844,132 |
) |
(1,668,670 |
) |
|||
Payments on securitized debt borrowings, collateralized by Non-Agency RMBS |
(43,898 |
) |
(131,039 |
) |
(194,634 |
) |
|||
77
Common dividends paid |
(374,396 |
) |
(375,771 |
) |
(454,275 |
) |
|||
Preferred dividends paid |
(43,197 |
) |
(35,932 |
) |
— |
||||
Net cash provided by (used in) financing activities |
$ |
5,712,400 |
$ |
3,729,573 |
$ |
781,305 |
|||
Net increase (decrease) in cash and cash equivalents |
(16,083 |
) |
(114,145 |
) |
63,652 |
||||
Cash and cash equivalents at beginning of period |
63,569 |
177,714 |
114,062 |
||||||
Cash and cash equivalents at end of period |
$ |
47,486 |
$ |
63,569 |
$ |
177,714 |
|||
Supplemental disclosure of cash flow information: |
|||||||||
Interest received |
$ |
1,279,297 |
$ |
1,092,245 |
$ |
917,491 |
|||
Interest paid |
$ |
643,717 |
$ |
512,133 |
$ |
335,077 |
|||
Non-cash investing activities: |
|||||||||
Payable for investments purchased |
$ |
1,136,157 |
$ |
567,440 |
$ |
520,532 |
|||
Net change in unrealized gain (loss) on available-for sale securities |
$ |
(170,070 |
) |
$ |
78,796 |
$ |
(55,685 |
) |
|
Retained beneficial interests |
$ |
39,844 |
$ |
— |
$ |
— |
|||
Acquisition of securities in Consolidated VIEs |
|||||||||
Securitized loans held for investment, at fair value |
$ |
— |
$ |
419,222 |
$ |
— |
|||
Securitized debt at fair value |
$ |
— |
$ |
(20,961 |
) |
$ |
— |
||
Non-cash financing activities: |
|||||||||
Dividends declared, not yet paid |
$ |
95,986 |
$ |
95,365 |
$ |
94,557 |
|||
Preferred dividends accrued |
$ |
— |
$ |
— |
$ |
2,449 |
|||
See accompanying notes to consolidated financial statements.
78
|
CHIMERA INVESTMENT CORPORATION
NOTES TO CONSOLIDATED FINANCIAL STATEMENTS
| ||||
1. Organization
Chimera Investment Corporation, or the Company, was organized in Maryland on June 1, 2007. The Company commenced operations on November 21, 2007 when it completed its initial public offering. The Company elected to be taxed as a real estate investment trust, or REIT, under the Internal Revenue Code of 1986, as amended, and regulations promulgated thereunder, or the Code.
The Company conducts its operations through various subsidiaries including subsidiaries it treats as taxable REIT subsidiaries, or TRSs. In general, a TRS may hold assets and engage in activities that the Company cannot hold or engage in directly and generally may engage in any real estate or non-real estate related business. The Company currently has nine wholly owned direct subsidiaries: Chimera RMBS Whole Pool LLC, and Chimera RMBS LLC formed in June 2009; CIM Trading Company LLC, or CIM Trading, formed in July 2010; Chimera Funding TRS LLC, or CIM Funding TRS, a TRS formed in October 2013, Chimera CMBS Whole Pool LLC and Chimera RMBS Securities LLC formed in March 2015; Chimera Insurance Company, LLC formed in July 2015; Chimera RR Holding LLC formed in April 2016, and Anacostia LLC, a TRS formed in June 2018.
2. Summary of the Significant Accounting Policies
(a) Basis of Presentation and Consolidation
The accompanying consolidated financial statements and related notes of the Company have been prepared in accordance with accounting principles generally accepted in the United States, or GAAP. In the opinion of management, all adjustments considered necessary for a fair presentation of the Company's financial position, results of operations and cash flows have been included. Certain prior period amounts have been reclassified to conform to the current period's presentation.
The consolidated financial statements include, the Company’s accounts, the accounts of its wholly-owned subsidiaries, and variable interest entities, or VIEs, in which the Company is the primary beneficiary. All intercompany balances and transactions have been eliminated in consolidation.
The Company uses securitization trusts considered to be VIEs in its securitization and re-securitization transactions. VIEs are defined as entities in which equity investors (i) do not have the characteristics of a controlling financial interest, or (ii) do not have sufficient equity at risk for the entity to finance its activities without additional subordinated financial support from other parties. The entity that consolidates a VIE is known as its primary beneficiary, and is generally the entity with (i) the power to direct the activities that most significantly impact the VIEs’ economic performance, and (ii) the right to receive benefits from the VIE or the obligation to absorb losses of the VIE that could be significant to the VIE. For VIEs that do not have substantial on-going activities, the power to direct the activities that most significantly impact the VIEs’ economic performance may be determined by an entity’s involvement with the design and structure of the VIE.
The trusts are structured as entities that receive principal and interest on the underlying collateral and distribute those payments to the security holders. The assets held by the securitization entities are restricted in that they can only be used to fulfill the obligations of the securitization entity. The Company’s risks associated with its involvement with these VIEs are limited to its risks and rights as a holder of the security it has retained.
Determining the primary beneficiary of a VIE requires judgment. The Company determined that for the securitizations it consolidates, its ownership provides the Company with the obligation to absorb losses or the right to receive benefits from the VIE that could be significant to the VIE. In addition, the Company has the power to direct the activities of the VIEs that most significantly impact the VIEs’ economic performance, or power, such as rights to direct servicer activity or the Company was determined to have power in connection with its involvement with the structure and design of the VIE.
The Company’s interest in the assets held by these securitization vehicles, which are consolidated on the Company’s Consolidated Statements of Financial Condition, is restricted by the structural provisions of these trusts, and a recovery of the Company’s investment in the vehicles will be limited by each entity’s distribution provisions. The liabilities of the securitization vehicles, which are also consolidated on the Company’s Consolidated Statements of Financial Condition, are non-recourse to the Company, and can only be satisfied from each securitization vehicle’s respective asset pool.
79
The assets of securitization entities are comprised of residential mortgage backed securities (or RMBS), or residential mortgage loans. See Notes 3, 4 and 8 for further discussion of the characteristics of the securities and loans in the Company’s portfolio.
(b) Statements of Financial Condition Presentation
The Company’s Consolidated Statements of Financial Condition include both the Company’s direct assets and liabilities and the assets and liabilities of consolidated securitization vehicles. Assets of each consolidated VIE can only be used to satisfy the obligations of that VIE, and the liabilities of consolidated VIEs are non-recourse to the Company. The Company is not obligated to provide, nor does it intend to provide, any financial support to these consolidated securitization vehicles. The notes to the consolidated financial statements describe the Company’s assets and liabilities including the assets and liabilities of consolidated securitization vehicles. See Note 8 for additional information related to the Company’s investments in consolidated securitization vehicles.
(c) Cash and Cash Equivalents
Cash and cash equivalents include cash on hand and cash deposited overnight in money market funds, which are not bank deposits and are not insured or guaranteed by the Federal Deposit Insurance Corporation. There were no restrictions on cash and cash equivalents at December 31, 2018 and December 31, 2017.
(d) Agency and Non-Agency Mortgage-Backed Securities
The Company invests in mortgage backed securities, or MBS, representing interests in obligations backed by pools of mortgage loans. The Company delineates between Agency MBS and Non-Agency MBS as follows: (1) Agency MBS are mortgage pass-through certificates, collateralized mortgage obligations, or CMOs, and other MBS representing interests in or obligations backed by pools of mortgage loans issued or guaranteed by agencies of the U.S. Government, such as Ginnie Mae, or federally chartered corporations such as Freddie Mac or Fannie Mae where principal and interest repayments are guaranteed by the respective agency of the U.S. Government or federally chartered corporation; and (2) Non-Agency MBS are not issued or guaranteed by a U.S. Government Agency or other institution and are subject to credit risk. Repayment of principal and interest on Non-Agency MBS is not guaranteed and it is subject to the performance of the mortgage loans or MBS collateralizing the obligation.
The Company also invests in Interest Only Agency MBS strips and Interest Only Non-Agency RMBS strips, or IO MBS strips. IO MBS strips represent the Company’s right to receive a specified proportion of the contractual interest flows of the collateral. Interest income on IO MBS strips is accrued based on the outstanding notional balance and the security’s contractual terms, and amortization of any premium is calculated in accordance with the Financial Accounting Standards Board, or FASB, Accounting Standards Codification, or ASC, 325-40, Beneficial Interests in Securitized Financial Assets, or ASC 325-40. The Company accounts for IO MBS strips at fair value with changes in fair value recognized in the Company’s Consolidated Statements of Operations.
The Company classifies its MBS as available-for-sale and records investments at estimated fair value as described in Note 5 of these consolidated financial statements. The Company includes unrealized gains and losses considered to be temporary on certain MBS in Other comprehensive income, or OCI, in the Consolidated Statements of Operations. For IO MBS strips and certain other MBS investments, the Company carries these investments at fair value with changes in fair value included in earnings in the Consolidated Statements of Operations. From time to time, as part of the overall management of its portfolio, the Company may sell any of its investments and recognize a realized gain or loss as a component of earnings in the Consolidated Statements of Operations utilizing the average cost method.
The Company’s accounting policy for interest income and impairment related to its MBS is as follows:
Interest Income Recognition
The recognition of interest income on MBS securities varies depending on the characteristics of the security as follows:
Agency MBS and Non-Agency RMBS of High Credit Quality
FASB ASC 310-20, Nonrefundable Fees and Other Costs, or ASC 310-20, is applied to the recognition of interest income for the following securities:
• |
Certain Agency MBS |
80
• |
Non-Agency RMBS that meet all of the following conditions at the acquisition date (referred to hereafter as “Non-Agency RMBS of High Credit Quality”): |
1. Rated AA or higher by a nationally recognized credit rating agency using the lowest rating available;
2. The Company expects to collect all of the security's contractual cash flows; and
3. The security cannot be contractually prepaid such that the Company would not recover substantially all of its recorded investment.
Under ASC 310-20, interest income, including premiums and discounts associated with the acquisition of these securities, is recognized over the life of such securities using the interest method based on the contractual cash flows of the security. In applying the interest method, the Company considers estimates of future principal prepayments in the calculation of the effective yield. Differences that arise between previously anticipated prepayments and actual prepayments received, as well as changes in future prepayment assumptions, result in a recalculation of the effective yield on the security. This recalculation of the effective yield is updated on a quarterly basis. Upon a recalculation of the effective yield, the investment in the security is adjusted to the amount that would have existed had the new effective yield been retrospectively applied since acquisition with a corresponding charge or credit to interest income.
The Agency MBS, for which we have elected fair value option, we apply FASB ASC 325-40. For these securities accounted for under ASC 325-40, any positive or adverse change in cash flows results in a prospective increase or decrease in the effective interest rate used to recognize interest income.
Non-Agency RMBS Not of High Credit Quality
Non-Agency RMBS purchased at a discount and not of high credit quality at the time of purchase are accounted for under ASC 310-30, Loans and Debt Securities Acquired with Deteriorated Credit Quality, or ASC 310-30, or ASC 325-40 (referred to hereafter as “Non-Agency RMBS Not of High Credit Quality”).
Non-Agency RMBS are accounted for under ASC 310-30 if the following conditions are met as of the acquisition date:
1. |
There is evidence of deterioration in credit quality of the security from its inception; and |
2. |
It is probable that the Company will be unable to collect all contractual cash flows of the security. |
Non-Agency RMBS that are not within the scope of ASC 310-30 are accounted for under ASC 325-40 if at the acquisition date:
1. |
The security is not of high credit quality (defined as rated below AA or is unrated), or |
2. |
The security can contractually be prepaid or otherwise settled in such a way that the Company would not recover substantially all of its recorded investment. |
Interest income on Non-Agency RMBS Not of High Credit Quality is recognized using the interest method based on management’s estimates of cash flows expected to be collected. The effective interest rate on these securities is based on management’s estimate for each security of the projected cash flows, which are estimated based on observation of current market information and include assumptions related to fluctuations in prepayment speeds and the timing and amount of credit losses. On a quarterly basis, the Company reviews and, if appropriate, makes adjustments to its cash flow projections based on inputs and analyses received from external sources, internal models, and the Company’s judgments about prepayment rates, the timing and amount of credit losses, and other factors. Changes in the amount or timing of cash flows from those originally projected, or from those estimated at the last evaluation date, are considered to be either positive changes or adverse changes. For securities accounted for under ASC 325-40, any positive or adverse change in cash flows that does not result in the recognition of an other-than-temporary impairment, or OTTI, results in a prospective increase or decrease in the effective interest rate used to recognize interest income. For securities accounted for under ASC 310-30, only significant positive changes are reflected prospectively in the effective interest rate used to recognize interest income. Under ASC 310-30, adverse changes in cash flows expected to be collected for Non-Agency RMBS, in an unrealized loss position, generally result in recognition of an OTTI with no change in the effective interest rate used to recognize interest income.
Impairment
Considerations Applicable to certain MBS
When the fair value of an available-for-sale MBS is less than its amortized cost, the security is considered impaired. On a quarterly basis, the Company evaluates its securities for OTTI. If the Company intends to sell an impaired security, or it is
81
more-likely-than-not that the Company will be required to sell an impaired security before its anticipated recovery, then the Company must recognize an OTTI through a charge to earnings equal to the entire difference between the investment’s amortized cost and its fair value at the measurement date. If the Company does not intend to sell an impaired security and it is not more-likely-than-not that it would be required to sell an impaired security before recovery, the Company must further evaluate the security for impairment due to credit losses. The credit component of OTTI is recognized in earnings and the remaining component is recorded as a component of OCI. Following the recognition of an OTTI through earnings, a new amortized cost basis is established for the security and subsequent recovery in fair value may not be adjusted through current earnings. Subsequent recoveries are amortized into income over the remaining life of the security as an adjustment to yield.
When evaluating whether the Company intends to sell an impaired security or will more-likely-than-not be required to sell an impaired security before recovery, the Company makes judgments that consider among other things, its liquidity, leverage, contractual obligations, and targeted investment strategy to determine its intent and ability to hold the investments that are deemed impaired. The determination as to whether an OTTI exists is based on factual information available at the time of assessment as well as the Company’s estimates of future conditions. As a result, the determination of OTTI and its timing and amount is based on estimates that may change materially over time.
The Company’s estimate of the amount and timing of cash flows for its MBS is based on its review of the underlying securities or mortgage loans securing the MBS. The Company considers historical information available and expected future performance of the underlying securities or mortgage loans, including timing of expected future cash flows, prepayment rates, default rates, loss severities, delinquency rates, percentage of non-performing loans, extent of credit support available, Fair Isaac Corporation, or FICO, scores at loan origination, year of origination, loan-to-value ratios, geographic concentrations, as well as reports by credit rating agencies, current and forecast interest rates, general market assessments and dialogue with market participants. As a result, substantial judgment is used in the Company’s analysis to determine the expected cash flows for its MBS.
Considerations Applicable to Non-Agency RMBS of High Credit Quality
The impairment assessment for Non-Agency RMBS of High Credit Quality involves comparing the present value of the remaining cash flows expected to be collected to the amortized cost of the security at the assessment date. The discount rate used to calculate the present value of the expected future cash flows is based on the security’s effective interest rate as calculated under ASC 310-20 (i.e., the discount rate implicit in the security as of the last measurement date). If the present value of the remaining cash flows expected to be collected is less than the amortized cost basis, an OTTI is recognized in earnings for the difference. This amount is considered to be the credit loss component; the remaining difference between amortized cost and the fair value of the security is considered to be the portion of loss recognized in other comprehensive income.
Considerations Applicable to Non-Agency RMBS Not of High Credit Quality
Non-Agency RMBS within the scope of ASC 325-40 or ASC 310-30 are considered other-than-temporarily impaired when the following two conditions exist: (1) the fair value is less than the amortized cost basis, and (2) there has been an adverse change in cash flows expected to be collected from the last measurement date (i.e. adverse changes in either the amount or timing of cash flows from those previously expected).
The OTTI is separated into a credit loss component that is recognized in earnings and the portion of loss recognized in other comprehensive income. The credit component is comprised of the impact of the fair value decline due to changes in assumptions related to default (collection) risk and prepayments. The portion of loss recognized in other comprehensive income comprises the change in fair value of the security due to all other factors, including changes in benchmark interest rates and market liquidity. In determining the OTTI related to credit losses for securities, the Company compares the present value of the remaining cash flows adjusted for prepayments expected to be collected at the current financial reporting date to the present value of the remaining cash flows expected to be collected at the original purchase date (or the last date those estimates were revised for accounting purposes). The discount rate used to calculate the present value of expected future cash flows is the effective interest rate used for income recognition purposes as determined under ASC 325-40 or ASC 310-30.
The determination of whether an OTTI exists and, if so, the extent of the credit component is subject to significant judgment and management’s estimates of both historical information available at the time of assessment, the current market environment, as well as the Company’s estimates of the future performance and projected amount and timing of cash flows expected to be collected on the security. As a result, the timing and amount of OTTI constitutes an accounting estimate that may change materially over time.
82
Investments for which the Company has elected the fair value option are not evaluated for OTTI as all changes in fair value are reflected in earnings.
(e) Loans Held for Investment
The Company's loans held for investment portfolio is comprised of seasoned residential mortgage loans that are not guaranteed as to repayment of principal or interest. These loans are serviced and may be modified by a third-party servicer. Additionally, in certain cases, the Company has the ability to remove the servicer with or without cause upon prior notice. These residential mortgage loans are designated as held for investment. Interest income on loans held for investment is recognized over the expected life of the loans using the interest method with changes in yield reflected in earnings on a prospective basis and are carried at fair value with changes in fair value recorded in earnings.
The Company estimates the fair value of securitized loans as described in Note 5 of these consolidated financial statements.
Interest is accrued on all loans held for investment when due. Interest which is not received at the due date is written off when it becomes delinquent. Nonrefundable fees and costs related to acquiring the Company’s residential mortgage loans are recognized as expenses in the Consolidated Statements of Operations. Income recognition is suspended for loans when, based on information from the servicer, a full recovery of interest or principal becomes doubtful.
Real estate owned
Real estate owned, or REO, represents properties which the Company has received the legal title of the property to satisfy the outstanding loan. REO is re-categorized from loan to REO when the Company takes legal title of the property. REO assets are measured and reported at the estimated fair value less the estimated cost to sell at the end of each reporting period. At the time the asset is re-categorized, any difference between the previously recorded loan balance and the carrying value of the REO at the time the Company takes legal title of the property, is recognized as a gain or loss. All REO assets of the Company are held-for-sale and it is the Company’s intention to sell the property in the shortest time possible to maximize their return and recovery on the previously recorded loan. The carrying value of REO assets at December 31, 2018 and 2017 was $17 million and $10 million, respectively, and were recorded in Other Assets on the Company’s Consolidated Statements of Financial Condition.
(f) Repurchase Agreements
The Company finances the acquisition of a significant portion of its mortgage-backed securities with repurchase agreements. The Company has evaluated each agreement and has determined that each of the repurchase agreements be accounted for as secured borrowings, which is recourse to the Company.
(g) Securitized Debt, collateralized by Non-Agency RMBS and Securitized Debt, collateralized by Loans held for investment
Certain re-securitization transactions classified as Securitized Debt, collateralized by Non-Agency RMBS, reflect the transfer to a trust of fixed or adjustable rate MBS which are classified as Non-Agency RMBS that pay interest and principal to the debt holders of that re-securitization. Re-securitization transactions completed by the Company that did not qualify as sales are accounted for as secured borrowings. The associated securitized debt is carried at amortized cost, net of any unamortized premiums or discounts.
Certain transactions involving residential mortgage loans are accounted for as secured borrowings, and are recorded as Securitized loans held for investment and the corresponding debt as Securitized debt, collateralized by loans held for investment in the Consolidated Statements of Financial Condition. These securitizations are collateralized by residential adjustable or fixed rate mortgage loans that have been placed in a trust and pay interest and principal to the debt holders of that securitization. The Securitized debt, collateralized by loans held for investment, is carried at fair value.
The Company recognizes interest expense on securitized debt over the contractual life of the debt using the interest method with changes in yield reflected in earnings on a retrospective basis. For securitized debt, where the Company has elected fair value option, the interest expense is recognized using the interest method with changes in yield reflected in earnings on a prospective basis.
The Company estimates the fair value of its securitized debt as described in Note 5 to these consolidated financial statements.
(h) Fair Value
83
Agency MBS:
The Company has elected to account for Agency MBS investments acquired on or after July 1, 2017 under the fair value option. Under the fair value option, these investments will be carried at fair value, with changes in fair value reported in earnings (included as part of “Net unrealized gains (losses) on financial instruments at fair value”). Consistent with all other investments for which the Company has elected the fair value option, the Company will recognize revenue on a prospective basis in accordance with guidance in ASC 325-40.
All Agency MBS investments owned prior to July 1, 2017 will continue to be carried at fair value with changes in fair value reported in other comprehensive income (OCI) as available-for-sale investments. All revenue recognition for these Agency MBS investments owned prior to July 1, 2017 will be in accordance with ASC 310-20, per the Company’s accounting practices.
Non-Agency RMBS - Overcollateralization Class:
The Company has elected the fair value option for certain interests in Non-Agency RMBS which it refers to as the overcollateralization classes. The cash flows for these holdings are generally subordinate to all other interests of the trusts and generally only pay out funds when certain ratios are met and excess cash holdings, as determined by the trustee, are available for distribution to the overcollateralization class. Many of the investments in this group have no current cash flows and may not ever pay cash flows, depending on the loss experience of the collateral group supporting the investment. Estimating future cash flows for this group of Non-Agency RMBS investments is highly subjective and uncertain; therefore, the Company records these holdings at fair value with changes in fair value reflected in earnings.
Changes in fair value of the overcollateralization classes are presented in Net unrealized gains (losses) on financial instruments at fair value on the Consolidated Statements of Operations. The fair value of the Non-Agency RMBS carried at fair value with changes in fair value reflected in earnings was $12 million and $14 million as of December 31, 2018 and 2017, respectively.
Interest-Only MBS:
The Company accounts for the IO MBS strips at fair value with changes in fair value reported in earnings. The IO MBS strips are included in MBS, at fair value, on the accompanying Consolidated Statements of Financial Condition.
Included in Non-Agency RMBS, at fair value on the Consolidated Statements of Financial Condition are IO MBS strips carried at fair value with changes in fair value reflected in earnings of $267 million and $219 million as of December 31, 2018 and 2017. Included in Agency MBS, at fair value on the Consolidated Statements of Financial Condition are IO MBS strips carried at fair value with changes in fair value reflected in earnings of $133 million and $104 million as of December 31, 2018 and 2017. Interest income reported on all IO MBS securities was $25 million and $31 million for the years ended December 31, 2018 and 2017, respectively.
Loans Held for Investment:
The Company’s Loans held for investment are carried at fair value with changes in fair value reflected in earnings. The Company carries Loans held for investment at fair value as it may resecuritize these loans in the future. Additionally, the fair value option allows both the loans and related financing to be consistently reported at fair value and to achieve operational and valuation simplifications.
Changes in fair value of Loans held for investment are presented in Net unrealized gains (losses) on financial instruments at fair value on the Consolidated Statements of Operations.
Securitized Debt, Collateralized by Loans Held for Investment:
The Company’s securitized debt, collateralized by loans held for investment, is carried at fair value with changes in fair value reflected in earnings. The Company has elected the fair value option for these financings as it may call or restructure these debt financings in the future. Additionally, the fair value option allows both the loans and related financing to be consistently reported at fair value and to achieve operational and valuation simplifications. Changes in fair value of securitized debt, collateralized by loans held for investment are presented in Net unrealized gains (losses) on financial instruments at fair value on the Consolidated Statements of Operations.
Fair Value Disclosure
84
A complete discussion of the methodology utilized by the Company to estimate the fair value of its financial instruments is included in Note 5 to these consolidated financial statements.
(i) Derivative Financial Instruments
The Company’s investment policies permit it to enter into derivative contracts, including interest rate swaps, swaptions, mortgage options, futures, and interest rate caps to manage its interest rate risk and, from time to time, enhance investment returns. The Company’s derivatives are recorded as either assets or liabilities in the Consolidated Statements of Financial Condition and measured at fair value. These derivative financial instrument contracts are not designated as hedges for GAAP; therefore, all changes in fair value are recognized in earnings. The Company estimates the fair value of its derivative instruments as described in Note 5 of these consolidated financial statements. Net payments on derivative instruments are included in the Consolidated Statements of Cash Flows as a component of net income. Unrealized gains (losses) on derivatives are removed from net income to arrive at cash flows from operating activities.
The Company elects to net the fair value of its derivative contracts by counterparty when appropriate. These contracts contain legally enforceable provisions that allow for netting or setting off of all individual derivative receivables and payables with each counterparty and therefore, the fair value of those derivative contracts are reported net by counterparty. The credit support annex provisions of the Company’s derivative contracts allow the parties to mitigate their credit risk by requiring the party which is in a net payable position to post collateral. As the Company elects to net by counterparty the fair value of derivative contracts, it also nets by counterparty any cash collateral exchanged as part of the derivative. Refer to Note 9 Derivative Instruments for further details.
(j) Sales, Securitizations, and Re-Securitizations
The Company periodically enters into transactions in which it sells financial assets, such as MBS and mortgage loans. Gains and losses on sales of assets are calculated using the average cost method whereby the Company records a gain or loss on the difference between the average amortized cost of the asset and the proceeds from the sale. In addition, the Company from time to time securitizes or re-securitizes assets and sells tranches in the newly securitized assets. These transactions may be recorded as either sales, whereby the assets contributed to the securitization are removed from the Consolidated Statements of Financial Condition and a gain or loss is recognized, or as secured borrowings whereby the assets contributed to the securitization are not derecognized but rather the debt issued by the securitization entity are recorded to reflect the term financing of the assets. In these securitizations and re-securitizations, the Company may retain senior or subordinated interests in the securitized or re-securitized assets. In transfers that are considered secured borrowings, no gain or loss is recognized. Any difference in the proceeds received and the carrying value of the transferred asset is recorded as a premium or discount and amortized into earnings as an adjustment to yield.
(k) Income Taxes
The Company has elected to be taxed as a REIT and intends to comply with the provision of the Code, with respect thereto. Accordingly, the Company will generally not be subject to U.S. federal, state or local income taxes to the extent that qualifying distributions are made to stockholders and as long as certain asset, income, distribution and stock ownership tests are met. If the Company failed to qualify as a REIT and did not qualify for certain statutory relief provisions, the Company would be subject to U.S. federal, state and local income taxes and may be precluded from qualifying as a REIT for the subsequent four taxable years following the year in which the REIT qualification was lost. The Company has made joint elections with CIM Funding TRS and Anacostia LLC to treat CIM Funding TRS and Anacostia LLC as TRSs. A TRS is taxable as a domestic C corporation and subject to U.S. federal, state, and local income taxes based upon its taxable income.
A tax position is recognized only when, based on management’s judgment regarding the application of income tax laws, it is more likely than not that the tax position will be sustained upon examination. The Company does not have any unrecognized tax positions that would affect its financial statements or require disclosure. No accruals for penalties and interest were necessary as of December 31, 2018 or 2017.
(l) Net Income per Share
The Company calculates basic net income per share by dividing net income for the period by the basic weighted-average shares of its common stock outstanding for that period. Diluted net income per share takes into account the effect of dilutive instruments such as unvested restricted stock.
85
(m) Stock-Based Compensation
Compensation expense for equity based awards granted to the Company’s independent directors and stock based compensation awards granted to employees of the Company subject only to service condition is recognized on a straight-line basis over the vesting period of such awards, based upon the fair value of such awards at the grant date. The Company recognizes forfeitures when they occur and does not adjust the fair value of the grants for estimated forfeitures. For awards subject to vesting on a straight line basis, the total amount of expense is at least equal to the measured expense of each vested tranche. Awards subject to only a service condition are valued according to the market price for the Company’s common stock at the date of grant. For awards based on the performance of the Company, it generally engages an independent appraisal company to determine the value of the shares at the date of grant, taking into account the underlying contingency risks associated with the performance criteria. The values of these grants are expensed ratably over their respective vesting periods (irrespective of achievement of the performance criteria) adjusted, as applicable, for forfeitures.
(n) Use of Estimates
The preparation of financial statements in conformity with GAAP requires management to make estimates and assumptions that affect the reported amounts of assets and liabilities and disclosure of contingent assets and liabilities at the date of the financial statements and the reported amounts of revenues and expenses during the reporting period. Although the Company’s estimates contemplate current conditions and how it expects them to change in the future, it is reasonably possible that actual conditions could be materially different than anticipated in those estimates, which could have a material adverse impact on the Company’s results of operations and its financial condition. Management has made significant estimates including in accounting for income recognition and OTTI on Agency and Non-Agency RMBS and IO MBS (Note 3), valuation of Agency MBS and Non-Agency RMBS (Notes 3 and 5), residential mortgage loans (Note 4 and 5), securitized debt (Note 5 and 7) and derivative instruments (Notes 5 and 9). Actual results could differ materially from those estimates.
(o) Recent Accounting Pronouncements
Derivatives and Hedging (Topic 815):
Inclusion of the Secured Overnight Financing Rate (SOFR) Overnight Index Swap (OIS) Rate as a Benchmark Interest Rate for Hedge Accounting Purposes (ASU No. 2018-16)
In October 2018, the FASB issued ASU No. 2018-16, Derivatives and Hedging - Inclusion of the Secured Overnight Financing Rate (SOFR) Overnight Index Swap (OIS) Rate as a Benchmark Interest Rate for Hedge Accounting Purposes. The amendments in this update permit the OIS rate based on SOFR as a U.S. benchmark interest rate. Including the OIS rate based on SOFR as an eligible benchmark interest rate during the early stages of the marketplace transition will facilitate the LIBOR to SOFR transition and provide sufficient lead time for entities to prepare for changes to interest rate risk hedging strategies for both risk management and hedge accounting purposes. For entities that have not already adopted update 2017-12, the amendments in this update are required to be adopted concurrently with the amendments in update 2017-12, which is effective for the Company as of January 1, 2019. The amendments should be adopted on a prospective basis for qualifying new or redesignated hedging relationships entered into on or after the date of adoption. The Company has not early adopted the ASU 2017-12, therefore, this ASU is effective for the Company as of January 1, 2019. The Company currently does not have any derivative instruments linked to SOFR and the Company currently does not apply hedge accounting for GAAP reporting purposes. The adoption of this guidance is not expected to have any material impact on the Company's consolidated financial statements.
Targeted improvements to Accounting for Hedging Activities (ASU No. 2017-12)
In August 2017, the FASB issued ASU No. 2017-12, Derivatives and Hedging - Targeted improvements to Accounting for Hedging Activities. This update is issued with the objective of improving the financial reporting of hedging relationships to better portray the economic results of an entity’s risk management activities in its financial statements. In addition, the amendments in this update make certain targeted improvements to simplify the application of the hedge accounting guidance in current GAAP. The guidance in the ASU is effective for the Company as of January 1, 2019. The Company currently does not apply hedge accounting for GAAP reporting purposes, therefore, the adoption of this guidance is not expected to have any material impact on the Company's consolidated financial statements.
Fair Value Measurement - Changes to the Disclosure Requirements for Fair Value Measurement (Topic 820)
86
In August 2018, the FASB issued ASU No. 2018-13, Fair Value Measurement - Changes to the Disclosure Requirements for Fair Value Measurement. The amendments in this update modify the disclosure requirements on fair value measurements in Topic 820, Fair Value Measurement. It eliminates disclosure requirements for transfers between Level 1 and Level 2 of the fair value hierarchy and policies related to valuation processes and the timing of transfers between levels of the fair value hierarchy. It adds the following disclosure requirements, but it exempts nonpublic entities from these requirements: i) The changes in unrealized gains and losses for the period included in other comprehensive income for recurring Level 3 fair value measurements of instruments held at the end of the reporting period and ii) For recurring and nonrecurring Level 3 fair value measurements, the range and weighted averages used to develop significant unobservable inputs and how the weighted average was calculated, with certain exceptions. The guidance in the ASU is effective for the Company as of January 1, 2019. The adoption of this guidance is not expected to have any impact on the Company's consolidated financial statements except disclosure changes suggested by the guidance.
Income Statement - Reporting Comprehensive Income - (Topic 220)
In February 2018, the FASB issued ASU No. 2018-02, Income Statement - Reporting Comprehensive Income - Reclassification of Certain Tax Effects from Accumulated Other Comprehensive Income. The amendments in this update allow a reclassification from accumulated other comprehensive income to retained earnings for stranded tax effects resulting from the Tax Cuts and Jobs Act. Consequently, the amendments eliminate the stranded tax effects resulting from the Tax Cuts and Jobs Act and will improve the usefulness of information reported to financial statement users. However, because the amendments only relate to the reclassification of the income tax effects of the Tax Cuts and Jobs Act, the underlying guidance that requires that the effect of a change in tax laws or rates be included in income from continuing operations is not affected. The amendments in this Update also require certain disclosures about stranded tax effects. The guidance in the ASU is effective for the Company as of January 1, 2019. As of December 31, 2018, the Company does not have any material stranded tax effects from the Tax Cuts and Jobs Act. The adoption of this guidance is not expected to have any material impact on the Company's consolidated financial statements.
Financial Instruments - Credit Losses - (Topic 326)
In June 2016, the FASB issued ASU No. 2016-13, Measurement of Credit Losses on Financial Instruments. This update replaces the current model for recognizing credit losses from an incurred credit loss model to a current expected credit loss (CECL) model for instruments measured at amortized cost and requires entities to record allowances for available-for-sale (AFS) debt securities for all expected (rather than incurred) credit losses of the asset rather than reduce the carrying amount, as the Company does under the current OTTI model. This update also simplifies the accounting model for purchased credit-impaired debt securities and loans. The changes in the allowances created in accordance with this update will be recorded in earnings. The update also expands the disclosure requirements regarding the Company's assumptions, models, and methods for estimating the expected credit losses. In addition, the Company will disclose the amortized cost balance for each class of financial asset by credit quality indicator, disaggregated by the year of origination. The guidance in the ASU is effective for the Company as of January 1, 2020. Early adoption is allowed, beginning January 1, 2019. The standard requires entities to record a cumulative-effect adjustment to the statement of financial position as of the beginning of the first reporting period in which the guidance is effective. The Company is not planning to early adopt and is currently evaluating what impact this update will have on the consolidated financial statements.
3. Mortgage-Backed Securities
The Company classifies its Non-Agency RMBS as senior, senior IO, subordinated, or subordinated IO. The Company also invests in Agency residential, commercial and IO MBS. Senior interests in Non-Agency RMBS are considered to be entitled to the first principal repayments in their pro-rata ownership interests at the acquisition date. The tables below present amortized cost, fair value and unrealized gain/losses of Company's MBS investments as of December 31, 2018 and 2017.
87
December 31, 2018 |
||||||||||||||||||||||||
(dollars in thousands) |
||||||||||||||||||||||||
Principal or Notional Value |
Total Premium |
Total Discount |
Amortized Cost |
Fair Value |
Gross Unrealized Gains |
Gross Unrealized Losses |
Net Unrealized Gain/(Loss) |
|||||||||||||||||
Non-Agency RMBS |
||||||||||||||||||||||||
Senior |
$ |
2,386,049 |
$ |
537 |
$ |
(1,112,368 |
) |
$ |
1,274,218 |
$ |
1,943,124 |
$ |
669,356 |
$ |
(450 |
) |
$ |
668,906 |
||||||
Senior, interest-only |
5,667,198 |
286,942 |
— |
286,942 |
254,890 |
31,123 |
(63,175 |
) |
(32,052 |
) |
||||||||||||||
Subordinated |
394,037 |
8,642 |
(179,669 |
) |
223,010 |
276,467 |
53,702 |
(245 |
) |
53,457 |
||||||||||||||
Subordinated, interest-only |
221,549 |
9,932 |
— |
9,932 |
11,649 |
2,000 |
(283 |
) |
1,717 |
|||||||||||||||
Agency MBS |
||||||||||||||||||||||||
Residential |
8,984,249 |
221,606 |
— |
9,205,855 |
9,174,382 |
51,986 |
(83,459 |
) |
(31,473 |
) |
||||||||||||||
Commercial |
2,895,679 |
61,727 |
(4,469 |
) |
2,952,937 |
2,881,222 |
6,303 |
(78,018 |
) |
(71,715 |
) |
|||||||||||||
Interest-only |
3,028,572 |
136,026 |
— |
136,026 |
133,346 |
1,986 |
(4,666 |
) |
(2,680 |
) |
||||||||||||||
Total |
$ |
23,577,333 |
$ |
725,412 |
$ |
(1,296,506 |
) |
$ |
14,088,920 |
$ |
14,675,080 |
$ |
816,456 |
$ |
(230,296 |
) |
$ |
586,160 |
||||||
December 31, 2017 |
||||||||||||||||||||||||
(dollars in thousands) |
||||||||||||||||||||||||
Principal or Notional Value |
Total Premium |
Total Discount |
Amortized Cost |
Fair Value |
Gross Unrealized Gains |
Gross Unrealized Losses |
Net Unrealized Gain/(Loss) |
|||||||||||||||||
Non-Agency RMBS |
||||||||||||||||||||||||
Senior |
$ |
2,733,926 |
$ |
540 |
$ |
(1,257,103 |
) |
$ |
1,477,363 |
$ |
2,231,415 |
$ |
754,234 |
$ |
(182 |
) |
$ |
754,052 |
||||||
Senior, interest-only |
4,862,461 |
262,996 |
— |
262,996 |
210,850 |
15,761 |
(67,907 |
) |
(52,146 |
) |
||||||||||||||
Subordinated |
501,455 |
10,571 |
(177,206 |
) |
334,820 |
401,225 |
66,704 |
(299 |
) |
66,405 |
||||||||||||||
Subordinated, interest-only |
201,378 |
7,369 |
— |
7,369 |
7,826 |
902 |
(445 |
) |
457 |
|||||||||||||||
Agency MBS |
||||||||||||||||||||||||
Residential |
2,227,128 |
123,245 |
— |
2,350,373 |
2,322,180 |
5,706 |
(33,899 |
) |
(28,193 |
) |
||||||||||||||
Commercial |
1,894,594 |
47,430 |
(4,685 |
) |
1,937,339 |
1,938,281 |
17,041 |
(16,099 |
) |
942 |
||||||||||||||
Interest-only |
3,021,840 |
111,277 |
— |
111,277 |
104,367 |
834 |
(7,744 |
) |
(6,910 |
) |
||||||||||||||
Total |
$ |
15,442,782 |
$ |
563,428 |
$ |
(1,438,994 |
) |
$ |
6,481,537 |
$ |
7,216,144 |
$ |
861,182 |
$ |
(126,575 |
) |
$ |
734,607 |
||||||
The table below presents changes in accretable yield, or the excess of the security’s cash flows expected to be collected over the Company’s investment, solely as it pertains to the Company’s Non-Agency RMBS portfolio accounted for according to the provisions of ASC 310-30.
For the Year Ended |
||||||
December 31, 2018 |
December 31, 2017 |
|||||
(dollars in thousands) |
||||||
Balance at beginning of period |
$ |
1,303,589 |
$ |
1,550,110 |
||
Purchases |
43,866 |
20,962 |
||||
Yield income earned |
(231,205 |
) |
(266,214 |
) |
||
Reclassification (to) from non-accretable difference |
157,117 |
18,909 |
||||
Sales and deconsolidation |
(25,058 |
) |
(20,178 |
) |
||
Balance at end of period |
$ |
1,248,309 |
$ |
1,303,589 |
||
The table below presents the outstanding principal balance and related amortized cost at December 31, 2018 and 2017 as it pertains to the Company’s Non-Agency RMBS portfolio accounted for according to the provisions of ASC 310-30.
88
For the Year Ended |
||||||
December 31, 2018 |
December 31, 2017 |
|||||
(dollars in thousands) |
||||||
Outstanding principal balance: |
||||||
Beginning of period |
$ |
2,673,350 |
$ |
3,138,265 |
||
End of period |
$ |
2,325,154 |
$ |
2,673,350 |
||
Amortized cost: |
||||||
Beginning of period |
$ |
1,381,839 |
$ |
1,695,079 |
||
End of period |
$ |
1,158,291 |
$ |
1,381,839 |
||
The following tables present the gross unrealized losses and estimated fair value of the Company’s RMBS by length of time that such securities have been in a continuous unrealized loss position at December 31, 2018 and 2017. All securities in an unrealized loss position have been evaluated by the Company for OTTI as discussed in Note 2(d).
December 31, 2018 |
||||||||||||||||||||||||||
|
|
(dollars in thousands) |
|||||||||||||||||||||||||
Unrealized Loss Position for Less than 12 Months |
Unrealized Loss Position for 12 Months or More |
Total |
||||||||||||||||||||||||
Estimated Fair Value |
Unrealized Losses |
Number of Positions |
Estimated Fair Value |
Unrealized Losses |
Number of Positions |
Estimated Fair Value |
Unrealized Losses |
Number of Positions |
||||||||||||||||||
Non-Agency RMBS |
||||||||||||||||||||||||||
Senior |
$ |
— |
$ |
— |
— |
$ |
33,303 |
$ |
(450 |
) |
1 |
$ |
33,303 |
$ |
(450 |
) |
1 |
|||||||||
Senior, interest-only |
34,236 |
(4,276 |
) |
29 |
95,108 |
(58,899 |
) |
91 |
129,344 |
(63,175 |
) |
120 |
||||||||||||||
Subordinated |
13,404 |
(245 |
) |
7 |
— |
— |
8 |
13,404 |
(245 |
) |
15 |
|||||||||||||||
Subordinated, interest-only |
2,104 |
(158 |
) |
2 |
303 |
(125 |
) |
1 |
2,407 |
(283 |
) |
3 |
||||||||||||||
Agency MBS |
||||||||||||||||||||||||||
Residential |
779,322 |
(6,220 |
) |
17 |
1,809,566 |
(77,239 |
) |
114 |
2,588,888 |
(83,459 |
) |
131 |
||||||||||||||
Commercial |
1,697,555 |
(56,382 |
) |
548 |
504,570 |
(21,636 |
) |
183 |
2,202,125 |
(78,018 |
) |
731 |
||||||||||||||
Interest-only |
5,769 |
(48 |
) |
2 |
41,659 |
(4,618 |
) |
17 |
47,428 |
(4,666 |
) |
19 |
||||||||||||||
Total |
$ |
2,532,390 |
$ |
(67,329 |
) |
605 |
$ |
2,484,509 |
$ |
(162,967 |
) |
415 |
$ |
5,016,899 |
$ |
(230,296 |
) |
1,020 |
||||||||
December 31, 2017 |
||||||||||||||||||||||||||
(dollars in thousands) |
||||||||||||||||||||||||||
Unrealized Loss Position for Less than 12 Months |
Unrealized Loss Position for 12 Months or More |
Total |
||||||||||||||||||||||||
Estimated Fair Value |
Unrealized Losses |
Number of Positions |
Estimated Fair Value |
Unrealized Losses |
Number of Positions |
Estimated Fair Value |
Unrealized Losses |
Number of Positions |
||||||||||||||||||
Non-Agency RMBS |
||||||||||||||||||||||||||
Senior |
$ |
35,229 |
$ |
(182 |
) |
1 |
$ |
— |
$ |
— |
— |
$ |
35,229 |
$ |
(182 |
) |
1 |
|||||||||
Senior, interest-only |
28,129 |
(1,724 |
) |
27 |
120,120 |
(66,183 |
) |
120 |
148,249 |
(67,907 |
) |
147 |
||||||||||||||
Subordinated |
235 |
(38 |
) |
7 |
6,261 |
(261 |
) |
5 |
6,496 |
(299 |
) |
12 |
||||||||||||||
Subordinated, interest-only |
— |
— |
— |
945 |
(445 |
) |
3 |
945 |
(445 |
) |
3 |
|||||||||||||||
Agency MBS |
||||||||||||||||||||||||||
Residential |
660,103 |
(5,197 |
) |
21 |
1,471,464 |
(28,702 |
) |
93 |
2,131,567 |
(33,899 |
) |
114 |
||||||||||||||
Commercial |
830,889 |
(11,695 |
) |
176 |
161,980 |
(4,404 |
) |
91 |
992,869 |
(16,099 |
) |
267 |
||||||||||||||
Interest-only |
15,142 |
(641 |
) |
7 |
57,875 |
(7,103 |
) |
24 |
73,017 |
(7,744 |
) |
31 |
||||||||||||||
Total |
$ |
1,569,727 |
$ |
(19,477 |
) |
239 |
$ |
1,818,645 |
$ |
(107,098 |
) |
336 |
$ |
3,388,372 |
$ |
(126,575 |
) |
575 |
||||||||
At December 31, 2018, the Company did not intend to sell any of its RMBS that were in an unrealized loss position, and it was not more likely than not that the Company would be required to sell these RMBS before recovery of their amortized cost basis, which may be at their maturity. With respect to RMBS held by consolidated VIEs, the ability of any entity to cause the
89
sale by the VIE prior to the maturity of these RMBS is either expressly prohibited, not probable, or is limited to specified events of default, none of which have occurred as of December 31, 2018.
Gross unrealized losses on the Company’s Agency residential and commercial MBS (excluding Agency MBS which are reported at fair value with changes in fair value recorded in earnings) were $95 million and $41 million as of December 31, 2018 and 2017, respectively. Given the inherent credit quality of Agency MBS, the Company does not consider any of the current impairments on its Agency MBS to be credit related. In evaluating whether it is more likely than not that it will be required to sell any impaired security before its anticipated recovery, which may be at their maturity, the Company considers the significance of each investment, the amount of impairment, the projected future performance of such impaired securities, as well as the Company’s current and anticipated leverage capacity and liquidity position. Based on these analyses, the Company determined that at December 31, 2018 and 2017, unrealized losses on its Agency MBS were temporary.
Gross unrealized losses on the Company’s Non-Agency RMBS (excluding Non-Agency MBS which are reported at fair value with changes in fair value recorded in earnings) were $601 thousand and $283 thousand at December 31, 2018 and 2017, respectively. Based upon the most recent evaluation, the Company does not consider these unrealized losses to be indicative of OTTI and does not believe that these unrealized losses are credit related, but rather are due to other factors. The Company has reviewed its Non-Agency RMBS that are in an unrealized loss position to identify those securities with losses that are other-than-temporary based on an assessment of changes in cash flows expected to be collected for such RMBS, which considers recent bond performance and expected future performance of the underlying collateral.
A summary of the OTTI included in earnings for the years ended December 31, 2018, 2017 and 2016 are presented below.
For the Year Ended |
|||||||||
December 31, 2018 |
December 31, 2017 |
December 31, 2016 |
|||||||
(dollars in thousands) |
|||||||||
Total other-than-temporary impairment losses |
$ |
(2,556 |
) |
$ |
(5,169 |
) |
$ |
(9,589 |
) |
Portion of loss recognized in other comprehensive income (loss) |
(19,235 |
) |
(56,687 |
) |
(48,398 |
) |
|||
Net other-than-temporary credit impairment losses |
$ |
(21,791 |
) |
$ |
(61,856 |
) |
$ |
(57,987 |
) |
The following table presents a roll forward of the credit loss component of OTTI on the Company’s Non-Agency RMBS for which a portion of loss was recognized in OCI. The table delineates between those securities that are recognizing OTTI for the first time as opposed to those that have previously recognized OTTI.
For the Year Ended |
|||||||||
December 31, 2018 |
December 31, 2017 |
December 31, 2016 |
|||||||
(dollars in thousands) |
|||||||||
Cumulative credit loss beginning balance |
$ |
591,521 |
$ |
556,485 |
$ |
529,112 |
|||
Additions: |
|||||||||
Other-than-temporary impairments not previously recognized |
9,379 |
12,669 |
25,959 |
||||||
Reductions for securities sold or deconsolidated during the period |
(9,169 |
) |
(12,405 |
) |
(9,429 |
) |
|||
Increases related to other-than-temporary impairments on securities with previously recognized other-than-temporary impairments |
12,412 |
47,211 |
32,027 |
||||||
Reductions for increases in cash flows expected to be collected over the remaining life of the securities |
(16,944 |
) |
(12,439 |
) |
(21,184 |
) |
|||
Cumulative credit impairment loss ending balance |
$ |
587,199 |
$ |
591,521 |
$ |
556,485 |
|||
Cash flows generated to determine net other-than-temporary credit impairment losses recognized in earnings are estimated using significant unobservable inputs. The significant inputs used to measure the component of OTTI recognized in earnings for the Company’s Non-Agency RMBS for the periods reported are summarized as follows:
90
For the Year Ended |
||
December 31, 2018 |
December 31, 2017 |
|
Loss Severity |
||
Weighted Average |
59% |
64% |
Range |
5% - 132% |
28% - 89% |
60+ days delinquent |
||
Weighted Average |
13% |
21% |
Range |
0% - 30% |
11% - 27% |
Credit Enhancement (1)
|
||
Weighted Average |
14% |
16% |
Range |
0% - 55% |
0% - 50% |
3 Month CPR |
||
Weighted Average |
10% |
10% |
Range |
0% - 39% |
0% - 24% |
12 Month CPR |
||
Weighted Average |
11% |
11% |
Range |
1% - 28% |
1% - 19% |
(1) Calculated as the combined credit enhancement to the Re-REMIC and underlying from each of their respective capital structures.
The following tables present a summary of unrealized gains and losses at December 31, 2018 and 2017.
December 31, 2018 |
||||||||||||||||||
(dollars in thousands) |
||||||||||||||||||
Gross Unrealized Gain Included in Accumulated Other Comprehensive Income |
Gross Unrealized Gain Included in Cumulative Earnings |
Total Gross Unrealized Gain |
Gross Unrealized Loss Included in Accumulated Other Comprehensive Income |
Gross Unrealized Loss Included in Cumulative Earnings |
Total Gross Unrealized Loss |
|||||||||||||
Non-Agency RMBS |
||||||||||||||||||
Senior |
$ |
669,356 |
$ |
— |
$ |
669,356 |
$ |
(450 |
) |
$ |
— |
$ |
(450 |
) |
||||
Senior, interest-only |
— |
31,123 |
31,123 |
— |
(63,175 |
) |
(63,175 |
) |
||||||||||
Subordinated |
50,235 |
3,467 |
53,702 |
(151 |
) |
(94 |
) |
(245 |
) |
|||||||||
Subordinated, interest-only |
— |
2,000 |
2,000 |
— |
(283 |
) |
(283 |
) |
||||||||||
Agency MBS |
||||||||||||||||||
Residential |
1,708 |
50,278 |
51,986 |
(59,552 |
) |
(23,907 |
) |
(83,459 |
) |
|||||||||
Commercial |
811 |
5,492 |
6,303 |
(35,125 |
) |
(42,893 |
) |
(78,018 |
) |
|||||||||
Interest-only |
— |
1,986 |
1,986 |
— |
(4,666 |
) |
(4,666 |
) |
||||||||||
Total |
$ |
722,110 |
$ |
94,346 |
$ |
816,456 |
$ |
(95,278 |
) |
$ |
(135,018 |
) |
$ |
(230,296 |
) |
|||
December 31, 2017 |
||||||||||||||||||
(dollars in thousands) |
||||||||||||||||||
Gross Unrealized Gain Included in Accumulated Other Comprehensive Income |
Gross Unrealized Gain Included in Cumulative Earnings |
Total Gross Unrealized Gain |
Gross Unrealized Loss Included in Accumulated Other Comprehensive Income |
Gross Unrealized Loss Included in Cumulative Earnings |
Total Gross Unrealized Loss |
|||||||||||||
Non-Agency RMBS |
||||||||||||||||||
Senior |
$ |
754,234 |
$ |
— |
$ |
754,234 |
$ |
(182 |
) |
$ |
— |
$ |
(182 |
) |
||||
Senior, interest-only |
— |
15,761 |
15,761 |
— |
(67,907 |
) |
(67,907 |
) |
||||||||||
Subordinated |
62,989 |
3,715 |
66,704 |
(102 |
) |
(197 |
) |
(299 |
) |
|||||||||
Subordinated, interest-only |
— |
902 |
902 |
— |
(445 |
) |
(445 |
) |
||||||||||
Agency MBS |
||||||||||||||||||
Residential |
5,706 |
— |
5,706 |
(29,083 |
) |
(4,816 |
) |
(33,899 |
) |
|||||||||
Commercial |
15,462 |
1,579 |
17,041 |
(12,122 |
) |
(3,977 |
) |
(16,099 |
) |
|||||||||
Interest-only |
— |
834 |
834 |
— |
(7,744 |
) |
(7,744 |
) |
||||||||||
Total |
$ |
838,391 |
$ |
22,791 |
$ |
861,182 |
$ |
(41,489 |
) |
$ |
(85,086 |
) |
$ |
(126,575 |
) |
|||
91
Changes in prepayments, actual cash flows, and cash flows expected to be collected, among other items, are affected by the collateral characteristics of each asset class. The Company chooses assets for the portfolio after carefully evaluating each investment’s risk profile.
The following tables provide a summary of the Company’s MBS portfolio at December 31, 2018 and 2017.
December 31, 2018 |
|||||||||||||
Principal or Notional Value at Period-End (dollars in thousands) |
Weighted Average Amortized Cost Basis |
Weighted Average Fair Value |
Weighted Average Coupon |
Weighted Average Yield at Period-End (1)
|
|||||||||
Non-Agency RMBS |
|||||||||||||
Senior |
$ |
2,386,049 |
$ |
53.40 |
$ |
81.44 |
5.0 |
% |
19.5 |
% |
|||
Senior, interest-only |
5,667,198 |
5.06 |
4.50 |
1.2 |
% |
8.4 |
% |
||||||
Subordinated |
394,037 |
56.60 |
70.16 |
4.0 |
% |
9.9 |
% |
||||||
Subordinated, interest-only |
221,549 |
4.48 |
5.26 |
1.1 |
% |
16.4 |
% |
||||||
Agency MBS |
|||||||||||||
Residential pass-through |
8,984,249 |
102.47 |
102.12 |
4.0 |
% |
3.6 |
% |
||||||
Commercial pass-through |
2,895,679 |
101.98 |
99.50 |
3.6 |
% |
3.4 |
% |
||||||
Interest-only |
3,028,572 |
4.49 |
4.40 |
0.8 |
% |
4.3 |
% |
||||||
(1) Bond Equivalent Yield at period end.
December 31, 2017 |
|||||||||||||
Principal or Notional Value at Period-End (dollars in thousands) |
Weighted Average Amortized Cost Basis |
Weighted Average Fair Value |
Weighted Average Coupon |
Weighted Average Yield at Period-End (1)
|
|||||||||
Non-Agency RMBS |
|||||||||||||
Senior |
$ |
2,733,926 |
$ |
54.04 |
$ |
81.62 |
4.6 |
% |
16.7 |
% |
|||
Senior, interest-only |
4,862,461 |
5.41 |
4.34 |
1.3 |
% |
8.0 |
% |
||||||
Subordinated |
501,455 |
66.77 |
80.01 |
4.1 |
% |
9.6 |
% |
||||||
Subordinated, interest-only |
201,378 |
3.66 |
3.89 |
0.8 |
% |
11.8 |
% |
||||||
Agency MBS |
|||||||||||||
Residential pass-through |
2,227,128 |
105.53 |
104.27 |
3.8 |
% |
2.9 |
% |
||||||
Commercial pass-through |
1,894,594 |
102.26 |
102.31 |
3.6 |
% |
3.2 |
% |
||||||
Interest-only |
3,021,840 |
3.68 |
3.45 |
0.7 |
% |
3.4 |
% |
||||||
(1) Bond Equivalent Yield at period end.
The following table presents the weighted average credit rating of the Company’s Non-Agency RMBS portfolio at December 31, 2018 and December 31, 2017 based on fair value. We believe fair value provides an improved representation of the credit rating distribution of the Company's Non-Agency RMBS portfolio.
December 31, 2018 |
December 31, 2017 |
|||
AAA |
0.5 |
% |
— |
% |
AA |
0.1 |
% |
— |
% |
A |
0.3 |
% |
— |
% |
BBB |
0.4 |
% |
0.5 |
% |
BB |
3.6 |
% |
0.7 |
% |
B |
1.1 |
% |
0.6 |
% |
Below B or not rated |
94.0 |
% |
98.2 |
% |
Total |
100.0 |
% |
100.0 |
% |
92
Actual maturities of MBS are generally shorter than the stated contractual maturities. Actual maturities of the Company’s MBS are affected by the contractual lives of the underlying mortgages, periodic payments of principal and prepayments of principal. The following tables provide a summary of the fair value and amortized cost of the Company’s MBS at December 31, 2018 and December 31, 2017 according to their estimated weighted-average life classifications. The weighted-average lives of the MBS in the tables below are based on lifetime expected prepayment rates using an industry prepayment model for the Agency MBS portfolio and the Company’s prepayment assumptions for the Non-Agency RMBS. The prepayment model considers current yield, forward yield, steepness of the interest rate curve, current mortgage rates, mortgage rates of the outstanding loan, loan age, margin, and volatility.
December 31, 2018 |
|||||||||||||||
(dollars in thousands) |
|||||||||||||||
Weighted Average Life |
|||||||||||||||
Less than one year |
Greater than one year and less
than five years
|
Greater than five years and less
than ten years
|
Greater than ten years |
Total |
|||||||||||
Fair value |
|||||||||||||||
Non-Agency RMBS |
|||||||||||||||
Senior |
$ |
7,611 |
$ |
357,543 |
$ |
946,536 |
$ |
631,434 |
$ |
1,943,124 |
|||||
Senior interest-only |
1,189 |
38,407 |
96,401 |
118,893 |
254,890 |
||||||||||
Subordinated |
— |
39,825 |
43,744 |
192,898 |
276,467 |
||||||||||
Subordinated interest-only |
— |
303 |
9,321 |
2,025 |
11,649 |
||||||||||
Agency MBS |
|||||||||||||||
Residential |
— |
640,713 |
8,524,211 |
9,458 |
9,174,382 |
||||||||||
Commercial |
— |
15,468 |
28,205 |
2,837,549 |
2,881,222 |
||||||||||
Interest-only |
65,675 |
48,580 |
19,091 |
— |
133,346 |
||||||||||
Total fair value |
$ |
74,475 |
$ |
1,140,839 |
$ |
9,667,509 |
$ |
3,792,257 |
$ |
14,675,080 |
|||||
Amortized cost |
|||||||||||||||
Non-Agency RMBS |
|||||||||||||||
Senior |
$ |
7,522 |
$ |
277,025 |
$ |
585,187 |
$ |
404,484 |
$ |
1,274,218 |
|||||
Senior interest-only |
2,250 |
46,944 |
111,538 |
126,210 |
286,942 |
||||||||||
Subordinated |
— |
29,487 |
26,036 |
167,487 |
223,010 |
||||||||||
Subordinated interest-only |
— |
428 |
7,358 |
2,146 |
9,932 |
||||||||||
Agency MBS |
|||||||||||||||
Residential |
— |
645,368 |
8,550,766 |
9,721 |
9,205,855 |
||||||||||
Commercial |
— |
15,543 |
29,447 |
2,907,947 |
2,952,937 |
||||||||||
Interest-only |
64,185 |
53,076 |
18,765 |
— |
136,026 |
||||||||||
Total amortized cost |
$ |
73,957 |
$ |
1,067,871 |
$ |
9,329,097 |
$ |
3,617,995 |
$ |
14,088,920 |
|||||
93
December 31, 2017 |
|||||||||||||||
(dollars in thousands) |
|||||||||||||||
Weighted Average Life |
|||||||||||||||
Less than one year |
Greater than one year and less
than five years
|
Greater than five years and less
than ten years
|
Greater than ten years |
Total |
|||||||||||
Fair value |
|||||||||||||||
Non-Agency RMBS |
|||||||||||||||
Senior |
$ |
2,179 |
$ |
681,086 |
$ |
910,234 |
$ |
637,916 |
$ |
2,231,415 |
|||||
Senior interest-only |
19 |
54,107 |
72,702 |
84,022 |
210,850 |
||||||||||
Subordinated |
— |
75,495 |
121,555 |
204,175 |
401,225 |
||||||||||
Subordinated interest-only |
— |
7,165 |
661 |
— |
7,826 |
||||||||||
Agency MBS |
|||||||||||||||
Residential |
— |
21,777 |
2,300,403 |
— |
2,322,180 |
||||||||||
Commercial |
— |
45,770 |
16,559 |
1,875,952 |
1,938,281 |
||||||||||
Interest-only |
— |
74,490 |
25,271 |
4,606 |
104,367 |
||||||||||
Total fair value |
$ |
2,198 |
$ |
959,890 |
$ |
3,447,385 |
$ |
2,806,671 |
$ |
7,216,144 |
|||||
Amortized cost |
|||||||||||||||
Non-Agency RMBS |
|||||||||||||||
Senior |
$ |
2,124 |
$ |
493,965 |
$ |
569,458 |
$ |
411,816 |
$ |
1,477,363 |
|||||
Senior interest-only |
1,271 |
73,758 |
94,145 |
93,822 |
262,996 |
||||||||||
Subordinated |
— |
61,987 |
91,044 |
181,789 |
334,820 |
||||||||||
Subordinated interest-only |
— |
6,355 |
1,014 |
— |
7,369 |
||||||||||
Agency MBS |
|||||||||||||||
Residential |
— |
22,069 |
2,328,304 |
— |
2,350,373 |
||||||||||
Commercial |
— |
47,170 |
17,176 |
1,872,993 |
1,937,339 |
||||||||||
Interest-only |
— |
79,356 |
27,582 |
4,339 |
111,277 |
||||||||||
Total amortized cost |
$ |
3,395 |
$ |
784,660 |
$ |
3,128,723 |
$ |
2,564,759 |
$ |
6,481,537 |
|||||
The Non-Agency RMBS portfolio is subject to credit risk. The Non-Agency RMBS portfolio is primarily collateralized by Alt-A first lien mortgages. An Alt-A mortgage is a type of U.S. mortgage that, for various reasons, is considered riskier than A-paper, or prime, and less risky than subprime, the riskiest category. Alt-A interest rates, which are determined by credit risk, therefore tend to be between those of prime and subprime home loans. Typically, Alt-A mortgages are characterized by borrowers with less than full documentation, lower credit scores and higher loan-to-value ratios. At origination of the loan, Alt-A mortgage securities are defined as Non-Agency RMBS where (i) the underlying collateral has weighted average FICO scores between 680 and 720 or (ii) the FICO scores are greater than 720 and RMBS have 30% or less of the underlying collateral composed of full documentation loans. At December 31, 2018 and December 31, 2017, 71% and 66% of the Non-Agency RMBS collateral was classified as Alt-A, respectively. At December 31, 2018 and December 31, 2017, 12% and 13% of the Non-Agency RMBS collateral was classified as prime, respectively. The remaining Non-Agency RMBS collateral is classified as subprime.
The Non-Agency RMBS in the Portfolio have the following collateral characteristics at December 31, 2018 and December 31, 2017.
December 31, 2018 |
December 31, 2017 |
|||||||
Weighted average maturity (years) |
21.3 |
20.7 |
||||||
Weighted average amortized loan to value (1)
|
62.9 |
% |
64.4 |
% |
||||
Weighted average FICO (2)
|
708 |
697 |
||||||
Weighted average loan balance (in thousands) |
$ |
308 |
$ |
314 |
||||
Weighted average percentage owner occupied |
85.7 |
% |
84.4 |
% |
||||
Weighted average percentage single family residence |
63.8 |
% |
66.3 |
% |
||||
Weighted average current credit enhancement |
1.4 |
% |
2.2 |
% |
||||
Weighted average geographic concentration of top four states |
CA |
33.8 |
% |
CA |
31.7 |
% |
||
FL |
7.7 |
% |
NY |
8.5 |
% |
|||
NY |
7.4 |
% |
FL |
8.3 |
% |
|||
NJ |
2.1 |
% |
NJ |
2.7 |
% |
|||
(1) Value represents appraised value of the collateral at the time of loan origination.
(2) FICO as determined at the time of loan origination.
94
The table below presents the origination year of the underlying loans related to the Company’s portfolio of Non-Agency RMBS at December 31, 2018 and December 31, 2017 based on fair value. We believe fair value provides an improved representation of the origination years of the Company's Non-Agency RMBS portfolio.
Origination Year |
December 31, 2018 |
December 31, 2017 |
||
2003 and prior |
1.3 |
% |
1.6 |
% |
2004 |
1.7 |
% |
0.9 |
% |
2005 |
12.9 |
% |
12.5 |
% |
2006 |
49.8 |
% |
46.4 |
% |
2007 |
31.0 |
% |
36.5 |
% |
2008 and later |
3.3 |
% |
2.1 |
% |
Total |
100.0 |
% |
100.0 |
% |
Gross realized gains and losses are recorded in “Net realized gains (losses) on sales of investments” on the Company’s Consolidated Statements of Operations. The proceeds and gross realized gains and gross realized losses from sales of investments for the year ended December 31, 2018, 2017 and 2016 are as follows:
For the Year Ended |
|||||||||
December 31, 2018 |
December 31, 2017 |
December 31, 2016 |
|||||||
(dollars in thousands) |
|||||||||
Proceeds from sales |
$ |
116,975 |
$ |
812,005 |
$ |
2,719,329 |
|||
Gross realized gains |
7,547 |
17,538 |
28,572 |
||||||
Gross realized losses |
(10,391 |
) |
(8,415 |
) |
(10,417 |
) |
|||
Net realized gain (loss) |
$ |
(2,844 |
) |
$ |
9,123 |
$ |
18,155 |
||
Included in the net realized gains for the year ended December 31, 2018 in the table above are exchanges of securities with a fair value of $81 million. The Company exchanged its investment in a Re-REMIC security for the underlying collateral supporting the group related to the exchanged asset. These exchanges were treated as non-cash sales and purchases and resulted in a net realized gain of $3 million, reflected in earnings for the year ended December 31, 2018. For the year ended December 31, 2017, the fair value of these exchanges of securities was $63 million, and resulted in a realized gain of $9 million.
4. Loans Held for Investment
The Loans held for investment are comprised primarily of loans collateralized by seasoned subprime residential mortgages. Additionally, it includes non-conforming, single family, owner occupied, jumbo, prime residential mortgages.
At December 31, 2018, all Loans held for investment are carried at fair value. See Note 5 for a discussion on how the Company determines the fair values of the Loans held for investment. As changes in the fair value of these loans are reflected in earnings, the Company does not estimate or record a loan loss provision. The total amortized cost of our Loans held for investment was $12.2 billion and $13.3 billion as of December 31, 2018 and December 31, 2017, respectively.
The following table provides a summary of the changes in the carrying value of Loans held for investment at fair value at December 31, 2018 and December 31, 2017:
95
For the Year Ended |
||||||
December 31, 2018 |
December 31, 2017 |
|||||
(dollars in thousands) |
||||||
Balance, beginning of period |
$ |
13,678,263 |
$ |
8,753,653 |
||
Purchases |
1,671,330 |
6,539,765 |
||||
Principal paydowns |
(1,859,155 |
) |
(1,788,409 |
) |
||
Sales and settlements |
(807,364 |
) |
2,876 |
|||
Net periodic accretion (amortization) |
(83,393 |
) |
(35,803 |
) |
||
Realized gains (losses) on sales and settlements |
101 |
— |
||||
Change in fair value |
(27,201 |
) |
206,181 |
|||
Balance, end of period |
$ |
12,572,581 |
$ |
13,678,263 |
||
The primary cause of the change in fair value is due to market demand and changes in credit risk of mortgage loans. During the year ended December 31, 2018, the Company purchased $415 million of loans which were subsequently sold to a trust and securitized, with the Company retaining $40 million of beneficial interests. There were no gains or losses incurred from the sale of these assets.
Residential mortgage loans
The loan portfolio for all residential mortgages were originated during the following years:
Origination Year |
December 31, 2018 |
December 31, 2017 |
||
2002 and prior |
7.3 |
% |
7.5 |
% |
2003 |
6.6 |
% |
6.7 |
% |
2004 |
13.6 |
% |
14.6 |
% |
2005 |
19.5 |
% |
20.4 |
% |
2006 |
22.7 |
% |
23.1 |
% |
2007 |
19.5 |
% |
19.0 |
% |
2008 |
6.2 |
% |
6.0 |
% |
2009 |
1.0 |
% |
0.7 |
% |
2010 and later |
3.6 |
% |
2.0 |
% |
Total |
100.0 |
% |
100.0 |
% |
The following table presents a summary of key characteristics of the residential loan portfolio at December 31, 2018 and December 31, 2017:
December 31, 2018 |
December 31, 2017 |
|||||||
Number of loans |
140,345 |
149,172 |
||||||
Weighted average maturity (years) |
18.6 |
18.8 |
||||||
Weighted average loan to value (1)
|
87.5 |
% |
88.0 |
% |
||||
Weighted average FICO (1)
|
629 |
631 |
||||||
Weighted average loan balance (in thousands) |
$ |
89 |
$ |
91 |
||||
Weighted average percentage owner occupied |
90.1 |
% |
95.0 |
% |
||||
Weighted average percentage single family residence |
86.3 |
% |
86.0 |
% |
||||
Weighted average geographic concentration of top five states |
CA |
9.0 |
% |
CA |
9.0 |
% |
||
FL |
7.3 |
% |
FL |
7.2 |
% |
|||
OH |
5.9 |
% |
OH |
6.1 |
% |
|||
NY |
5.7 |
% |
PA |
5.6 |
% |
|||
PA |
5.6 |
% |
VA |
5.5 |
% |
|||
(1) As provided by the Trustee.
96
The following tables show various characteristics of our residential loan portfolio and outstanding principal balance of the loans that are 30 days delinquent and greater for the year ended December 31, 2018 and 2017, respectively.
December 31, 2018 | |||||||||||||
(dollars in thousands) | |||||||||||||
Loan Balance |
Number of Loans |
Interest Rate |
Maturity Date |
Total Principal |
30-89 Days Delinquent |
90+ Days Delinquent |
|||||||
Held-for-Investment at fair value: |
|||||||||||||
Adjustable rate loans: |
|||||||||||||
$1 to $250 |
8,258 |
1.00% to 19.49% |
6/1/1983 - 6/1/2058 |
$ |
713,392 |
$ |
80,781 |
$ |
48,235 |
||||
$250 to $500 |
456 |
2.00% to 12.75% |
3/1/2023 - 2/1/2057 |
148,867 |
17,722 |
10,779 |
|||||||
$500 to $750 |
65 |
2.00% to 10.00% |
1/1/2034 - 8/1/2047 |
38,148 |
2,979 |
2,762 |
|||||||
$750 to $1,000 |
7 |
4.13% to 5.13% |
4/1/2035 - 4/1/2038 |
6,008 |
784 |
— |
|||||||
Over $1,000 |
7 |
4.00% to 5.00% |
7/1/2037 - 8/1/2039 |
12,195 |
— |
1,164 |
|||||||
8,793 |
$ |
918,610 |
$ |
102,266 |
$ |
62,940 |
|||||||
Fixed loans: |
|||||||||||||
$1 to $250 |
126,085 |
0.00% to 24.00% |
6/1/1989 - 5/1/2062 |
$ |
9,566,517 |
$ |
894,574 |
$ |
591,283 |
||||
$250 to $500 |
4,942 |
0.00% to 12.52% |
4/1/2018 - 11/1/2061 |
1,595,673 |
160,015 |
128,876 |
|||||||
$500 to $750 |
406 |
2.00% to 10.69% |
7/1/2031 - 5/1/2058 |
238,292 |
12,239 |
10,600 |
|||||||
$750 to $1,000 |
88 |
2.00% to 7.98% |
3/1/2013 - 12/1/2055 |
75,289 |
2,677 |
1,805 |
|||||||
Over $1,000 |
31 |
3.00% to 6.38% |
6/1/2037 - 6/1/2057 |
38,200 |
— |
— |
|||||||
131,552 |
$ |
11,513,971 |
$ |
1,069,505 |
$ |
732,564 |
|||||||
Total |
140,345 |
$ |
12,432,581 |
$ |
1,171,771 |
$ |
795,504 |
||||||
The foreclosure, bankruptcy, and REO principal balances on our loans were $292 million, $266 million and $47 million, respectively, as of December 31, 2018, which are included in the table above.
97
December 31, 2017 | |||||||||||||
(dollars in thousands) | |||||||||||||
Loan Balance |
Number of Loans |
Interest Rate |
Maturity Date |
Total Principal |
30-89 Days Delinquent |
90+ Days Delinquent |
|||||||
Held-for-Investment at fair value: |
|||||||||||||
Adjustable rate loans: |
|||||||||||||
$1 to $250 |
9,227 |
1.00% to 18.74% |
9/1/1992 - 6/1/2057 |
$ |
827,020 |
$ |
95,952 |
$ |
46,343 |
||||
$250 to $500 |
529 |
2.00% to 11.88% |
11/1/2028 - 12/1/2056 |
171,266 |
19,289 |
11,855 |
|||||||
$500 to $750 |
67 |
2.00% to 9.25% |
1/1/2034 - 9/1/2046 |
39,212 |
3,041 |
2,382 |
|||||||
$750 to $1,000 |
9 |
3.88% to 5.55% |
1/1/2035 - 12/1/2045 |
7,663 |
757 |
— |
|||||||
Over $1,000 |
8 |
3.88% to 4.00% |
7/1/2037 - 8/1/2039 |
13,702 |
2,705 |
1,164 |
|||||||
9,840 |
$ |
1,058,863 |
$ |
121,744 |
$ |
61,744 |
|||||||
Hybrid loans: |
|||||||||||||
$500 to $750 |
1 |
6.88% to 6.88% |
1/1/2038 - 1/1/2038 |
$ |
702 |
$ |
— |
$ |
— |
||||
1 |
$ |
702 |
$ |
— |
$ |
— |
|||||||
Fixed loans: |
|||||||||||||
$1 to $250 |
133,437 |
0.00% to 24.00% |
9/1/1994 - 5/1/2062 |
$ |
10,371,829 |
$ |
960,564 |
$ |
562,271 |
||||
$250 to $500 |
5,324 |
0.00% to 12.52% |
4/1/2018 - 11/1/2065 |
1,713,839 |
188,257 |
114,616 |
|||||||
$500 to $750 |
440 |
2.00% to 10.69% |
7/1/2031 - 9/1/2057 |
258,058 |
12,789 |
13,459 |
|||||||
$750 to $1,000 |
99 |
2.00% to 7.69% |
3/1/2013 - 12/1/2055 |
84,701 |
1,706 |
877 |
|||||||
Over $1,000 |
31 |
3.00% to 5.75% |
12/1/2040 - 7/1/2056 |
37,828 |
1,155 |
— |
|||||||
139,331 |
$ |
12,466,255 |
$ |
1,164,471 |
$ |
691,223 |
|||||||
Total |
149,172 |
$ |
13,525,820 |
$ |
1,286,215 |
$ |
752,967 |
||||||
The foreclosure, bankruptcy, and REO principal balances on our loans were $200 million, $273 million and $31 million, respectively, as of December 31, 2017, which are included in the table above.
The fair value of residential mortgage loans 90 days or more past due was $606 million and $577 million as of December 31, 2018 and December 31, 2017, respectively.
5. Fair Value Measurements
The Company applies fair value guidance in accordance with GAAP to account for its financial instruments. The Company categorizes its financial instruments, based on the priority of the inputs to the valuation technique, into a three-level fair value hierarchy. The fair value hierarchy gives the highest priority to quoted prices in active markets for identical assets or liabilities (Level 1) and the lowest priority to unobservable inputs (Level 3). If the inputs used to measure the financial instruments fall within different levels of the hierarchy, the categorization is based on the lowest level input that is significant to the fair value measurement of the instrument. Financial assets and liabilities recorded at fair value on the Consolidated Statements of Financial Condition or disclosed in the related notes are categorized based on the inputs to the valuation techniques as follows:
Level 1 – inputs to the valuation methodology are quoted prices (unadjusted) for identical assets and liabilities in active markets.
Level 2 – inputs to the valuation methodology include quoted prices for similar assets and liabilities in active markets, and inputs that are observable for the asset or liability, either directly or indirectly, for substantially the full term of the financial instrument.
98
Level 3 – inputs to the valuation methodology are unobservable and significant to fair value.
Fair value measurements categorized within Level 3 are sensitive to changes in the assumptions or methodology used to determine fair value and such changes could result in a significant increase or decrease in the fair value. Any changes to the valuation methodology are reviewed by management to ensure the changes are appropriate. As markets and products evolve and the pricing for certain products becomes more transparent, the Company will continue to refine its valuation methodologies. The methodology utilized by the Company for the periods presented is unchanged. The methods used to produce a fair value calculation may not be indicative of net realizable value or reflective of future fair values. Furthermore, the Company believes its valuation methods are appropriate and consistent with other market participants. Using different methodologies, or assumptions, to determine the fair value of certain financial instruments could result in a different estimate of fair value at the reporting date. The Company uses inputs that are current as of the measurement date, which may include periods of market dislocation, during which price transparency may be reduced.
During times of market dislocation, the observability of prices and inputs can be difficult for certain investments. If third party pricing services are unable to provide a price for an asset, or if the price provided by them is deemed unreliable by the Company, then the asset will be valued at its fair value as determined by the Company without validation to third-party pricing. Illiquid investments typically experience greater price volatility as an active market does not exist. Observability of prices and inputs can vary significantly from period to period and may cause instruments to change classifications within the three level hierarchy.
A description of the methodologies utilized by the Company to estimate the fair value of its financial instruments by instrument class follows:
Agency MBS and Non-Agency RMBS
The Company determines the fair value of all of its investment securities based on discounted cash flows utilizing an internal pricing model that incorporates factors such as coupon, prepayment speeds, loan size, collateral composition, borrower characteristics, expected interest rates, life caps, periodic caps, reset dates, collateral seasoning, delinquency, expected losses, expected default severity, credit enhancement, and other pertinent factors. To corroborate that the estimates of fair values generated by these internal models are reflective of current market prices, the Company compares the fair values generated by the model to non-binding independent prices provided by two independent third party pricing services. For certain highly liquid asset classes, such as Agency fixed-rate pass-through bonds, the Company’s valuations are also compared to quoted prices for To-Be-Announced, or TBA, securities.
Each quarter the Company develops thresholds which are determined utilizing current bid/ask spreads, liquidity, price volatility and other factors as appropriate. If internally developed model prices differ from the independent prices provided by greater than a market derived predetermined threshold for the period, the Company highlights these differences for further review, both internally and with the third party pricing service. The Company obtains the inputs used by the third party pricing services and compares them to the Company’s inputs. The Company updates its own inputs if the Company determines the third party pricing inputs more accurately reflect the current market environment. If the Company believes that its internally developed inputs more accurately reflect the current market environment, it will request that the third party pricing service review market factors that may not have been considered by the third party pricing service and provide updated prices. The Company reconciles and resolves all pricing differences in excess of the predetermined thresholds before a final price is established. At December 31, 2018, nineteen investment holdings with an internally developed fair value of $127 million had a difference between the model generated prices and third party prices provided in excess of the derived predetermined threshold for the period. The internally developed prices were $4 million higher than the third party prices provided of $123 million. After review and discussion, the Company affirmed and valued the investments at the higher internally developed prices. No other differences were noted at December 31, 2018 in excess of the derived predetermined threshold for the period. At December 31, 2017, four investment holdings with an internally developed fair value of $25 million had a difference between the model generated prices and third party prices provided in excess of the derived predetermined threshold for the period. The internally developed prices were $3 million lower than the third party prices provided of $28 million. After review and discussion, the Company affirmed and valued the investments at the lower internally developed prices.
The Company’s estimate of prepayment, default and severity curves all involve judgment and assumptions that are deemed to be significant to the fair value measurement process, which renders the resulting Non-Agency RMBS fair value estimates Level 3 inputs in the fair value hierarchy. As the fair values of Agency MBS are more observable, these investments are classified as level 2 in the fair value hierarchy.
Loans Held for Investment
99
Loans consisting of seasoned subprime residential mortgage loans:
The Company estimates the fair value of its Loans held for investment consisting of seasoned subprime residential mortgage loans on a loan by loan basis using an internally developed model which compares the loan held by the Company with a loan currently offered in the market. The loan price is adjusted in the model by considering the loan factors which would impact the value of a loan. These loan factors include: loan coupon as compared to coupon currently available in the market, FICO, loan-to-value ratios, delinquency history, owner occupancy, and property type, among other factors. A baseline is developed for each significant loan factor and adjusts the price up or down depending on how that factor for each specific loan compares to the baseline rate. Generally, the most significant impact on loan value is the loan interest rate as compared to interest rates currently available in the market and delinquency history.
The Company also monitors market activity to identify trades which may be used to compare internally developed prices; however, as the portfolio of loans held at fair value is a seasoned subprime pool of mortgage loans, comparable loan pools are not common or directly comparable. There are limited transactions in the market place to develop a comprehensive direct range of values.
The Company reviews the fair values generated by the model to determine whether prices are reflective of the current market by corroborating its estimates of fair value by comparing the results to non-binding independent prices provided by two independent third party pricing services for the loan portfolio. Each quarter the Company develops thresholds which are determined utilizing the securitization market.
If the internally developed fair values of the loan pools differ from the independent prices provided by greater than a predetermined threshold for the period, the Company highlights these differences for further review, both internally and with the third party pricing service. The Company obtains certain inputs used by the third party pricing services and evaluates them for reasonableness. The Company updates its own model if the Company determines the third party pricing inputs more accurately reflect the current market environment or observed information from the third party vendors. If the Company believes that its internally developed inputs more accurately reflect the current market environment, it will request that the third party pricing service review market factors that may not have been considered by the third party pricing service. The Company reconciles and resolves all pricing differences in excess of the predetermined thresholds before a final price is established.
At December 31, 2018, the internally developed fair value of three loan pools of $489 million had a difference between the model generated prices and third party prices provided in excess of the derived predetermined threshold for the period. The internally developed prices were $3 million higher than the third party price provided of $486 million. After review and discussion, the Company affirmed and valued the investment at the higher internally developed price. At December 31, 2017, there were no pricing differences in excess of the predetermined thresholds between the model generated prices and third party prices.
The Company’s estimates of fair value of Loans held for investment involve management judgment and assumptions that are deemed to be significant to the fair value measurement process, which renders the resulting fair value estimates level 3 inputs in the fair value hierarchy.
Loans collateralized by jumbo, prime residential mortgages:
The loans collateralized by jumbo, prime residential mortgages are carried at fair value. The loans are held as part of a consolidated Collateralized Financing Entity, or a CFE. A CFE is a variable interest entity that holds financial assets, issues beneficial interests in those assets and has no more than nominal equity and the beneficial interests have contractual recourse only to the related assets of the CFE. Accounting guidance for CFEs allow the Company to elect to measure the CFE’s financial assets using the fair value of the CFE’s financial liabilities as the fair values of the financial liabilities of the CFE are more observable. Therefore, the fair value of the loans collateralized by jumbo, prime residential mortgages is based on the fair value of the financial liabilities. See discussion of the fair value of Securitized Debt, collateralized by Loans Held for Investment at fair value below.
As the more observable financial liabilities are considered level 3 in the fair value hierarchy, the Loans collateralized by jumbo, prime residential mortgages are also level 3 in the fair value hierarchy.
Securitized Debt, collateralized by Non-Agency RMBS
The Company carries securitized debt, collateralized by Non-Agency RMBS at the principal balance outstanding plus unamortized premiums, less unaccreted discounts recorded in connection with the financing of the loans or RMBS with third parties. For disclosure purposes, the Company estimates the fair value of securitized debt, collateralized by Non-Agency RMBS
100
by estimating the future cash flows associated with the underlying assets collateralizing the secured debt outstanding. The Company models the fair value of each underlying asset by considering, among other items, the structure of the underlying security, coupon, servicer, delinquency, actual and expected defaults, actual and expected default severities, reset indices, and prepayment speeds in conjunction with market research for similar collateral performance and management’s expectations of general economic conditions in the sector and other economic factors. This process, including the review process, is consistent with the process used for Agency MBS and Non-Agency RMBS using internal models. For further discussion of the valuation process and benchmarking process, see Agency MBS and Non-Agency RMBS discussion herein.
The Company’s estimates of fair value of securitized debt, collateralized by Non-Agency RMBS involve management’s judgment and assumptions that are deemed to be significant to the fair value measurement process, which renders the resulting fair value estimates level 3 inputs in the fair value hierarchy.
Securitized Debt, collateralized by Loans Held for Investment
The process for determining the fair value of securitized debt, collateralized by loans held for investment is based on discounted cash flows utilizing an internal pricing model that incorporates factors such as coupon, prepayment speeds, loan size, collateral composition, borrower characteristics, expected interest rates, life caps, periodic caps, reset dates, collateral seasoning, expected losses, expected default severity, credit enhancement, and other pertinent factors. This process, including the review process, is consistent with the process used for Agency MBS and Non-Agency RMBS using internal models. For further discussion of the valuation process and benchmarking process, see Agency MBS and Non-Agency RMBS discussion herein.
The Company’s estimates of fair value of securitized debt, collateralized by loans held for investment involve management’s judgment and assumptions that are deemed to be significant to the fair value measurement process, which renders the resulting fair value estimates level 3 inputs in the fair value hierarchy.
Fair value option
The table below shows the unpaid principal, fair value and impact of change in fair value on each of the financial instruments carried with fair value option as of December 31, 2018 and 2017, respectively:
December 31, 2018 |
|||||||||
(dollars in thousands) |
|||||||||
Unpaid Principal/ Notional |
Fair Value |
Year to Date Gain/(Loss) on Change in Fair Value |
|||||||
Assets: |
|||||||||
Non-agency RMBS |
|||||||||
Subordinated |
N/A |
$ |
12,014 |
$ |
(145 |
) |
|||
Senior, interest-only |
5,667,198 |
254,890 |
20,095 |
||||||
Subordinated, interest-only |
221,549 |
11,649 |
1,261 |
||||||
Agency MBS |
|||||||||
Residential Pass-through |
7,573,835 |
7,739,382 |
31,185 |
||||||
Commercial Pass-through |
1,607,626 |
1,595,681 |
(35,002 |
) |
|||||
Interest-only |
3,028,572 |
133,346 |
4,230 |
||||||
Loans held for investment, at fair value |
12,432,582 |
12,572,581 |
(27,201 |
) |
|||||
Liabilities: |
|||||||||
Securitized debt at fair value, collateralized by loans held for investment |
8,561,319 |
8,455,376 |
52,209 |
||||||
101
December 31, 2017 |
|||||||||
(dollars in thousands) |
|||||||||
Unpaid Principal/ Notional |
Fair Value |
Year to Date Gain/(Loss) on Change in Fair Value |
|||||||
Assets: |
|||||||||
Non-agency RMBS |
|||||||||
Subordinated |
N/A |
$ |
13,993 |
$ |
1,246 |
||||
Senior, interest-only |
4,862,461 |
210,850 |
(13,290 |
) |
|||||
Subordinated, interest-only |
201,378 |
7,826 |
2,311 |
||||||
Agency MBS |
|||||||||
Residential Pass-through |
577,522 |
602,829 |
(4,816 |
) |
|||||
Commercial Pass-through |
564,379 |
570,105 |
(2,398 |
) |
|||||
Interest-only |
3,021,840 |
104,367 |
465 |
||||||
Loans held for investment, at fair value |
13,525,820 |
13,678,263 |
206,181 |
||||||
Liabilities: |
|||||||||
Securitized debt at fair value, collateralized by loans held for investment |
9,395,854 |
9,388,657 |
(78,289 |
) |
|||||
Derivatives
Interest Rate Swaps and Swaptions
The Company uses clearing exchange market prices to determine the fair value of its exchange cleared interest rate swaps. For bi-lateral swaps, the Company determines the fair value based on the net present value of expected future cash flows on the swap. The Company uses option pricing model to determine the fair value of its swaptions. For bi-lateral swaps and swaptions, the Company compares its own estimate of fair value with counterparty prices to evaluate for reasonableness. Both the clearing exchange and counter-party pricing quotes, incorporate common market pricing methods, including a spread measurement to the Treasury yield curve or interest rate swap curve as well as underlying characteristics of the particular contract. Interest rate swaps and swaptions are modeled by the Company by incorporating such factors as the term to maturity, swap curve, overnight index swap rates, and the payment rates on the fixed portion of the interest rate swaps. The Company has classified the characteristics used to determine the fair value of interest rate swaps and swaptions as Level 2 inputs in the fair value hierarchy.
Treasury Futures
The fair value of Treasury futures is determined by quoted market prices in an active market. The Company has classified the characteristics used to determine the fair value of Treasury futures as Level 1 inputs in the fair value hierarchy.
Repurchase Agreements
Repurchase agreements are collateralized financing transactions utilized by the Company to acquire investment securities. Due to the short term nature of these financial instruments, the Company estimates the fair value of these repurchase agreements using the contractual obligation plus accrued interest payable.
Short-term Financial Instruments
The carrying value of cash and cash equivalents, accrued interest receivable, dividends payable, payable for investments purchased and accrued interest payable are considered to be a reasonable estimate of fair value due to the short term nature and low credit risk of these short-term financial instruments.
The Company’s financial assets and liabilities carried at fair value on a recurring basis, including the level in the fair value hierarchy, at December 31, 2018 and December 31, 2017 are presented below.
102
December 31, 2018 |
|||||||||||||||
(dollars in thousands) |
|||||||||||||||
Level 1 |
Level 2 |
Level 3 |
Counterparty and Cash Collateral, netting |
Total |
|||||||||||
Assets: |
|||||||||||||||
Non-Agency RMBS, at fair value |
$ |
— |
$ |
— |
$ |
2,486,130 |
$ |
— |
$ |
2,486,130 |
|||||
Agency MBS, at fair value |
— |
12,188,950 |
— |
— |
12,188,950 |
||||||||||
Loans held for investment, at fair value |
— |
— |
12,572,581 |
— |
12,572,581 |
||||||||||
Derivatives |
— |
89,121 |
— |
(51,653 |
) |
37,468 |
|||||||||
Liabilities: |
|||||||||||||||
Securitized debt at fair value, collateralized by loans held for investment |
— |
— |
8,455,376 |
— |
8,455,376 |
||||||||||
Derivatives |
13,375 |
169,790 |
— |
(183,165 |
) |
— |
|||||||||
December 31, 2017 |
||||||||||||||
(dollars in thousands) |
||||||||||||||
Level 1 |
Level 2 |
Level 3 |
Counterparty and Cash Collateral, netting |
Total |
||||||||||
Assets: |
||||||||||||||
Non-Agency RMBS, at fair value |
$ |
— |
$ |
— |
2,851,316 |
$ |
— |
$ |
2,851,316 |
|||||
Agency MBS, at fair value |
— |
4,364,828 |
— |
— |
4,364,828 |
|||||||||
Loans held for investment, at fair value |
— |
— |
13,678,263 |
— |
13,678,263 |
|||||||||
Derivatives |
3,553 |
46,978 |
— |
(1,617 |
) |
48,914 |
||||||||
Liabilities: |
||||||||||||||
Securitized debt at fair value, collateralized by loans held for investment |
— |
— |
9,388,657 |
— |
9,388,657 |
|||||||||
Derivatives |
— |
1,937 |
— |
(1,617 |
) |
320 |
||||||||
The table below provides a summary of the changes in the fair value of securities classified as Level 3 at December 31, 2018 and December 31, 2017.
103
Fair Value Reconciliation, Level 3 | |||||||||
For the Year Ended, December 31, 2018 |
|||||||||
(dollars in thousands) |
|||||||||
Non-Agency RMBS |
Loans held for investment |
Securitized Debt |
|||||||
Beginning balance Level 3 |
$ |
2,851,316 |
$ |
13,678,263 |
$ |
9,388,657 |
|||
Transfers in to Level 3 |
— |
— |
— |
||||||
Transfers out of Level 3 |
— |
— |
— |
||||||
Purchases of assets/ issuance of debt |
253,952 |
1,671,330 |
1,769,539 |
||||||
Principal payments |
(521,109 |
) |
(1,859,155 |
) |
(1,778,625 |
) |
|||
Sales and Settlements |
(100,786 |
) |
(807,364 |
) |
(834,414 |
) |
|||
Net accretion (amortization) |
101,088 |
(83,393 |
) |
(11,197 |
) |
||||
Gains (losses) included in net income |
|||||||||
Other than temporary credit impairment losses |
(21,791 |
) |
— |
— |
|||||
Realized gains (losses) on sales and settlements |
201 |
101 |
(26,375 |
) |
|||||
Net unrealized gains (losses) included in income |
21,208 |
(27,201 |
) |
(52,209 |
) |
||||
Gains (losses) included in other comprehensive income |
|||||||||
Total unrealized gains (losses) for the period |
(97,949 |
) |
— |
— |
|||||
Ending balance Level 3 |
$ |
2,486,130 |
$ |
12,572,581 |
$ |
8,455,376 |
|||
Fair Value Reconciliation, Level 3 | |||||||||
For the Year Ended, December 31, 2017 |
|||||||||
(dollars in thousands) |
|||||||||
Non-Agency RMBS |
Loans held for investment |
Securitized Debt |
|||||||
Beginning balance Level 3 |
$ |
3,330,063 |
$ |
8,753,653 |
$ |
6,941,097 |
|||
Transfers in to Level 3 |
6,112 |
— |
— |
||||||
Transfers out of Level 3 |
— |
— |
— |
||||||
Purchases of assets/ issuance of debt |
78,400 |
6,539,765 |
5,173,430 |
||||||
Principal payments |
(568,339 |
) |
(1,788,409 |
) |
(1,787,368 |
) |
|||
Sales and Settlements |
(68,162 |
) |
2,876 |
(1,056,765 |
) |
||||
Net accretion (amortization) |
120,119 |
(35,803 |
) |
4,701 |
|||||
Gains (losses) included in net income |
|||||||||
Other than temporary credit impairment losses |
(59,881 |
) |
— |
— |
|||||
Realized gains (losses) on sales and settlements |
12,031 |
— |
35,273 |
||||||
Net unrealized gains (losses) included in income |
(9,733 |
) |
206,181 |
78,289 |
|||||
Gains (losses) included in other comprehensive income |
|||||||||
Total unrealized gains (losses) for the period |
10,706 |
— |
— |
||||||
Ending balance Level 3 |
$ |
2,851,316 |
$ |
13,678,263 |
$ |
9,388,657 |
|||
There were no transfers in or out from Level 3, during the year ended December 31, 2018. There were $6 million of IOs transferred to Level 3 and no transfers out from Level 3 for the year ended December 31, 2017. The primary cause of the changes in fair value of the loans and the securitized debt are due to market demand for these instruments and changes in credit risk of the portfolio.
The significant unobservable inputs used in the fair value measurement of the Company’s Non-Agency RMBS and securitized debt are the weighted average discount rates, constant prepayment speed, or CPR, cumulative default rate, and the loss severity.
Constant Prepayment Rates
The prepayment speed specifies the percentage of the collateral balance that is expected to prepay at each point in the future. The prepayment speed is based on factors such as collateral FICO score, loan-to-value ratio, debt-to-income ratio, and vintage
104
on a loan level basis and is scaled up or down to reflect recent collateral-specific prepayment experience as obtained from remittance reports and market data services.
For securitized debt carried at fair value issued at a premium, as prepayment speeds increase, the amount of interest expense the Company recognizes decreases as the issued premium on the debt amortizes faster than expected. Conversely, decreases in prepayment speeds result in increased expense and can extend the period over which the Company amortizes the premium.
For debt issued at a discount, as prepayment speeds increase, the amount of interest the Company expenses increases from the acceleration of the accretion of the discount into interest expense. Conversely, decreases in prepayment speeds result in decreased expense as the accretion of the discount into interest expense occurs over a longer period.
Constant Default Rates
Constant default rates represent an annualized rate of default on a group of mortgages. The constant default rate, or CDR, represents the percentage of outstanding principal balances in the pool that are in default, which typically equates to the home being past 60-day and 90-day notices and in the foreclosure process. When default rates increase, expected cash flows on the underlying collateral decreases. When default rates decrease, expected cash flows on the underlying collateral increases.
Default vectors are determined from the current “pipeline” of loans that are more than 30 days delinquent, in foreclosure, bankruptcy, or are REO. These delinquent loans determine the first 30 months of the default curve. Beyond month 30, the default curve transitions to a value that is reflective of a portion of the current delinquency pipeline.
Loss Severity
Loss severity rates reflect the amount of loss expected from a foreclosure and liquidation of the underlying collateral in the mortgage loan pool. When a mortgage loan is foreclosed the collateral is sold and the resulting proceeds are used to settle the outstanding obligation. In many circumstances, the proceeds from the sale do not fully repay the outstanding obligation. In these cases, a loss is incurred by the lender. Loss severity is used to predict how costly future losses are likely to be. An increase in loss severity results in a decrease in expected future cash flows. A decrease in loss severity results in an increase in expected future cash flows.
The curve generated to reflect the Company’s expected loss severity is based on collateral-specific experience with consideration given to other mitigating collateral characteristics. Characteristics such as seasoning are taken into consideration because severities tend to initially increase on newly originated securities, before beginning to decline as the collateral ages and eventually stabilize. Collateral characteristics such as loan size, loan-to-value, and geographic location of collateral also effect loss severity.
Discount Rate
The discount rate refers to the interest rate used in the discounted cash flow analysis to determine the present value of future cash flows. The discount rate takes into account not just the time value of money, but also the risk or uncertainty of future cash flows. An increased uncertainty of future cash flows results in a higher discount rate. The discount rate used to calculate the present value of the expected future cash flows is based on the discount rate implicit in the security as of the last measurement date. As discount rates move up, the discounted cash flows are reduced.
The discount rates applied to the expected cash flows to determine fair value are derived from a range of observable prices on securities backed by similar collateral. As the market becomes more or less liquid, the availability of these observable inputs will change.
Sensitivity of Significant Inputs – Non-Agency RMBS and securitized debt, collateralized by loans held for investment
Prepayment speeds, as reflected by the CPR, vary according to interest rates, the type of financial instrument, conditions in financial markets, and other factors, none of which can be predicted with any certainty. In general, when interest rates rise, it is relatively less attractive for borrowers to refinance their mortgage loans, and as a result, prepayment speeds tend to decrease. When interest rates fall, prepayment speeds tend to increase. For RMBS investments purchased at a premium, as prepayment speeds increase, the amount of income the Company earns decreases as the purchase premium on the bonds amortizes faster than expected. Conversely, decreases in prepayment speeds result in increased income and can extend the period over which the Company amortizes the purchase premium. For RMBS investments purchased at a discount, as prepayment speeds increase, the amount of income the Company earns increases from the acceleration of the accretion of the discount into interest income.
105
Conversely, decreases in prepayment speeds result in decreased income as the accretion of the purchase discount into interest income occurs over a longer period.
A summary of the significant inputs used to estimate the fair value of Non-Agency RMBS held for investment at fair value as of December 31, 2018 and December 31, 2017 follows:
December 31, 2018 |
December 31, 2017 |
||||||||
Significant Inputs |
Significant Inputs |
||||||||
Weighted Average Discount Rate |
CPR |
CDR |
Loss Severity |
Weighted Average Discount Rate |
CPR |
CDR |
Loss Severity |
||
Range |
Range |
||||||||
Non-Agency RMBS |
|||||||||
Senior |
4.5% |
1% -25% |
0% -60% |
35% -95% |
4.4% |
1% -45% |
0% -55% |
35% -89% |
|
Senior interest-only |
11.1% |
3% -32% |
0% -60% |
30% -95% |
11.2% |
3% -25% |
0% -50% |
35% -95% |
|
Subordinated |
5.8% |
1% -19% |
0% -34% |
10% -70% |
5.8% |
1% -20% |
0% -33% |
35% -69% |
|
Subordinated interest-only |
12.0% |
4% -25% |
0% -24% |
35% -68% |
12.0% |
6% -22% |
0% -9% |
35% -63% |
|
A summary of the significant inputs used to estimate the fair value of securitized debt at fair value, collateralized by loans held for investment, as of December 31, 2018 and December 31, 2017 follows:
December 31, 2018 |
December 31, 2017 |
||||||||
Significant Inputs |
Significant Inputs |
||||||||
Weighted Average Discount Rate |
CPR Range |
CDR Range |
Loss Severity Range |
Weighted Average Discount Rate |
CPR Range |
CDR Range |
Loss Severity Range |
||
Securitized debt at fair value, collateralized by loans held for investment |
4.3% |
6% - 18% |
0% - 23% |
30% - 65% |
4.1% |
6% - 15% |
0% - 6% |
35% - 60% |
|
All of the significant inputs listed have some degree of market observability, based on the Company’s knowledge of the market, information available to market participants, and use of common market data sources. Collateral default and loss severity projections are in the form of “curves” that are updated quarterly to reflect the Company’s collateral cash flow projections. Methods used to develop these projections conform to industry conventions. The Company uses assumptions it considers its best estimate of future cash flows for each security.
Sensitivity of Significant Inputs – Loans held for investment
The Loans held for investment are comprised primarily of loans collateralized by seasoned subprime residential mortgages. Additionally, it includes non-conforming, single family, owner occupied, jumbo, prime residential mortgages. The significant unobservable inputs used to estimate the fair value of the Loans held for investment collateralized by seasoned subprime residential mortgage loans, as of December 31, 2018 and December 31, 2017 include coupon, FICO score at origination, loan-to-value ratios (LTV), owner occupancy status, and property type. A summary of the significant inputs used to estimate the fair value of Loans held for investment collateralized by seasoned subprime mortgages at fair value as of December 31, 2018 and December 31, 2017 follows:
106
December 31, 2018 |
December 31, 2017 |
||
Factor: |
|||
Coupon |
|||
Base Rate |
5.2% |
4.8% |
|
Actual |
6.9% |
6.9% |
|
FICO |
|||
Base Rate |
638 |
636 |
|
Actual |
626 |
627 |
|
Loan-to-value (LTV) |
|||
Base Rate |
88% |
89% |
|
Actual |
88% |
88% |
|
Loan Characteristics: |
|||
Occupancy |
|||
Owner Occupied |
90% |
95% |
|
Investor |
1% |
1% |
|
Secondary |
9% |
4% |
|
Property Type |
|||
Single family |
86% |
87% |
|
Manufactured housing |
4% |
4% |
|
Multi-family/mixed use/other |
10% |
9% |
|
The loan factors are generally not observable for the individual loans and the base rates developed by the Company’s internal model are subjective and change as market conditions change. The impact of the loan coupon on the value of the loan is dependent on whether the loan is clean or reperforming. A clean loan, with no history of delinquent payments and a relatively high loan interest rate would result in a higher overall value than a reperforming loan which has a history of delinquency. Similarly, a higher FICO score and a lower LTV ratio results in increases in the fair market value of the loan and a lower FICO score and a higher LTV ratio results in a lower value.
Property types also affect the overall loan values. Property types include single family, manufactured housing and multi-family/mixed use and other types of properties. Single family homes represent properties which house one to four family units. Manufactured homes include mobile homes and modular homes. Loan value for properties that are investor or secondary homes have a reduced value as compared to the baseline loan value. Additionally, single family homes will result in an increase to the loan value where manufactured and multi-family/mixed use and other properties will result in a decrease to the loan value, as compared to the baseline.
Financial instruments not carried at fair value
The following table presents the carrying value and fair value, as described above, of the Company’s financial instruments not carried at fair value on a recurring basis at December 31, 2018 and December 31, 2017.
December 31, 2018 |
|||||
(dollars in thousands) |
|||||
Level in Fair Value Hierarchy |
Carrying Amount |
Fair Value |
|||
Repurchase agreements |
2 |
14,030,465 |
14,085,164 |
||
Securitized debt, collateralized by Non-Agency RMBS |
3 |
159,955 |
140,711 |
||
107
December 31, 2017 |
|||||
(dollars in thousands) |
|||||
Level in Fair Value Hierarchy |
Carrying Amount |
Fair Value |
|||
Repurchase agreements |
2 |
7,250,452 |
7,269,193 |
||
Securitized debt, collateralized by Non-Agency RMBS |
3 |
205,780 |
192,259 |
||
6. Repurchase Agreements
The interest rates of the Company’s repurchase agreements are generally indexed to the one-month and three-month LIBOR rates and re-price accordingly. The repurchase agreements outstanding, weighted average borrowing rates, weighted average remaining maturities, average daily balances and the fair value of collateral pledged as of December 31, 2018 and December 31, 2017 were:
December 31, 2018 |
December 31, 2017 |
|||||
Repurchase agreements outstanding secured by: |
||||||
Agency MBS (in thousands) |
$ |
10,193,272 |
$ |
3,202,056 |
||
Non-agency MBS and Loans held for investment (in thousands) |
3,837,193 |
4,048,396 |
||||
Total: |
$ |
14,030,465 |
$ |
7,250,452 |
||
Average balance of Repurchase agreements secured by: |
||||||
Agency MBS (in thousands) |
$ |
6,085,643 |
$ |
3,120,474 |
||
Non-agency MBS and Loans held for investment (in thousands) |
3,730,527 |
3,203,700 |
||||
Total: |
$ |
9,816,170 |
$ |
6,324,174 |
||
Average borrowing rate of Repurchase agreements secured by: |
||||||
Agency MBS |
2.55 |
% |
1.47 |
% |
||
Non-agency MBS and Loans held for investment |
4.04 |
% |
3.41 |
% |
||
Average remaining maturity of Repurchase agreements secured by: |
||||||
Agency MBS |
30 Days |
28 Days |
||||
Non-agency MBS and Loans held for investment |
231 Days |
93 Days |
||||
Average original maturity of Repurchase agreements secured by: |
||||||
Agency MBS |
88 Days |
87 Days |
||||
Non-agency MBS and Loans held for investment |
259 Days |
123 Days |
||||
MBS pledged as collateral at fair value on Repurchase agreements: |
||||||
Agency MBS (in thousands) |
$ |
10,832,018 |
$ |
3,450,123 |
||
Non-agency MBS and Loans held for investment (in thousands) |
4,998,990 |
5,338,557 |
||||
Total: |
$ |
15,831,008 |
$ |
8,788,680 |
||
At December 31, 2018 and December 31, 2017, the repurchase agreements collateralized by MBS and Loans held for investment had the following remaining maturities.
108
December 31, 2018 |
December 31, 2017 |
|||||
(dollars in thousands) |
||||||
Overnight |
$ |
— |
$ |
— |
||
1 to 29 days |
6,326,232 |
4,745,342 |
||||
30 to 59 days |
4,620,656 |
1,206,769 |
||||
60 to 89 days |
1,504,695 |
592,865 |
||||
90 to 119 days |
169,244 |
— |
||||
Greater than or equal to 120 days |
1,409,638 |
705,476 |
||||
Total |
$ |
14,030,465 |
$ |
7,250,452 |
||
At December 31, 2018, there was no amount at risk with any counterparty greater than 10% of the Company's equity. At December 31, 2017, the Company had an amount at risk with Credit Suisse of 12% of its equity related to the collateral posted on repurchase agreements. As of December 31, 2017, the weighted average maturity of the repurchase agreements with Credit Suisse was 25 days and the amount at risk was $451 million. There were no other amounts at risk with any other counterparties greater than 10% of the Company’s equity as of December 31, 2017.
7. Securitized Debt
All of the Company’s securitized debt is collateralized by residential mortgage loans or Non-Agency RMBS. For financial reporting purposes, the Company’s securitized debt is accounted for as secured borrowings. Thus, the residential mortgage loans or RMBS held as collateral are recorded in the assets of the Company as Loans held for investment or Non-Agency RMBS and the securitized debt is recorded as a non-recourse liability in the accompanying Consolidated Statements of Financial Condition.
Securitized Debt Collateralized by Non-Agency RMBS
At December 31, 2018 and December 31, 2017 the Company’s securitized debt collateralized by Non-Agency RMBS is carried at amortized cost and had a principal balance of $175 million and $219 million, respectively. At December 31, 2018 and December 31, 2017, the debt carried a weighted average coupon equal to 6.4% and 6.2%, respectively. As of December 31, 2018, the maturities of the debt range between the years 2035 and 2037. None of the Company’s securitized debt collateralized by Non-Agency RMBS is callable.
There were no securitized debt collateralized by Non-Agency RMBS acquisitions during the year ended December 31, 2018. During the year ended December 31, 2017, the Company acquired securitized debt collateralized by Non-Agency RMBS with an amortized cost balance of $166 thousand for $167 thousand. This transaction resulted in a net loss on the extinguishment of debt of $1 thousand, which is reflected in earnings for the year ended December 31, 2017.
The following table presents the estimated principal repayment schedule of the securitized debt collateralized by Non-Agency RMBS at December 31, 2018 and December 31, 2017, based on expected cash flows of the residential mortgage loans or RMBS, as adjusted for projected losses on the underlying collateral of the debt. All of the securitized debt recorded in the Company’s Consolidated Statements of Financial Condition is non-recourse to the Company.
December 31, 2018 |
December 31, 2017 |
|||||
(dollars in thousands) |
||||||
Within One Year |
$ |
23,602 |
$ |
42,217 |
||
One to Three Years |
30,803 |
45,916 |
||||
Three to Five Years |
8,047 |
16,524 |
||||
Greater Than Five Years |
3,605 |
4,867 |
||||
Total |
$ |
66,057 |
$ |
109,524 |
||
Maturities of the Company’s securitized debt collateralized by Non-Agency RMBS are dependent upon cash flows received from the underlying collateral. The estimate of their repayment is based on scheduled principal payments on the underlying collateral. This estimate will differ from actual amounts to the extent prepayments or losses are experienced. See Note 3 for a more detailed discussion of the securities collateralizing the securitized debt.
Securitized Debt Collateralized by Loans Held for Investment
109
At December 31, 2018 and December 31, 2017 the Company’s securitized debt collateralized by loans held for investment had a principal balance of $8.6 billion and $9.4 billion, respectively. At December 31, 2018 and December 31, 2017 the total securitized debt collateralized by loans held for investment carried a weighted average coupon equal to 4.5% and 4.2%, respectively. As of December 31, 2018, the maturities of the debt range between the years 2023 and 2067.
During the year ended December 31, 2018, the Company acquired securitized debt collateralized by loans with an amortized cost balance of $861 million for $835 million. These transactions resulted in a net gain on the extinguishment of debt of $26 million, which is reflected in earnings for the year ended December 31, 2018.
During the year ended December 31, 2017, the Company acquired securitized debt collateralized by loans with an amortized cost balance of $1.0 billion for $1.1 billion. This transaction resulted in a net loss on the extinguishment of debt of $35 million. As the Company's securitized debt is carried at fair value with changes in fair value reflected in earnings some of this loss was recognized during prior periods.
The following table presents the estimated principal repayment schedule of the securitized debt collateralized by loans held for investment at December 31, 2018 and December 31, 2017, based on expected cash flows of the residential mortgage loans or RMBS, as adjusted for projected losses on the underlying collateral of the debt. All of the securitized debt recorded in the Company’s Consolidated Statements of Financial Condition is non-recourse to the Company.
December 31, 2018 |
December 31, 2017 |
|||||
(dollars in thousands) |
||||||
Within One Year |
$ |
1,608,381 |
$ |
1,819,018 |
||
One to Three Years |
2,587,635 |
2,872,572 |
||||
Three to Five Years |
1,949,060 |
2,140,434 |
||||
Greater Than Five Years |
2,237,259 |
2,439,872 |
||||
Total |
$ |
8,382,335 |
$ |
9,271,896 |
||
Maturities of the Company’s securitized debt collateralized by loans held for investment are dependent upon cash flows received from the underlying loans. The estimate of their repayment is based on scheduled principal payments on the underlying loans. This estimate will differ from actual amounts to the extent prepayments or loan losses are experienced. See Note 4 for a more detailed discussion of the loans collateralizing the securitized debt.
Certain of the securitized debt collateralized by loans held for investment contain call provisions at the option of the Company. The following table presents the par value of the callable debt by year at December 31, 2018.
December 31, 2018 | |||
(dollars in thousands) | |||
Year |
Principal |
||
2019 |
$ |
324,966 |
|
2020 |
4,188,854 |
||
2021 |
3,457,006 |
||
2022 |
274,152 |
||
2023 |
130,811 |
||
Total |
$ |
8,375,789 |
|
8. Consolidated Securitization Vehicles and Other Variable Interest Entities
Since its inception, the Company has utilized VIEs for the purpose of securitizing whole mortgage loans or re-securitizing RMBS and obtaining long-term, non-recourse financing. The Company evaluated its interest in each VIE to determine if it is the primary beneficiary.
As of December 31, 2018, the Company’s Consolidated Statement of Financial Condition includes assets of consolidated VIEs with a carrying value of $13.4 billion and liabilities with a carrying value of $8.7 billion. As of December 31, 2017, the Company’s Consolidated Statement of Financial Condition includes assets of consolidated VIEs with a carrying value of $15.0 billion and liabilities with a carrying value of $9.6 billion.
110
During the year ended December 31, 2018, the Company securitized and consolidated approximately $2.2 billion unpaid principal balance (of which $1.3 billion related to the collapse and repackaging of certain loan pools previously consolidated as of December 31, 2017) of seasoned residential subprime mortgage loans.
VIEs for Which the Company is the Primary Beneficiary
The retained beneficial interests in VIEs for which the Company is the primary beneficiary are typically the subordinated tranches of these re-securitizations and in some cases the Company may hold interests in additional tranches. The table below reflects the assets and liabilities recorded in the Consolidated Statements of Financial Condition related to the consolidated VIEs as of December 31, 2018 and December 31, 2017.
December 31, 2018 |
December 31, 2017 |
|||||
(dollars in thousands) |
||||||
Assets: |
||||||
Non-Agency RMBS, at fair value |
$ |
1,017,442 |
$ |
1,579,793 |
||
Loans held for investment, at fair value |
12,263,265 |
13,263,338 |
||||
Accrued interest receivable |
72,389 |
75,489 |
||||
Other assets |
39,855 |
68,844 |
||||
Liabilities: |
||||||
Securitized debt, collateralized by Non-Agency RMBS |
$ |
159,955 |
$ |
205,780 |
||
Securitized debt at fair value, collateralized by loans held for investment |
8,455,376 |
9,388,657 |
||||
Accrued interest payable |
33,541 |
33,870 |
||||
Other liabilities |
3,286 |
3,513 |
||||
Income, OTTI and expense amounts related to consolidated VIEs recorded in the Consolidated Statements of Operations is presented in the tables below.
For the Year Ended |
|||||||||
December 31, 2018 |
December 31, 2017 |
December 31, 2016 |
|||||||
(dollars in thousands) |
|||||||||
Interest income, Assets of consolidated VIEs |
$ |
904,830 |
$ |
914,022 |
$ |
678,623 |
|||
Interest expense, Non-recourse liabilities of VIEs |
395,255 |
390,858 |
249,708 |
||||||
Net interest income |
$ |
509,575 |
$ |
523,164 |
$ |
428,915 |
|||
Total other-than-temporary impairment losses |
$ |
(1,026 |
) |
$ |
(2,174 |
) |
$ |
(1,274 |
) |
Portion of loss recognized in other comprehensive income (loss) |
(17,820 |
) |
(51,118 |
) |
(37,475 |
) |
|||
Net other-than-temporary credit impairment losses |
$ |
(18,845 |
) |
$ |
(53,292 |
) |
$ |
(38,749 |
) |
Servicing fees |
$ |
39,313 |
$ |
41,493 |
$ |
31,178 |
|||
VIEs for Which the Company is Not the Primary Beneficiary
The Company is not required to consolidate VIEs in which it has concluded it does not have a controlling financial interest, and thus is not the primary beneficiary. In such cases, the Company does not have both the power to direct the entities’ most significant activities and the obligation to absorb losses or right to receive benefits that could potentially be significant to the VIEs. The Company’s investments in these unconsolidated VIEs are carried in Non-Agency RMBS on the Consolidated Statements of Financial Condition and include senior and subordinated bonds issued by the VIEs. The fair value of the Company’s investments in each unconsolidated VIEs at December 31, 2018, ranged from less than $1 million to $52 million, with an aggregate amount of $1.5 billion. The fair value of the Company’s investments in each unconsolidated VIEs at December 31, 2017, ranged from less than $1 million to $52 million, with an aggregate amount of $1.3 billion. The Company’s maximum exposure to loss from these unconsolidated VIEs was $1.2 billion at December 31, 2018 and December 31, 2017. The maximum exposure to loss was determined as the amortized cost of the unconsolidated VIE, which represents the purchase price of the investment adjusted by any unamortized premiums or discounts as of the reporting date.
111
9. Derivative Instruments
In connection with the Company’s interest rate risk management strategy, the Company economically hedges a portion of its interest rate risk by entering into derivative financial instrument contracts in the form of interest rate swaps, swaptions, and Treasury futures. The Company’s swaps are used to lock in a fixed rate related to a portion of its current and anticipated payments on its repurchase agreements. The Company typically agrees to pay a fixed rate of interest, or pay rate, in exchange for the right to receive a floating rate of interest, or receive rate, over a specified period of time. Treasury futures are derivatives which track the prices of specific Treasury securities and are traded on an active exchange. It is generally the Company’s policy to close out any Treasury futures positions prior to taking delivery of the underlying security. The Company uses Treasury futures to lock in a fixed rate related to a portion of its current and anticipated payments on its repurchase agreements.
The use of derivatives creates exposure to credit risk relating to potential losses that could be recognized if the counterparties to these instruments fail to perform their obligations under the contracts. In the event of a default by the counterparty, the Company could have difficulty obtaining its RMBS or cash pledged as collateral for these derivative instruments. The Company periodically monitors the credit profiles of its counterparties to determine if it is exposed to counterparty credit risk. See Note 14 for further discussion of counterparty credit risk.
The table below summarizes the location and fair value of the derivatives reported in the Consolidated Statements of Financial Condition after counterparty netting and posting of cash collateral as of December 31, 2018 and December 31, 2017.
December 31, 2018 |
||||||||||||||
Derivative Assets |
Derivative Liabilities |
|||||||||||||
Derivative Instruments |
Notional Amount Outstanding |
Location on Consolidated Statements of Financial
Condition
|
Net Estimated Fair Value/Carrying Value |
Location on Consolidated Statements of Financial
Condition
|
Net Estimated Fair Value/Carrying Value |
|||||||||
(dollars in thousands) |
||||||||||||||
Interest Rate Swaps |
$ |
10,906,700 |
Derivatives, at fair value, net |
$ |
35,798 |
Derivatives, at fair value, net |
$ |
— |
||||||
Swaptions |
53,000 |
Derivatives, at fair value, net |
1,670 |
Derivatives, at fair value, net |
— |
|||||||||
Treasury Futures |
619,700 |
Derivatives, at fair value, net |
— |
Derivatives, at fair value, net |
— |
|||||||||
Total |
$ |
11,579,400 |
$ |
37,468 |
$ |
— |
||||||||
December 31, 2017 |
||||||||||||||
Derivative Assets |
Derivative Liabilities |
|||||||||||||
Derivative Instruments |
Notional Amount Outstanding |
Location on Consolidated Statements of Financial
Condition
|
Net Estimated Fair Value/Carrying Value |
Location on Consolidated Statements of Financial
Condition
|
Net Estimated Fair Value/Carrying Value |
|||||||||
(dollars in thousands) |
||||||||||||||
Interest Rate Swaps |
$ |
3,816,400 |
Derivatives, at fair value, net |
$ |
43,257 |
Derivatives, at fair value, net |
$ |
— |
||||||
Swaptions |
391,000 |
Derivatives, at fair value, net |
2,105 |
Derivatives, at fair value, net |
320 |
|||||||||
Treasury Futures |
619,700 |
Derivatives, at fair value, net |
3,552 |
Derivatives, at fair value, net |
— |
|||||||||
Total |
$ |
4,827,100 |
$ |
48,914 |
$ |
320 |
||||||||
The effect of the Company’s derivatives on the Consolidated Statements of Operations is presented below.
112
Net gains (losses) on derivatives for the year ended |
||||||||||
Derivative Instruments |
Location on Consolidated Statements of Operations and Comprehensive Income |
December 31, 2018 |
December 31, 2017 |
December 31, 2016 |
||||||
(dollars in thousands) |
||||||||||
Interest Rate Swaps |
Net unrealized gains (losses) on derivatives |
$ |
(125,595 |
) |
$ |
43,697 |
$ |
47,170 |
||
Interest Rate Swaps |
Net realized gains (losses) on derivatives (1)
|
(1,488 |
) |
(31,593 |
) |
(88,722 |
) |
|||
Treasury Futures |
Net unrealized gains (losses) on derivatives |
(16,928 |
) |
1,768 |
378 |
|||||
Treasury Futures |
Net realized gains (losses) on derivatives |
21,333 |
(4,061 |
) |
(9,170 |
) |
||||
Swaptions |
Net unrealized gains (losses) on derivatives |
1,361 |
2,511 |
2,545 |
||||||
Swaptions |
Net realized gains (losses) on derivatives |
(1,476 |
) |
(6,134 |
) |
(7,044 |
) |
|||
Other Derivative Assets |
Net unrealized gains (losses) on derivatives |
— |
— |
— |
||||||
Other Derivative Assets |
Net realized gains (losses) on derivatives |
— |
— |
(566 |
) |
|||||
Total |
$ |
(122,793 |
) |
$ |
6,188 |
$ |
(55,409 |
) |
||
(1) Includes loss on terminations of interest rate swaps of $16 million and $61 million for the years ended December 31, 2017 and 2016, respectively. There were no swaps terminations during the year ended December 31, 2018.
The weighted average pay rate on the Company’s interest rate swaps at December 31, 2018 was 2.58% and the weighted average receive rate was 2.69%. The weighted average pay rate on the Company’s interest rate swaps at December 31, 2017 was 1.93% and the weighted average receive rate was 1.53%. The weighted average maturity on the Company’s interest rate swaps at December 31, 2018 and December 31, 2017 was 7 and 5 years, respectively.
Certain of the Company’s derivative contracts are subject to International Swaps and Derivatives Association Master Agreements or other similar agreements which may contain provisions that grant counterparties certain rights with respect to the applicable agreement upon the occurrence of certain events such as (i) a decline in stockholders’ equity in excess of specified thresholds or dollar amounts over set periods of time, (ii) the Company’s failure to maintain its REIT status, (iii) the Company’s failure to comply with limits on the amount of leverage, and (iv) the Company’s stock being delisted from the New York Stock Exchange (NYSE). Upon the occurrence of any one of items (i) through (iv), or another default under the agreement, the counterparty to the applicable agreement has a right to terminate the agreement in accordance with its provisions. Certain of the Company’s interest rate swaps are cleared through a registered commodities exchange. Each of the Company’s ISDAs and clearing exchange agreements contains provisions under which the Company is required to fully collateralize its obligations under the interest rate swap agreements if at any point the fair value of the swap represents a liability greater than the minimum transfer amount contained within the agreements. The Company is also required to post initial collateral upon execution of certain of its swap transactions. If the Company breaches any of these provisions, it will be required to settle its obligations under the agreements at their termination values, which approximates fair value. The Company uses clearing exchange market prices to determine the fair value of its interest rate swaps. The aggregate fair value of all derivative instruments with credit-risk-related contingent features are in a net liability position at December 31, 2018 is approximately $99 million including accrued interest, which represents the maximum amount the Company would pay upon termination, which is fully collateralized.
10. Capital Stock
Preferred Stock
In September 2018, the Company issued 10,400,000 shares of 7.75% Series C Fixed-to-Floating Rate Cumulative Redeemable Preferred Stock, par value $0.01 per share, or the Series C Preferred Stock, at a public offering price of $25.00 per share and for net proceeds to us of $252 million. The Series C Preferred Stock is redeemable at $25.00 per share plus accrued and unpaid dividends (whether or not authorized or declared) exclusively at the Company’s option commencing in September 30, 2025, subject to the Company’s right, under limited circumstances, to redeem the Series C Preferred Stock prior to that date. The initial dividend rate for the Series C Preferred Stock, from and including September 20, 2018, to but not including September 30, 2025, will be equal to 7.75% per annum of the $25.00 liquidation preference per share (equivalent to the fixed annual rate of $1.9375 per share). On and after September 30, 2025, dividends on the Series C Preferred Stock will accumulate at a percentage of the $25.00 liquidation preference equal to an annual floating rate of the three-month LIBOR plus a spread of 4.743% per annum. The Series C Preferred Stock is entitled to receive, when and as declared, a dividend at a rate of 7.75% per year on the $25.00 liquidation preference before the common stock is paid any dividends and is senior to the common stock with respect to distributions upon liquidation, dissolution or winding up.
113
The Company declared dividends to Series C preferred stock holders of $6 million, or $0.54 per preferred share during the year ended December 31, 2018.
The Company declared dividends to Series A preferred stockholders of $12 million, or $2.00 per preferred share, during the year ended December 31, 2018 and 2017, respectively.
The Company declared dividends to Series B preferred stockholders of $26 million and $22 million, or $2.00 and $1.68 per preferred share during the year ended December 31, 2018 and 2017, respectively.
Common Stock
In February 2018, our Board of Directors reauthorized $100 million under our share repurchase program, or the Repurchase Program. Such authorization does not have an expiration date and, at present, there is no intention to modify or otherwise rescind such authorization. Shares of our common stock may be purchased in the open market, including through block purchases, through privately negotiated transactions, or pursuant to any trading plan that may be adopted in accordance with Rule 10b5-1 of the Securities Exchange Act of 1934, as amended. The timing, manner, price and amount of any repurchases will be determined at our discretion and the program may be suspended, terminated or modified at any time for any reason. Among other factors, the Company intends to only consider repurchasing shares of our common stock when the purchase price is less than the last publicly reported book value per common share. In addition, the Company does not intend to repurchase any shares from directors, officers or other affiliates. The program does not obligate the Company to acquire any specific number of shares, and all repurchases will be made in accordance with Rule 10b-18, which sets certain restrictions on the method, timing, price and volume of stock repurchases.
Pursuant to our Repurchase Program, the Company repurchased approximately 883 thousand shares of its common stock at an average price of $16.81 per share for a total of $15 million during the year ended December 31, 2018. The Company did not repurchase any shares during the year ended December 31, 2017.
The Company declared dividends to common shareholders of $375 million and $377 million, or $2.00 per share during the years ended years ended December 31, 2018, and 2017, respectively.
Earnings per share for the years ended December 31, 2018, 2017 and 2016 respectively, are computed as follows:
For the Year Ended |
|||||||||
December 31, 2018 |
December 31, 2017 |
December 31, 2016 |
|||||||
(dollars in thousands) |
|||||||||
Numerator: |
|||||||||
Net income available to common shareholders |
$ |
368,440 |
$ |
491,184 |
$ |
549,494 |
|||
Effect of dilutive securities: |
— |
— |
— |
||||||
Dilutive net income available to common shareholders |
$ |
368,440 |
$ |
491,184 |
$ |
549,494 |
|||
Denominator: |
|||||||||
Weighted average basic shares |
187,146,170 |
187,780,355 |
187,728,634 |
||||||
Effect of dilutive securities |
602,692 |
506,965 |
296,204 |
||||||
Weighted average dilutive shares |
187,748,862 |
188,287,320 |
188,024,838 |
||||||
Net income per average share attributable to common stockholders - Basic |
$ |
1.97 |
$ |
2.62 |
$ |
2.93 |
|||
Net income per average share attributable to common stockholders - Diluted |
$ |
1.96 |
$ |
2.61 |
$ |
2.92 |
|||
11. Accumulated Other Comprehensive Income
The following table presents the changes in the components of Accumulated Other Comprehensive Income, or the AOCI, for the year ended December 31, 2018 and 2017:
114
December 31, 2018 |
||||||
(dollars in thousands) |
||||||
Unrealized gains (losses) on available-for-sale securities, net |
Total Accumulated OCI Balance |
|||||
Balance as of December 31, 2017 |
$ |
796,902 |
$ |
796,902 |
||
OCI before reclassifications |
(185,570 |
) |
(185,570 |
) |
||
Amounts reclassified from AOCI |
15,500 |
15,500 |
||||
Net current period OCI |
(170,070 |
) |
(170,070 |
) |
||
Balance as of December 31, 2018 |
$ |
626,832 |
$ |
626,832 |
||
December 31, 2017 |
||||||
(dollars in thousands) |
||||||
Unrealized gains (losses) on available-for-sale securities, net |
Total Accumulated OCI Balance |
|||||
Balance as of December 31, 2016 |
$ |
718,106 |
$ |
718,106 |
||
OCI before reclassifications |
24,218 |
24,218 |
||||
Amounts reclassified from AOCI |
54,578 |
54,578 |
||||
Net current period OCI |
78,796 |
78,796 |
||||
Balance as of December 31, 2017 |
$ |
796,902 |
$ |
796,902 |
||
The following table presents the details of the reclassifications from AOCI for the year ended December 31, 2018 and 2017:
December 31, 2018 |
December 31, 2017 |
||||||
Details about Accumulated OCI Components |
Amounts Reclassified
from Accumulated OCI
|
Amounts Reclassified
from Accumulated OCI
|
Affected Line on the Consolidated Statements Of Operations |
||||
Unrealized gains and losses on available-for-sale securities |
|||||||
$ |
6,291 |
$ |
7,278 |
Net realized gains (losses) on sales of investments |
|||
(21,791 |
) |
(61,856 |
) |
Net other-than-temporary credit impairment losses |
|||
$ |
(15,500 |
) |
$ |
(54,578 |
) |
Income before income taxes |
|
— |
— |
Income taxes |
|||||
$ |
(15,500 |
) |
$ |
(54,578 |
) |
Net of tax |
|
12. Equity Compensation, Employment Agreements and other Benefit Plans
In accordance with the terms of the Company’s 2007 Equity Incentive Plan (as amended and restated on December 10, 2015), or the Incentive Plan, directors, officers and employees of the Company are eligible to receive restricted stock grants. These awards generally have a restriction period lasting three years. During the vesting period, these shares may not be sold. There were approximately 5 million shares available for future grants under the Incentive Plan as of December 31, 2018.
During the first quarter of 2017, the Compensation Committee of the Board of Directors of the Company approved a Stock Award Deferral Program, or the Deferral Program. Under the Deferral Program, non-employee directors and certain executive officers can elect to defer payment of certain stock awards made pursuant to the Equity Plan. Deferred awards are treated as deferred stock units and paid at the earlier of separation from service or a date elected by the participant. Payments are generally made in a lump sum or, if elected by the participant, in five annual installments. Deferred awards receive dividend equivalents during the deferral period in the form of additional deferred stock units. Amounts are paid at the end of the deferral period by delivery of shares from the Incentive Plan (plus cash for any fractional deferred stock units), less any applicable tax withholdings. Deferral elections do not alter any vesting requirements applicable to the underlying stock award.
115
During the year ended December 31, 2018 and 2017, the Company granted certain of its employees Restricted Stock Units, or RSU awards. RSU awards are designed to reward certain employees of the Company for services provided over the previous year. Generally, the RSU awards vest equally over a three-year period beginning from the grant date and will fully vest after three years. The RSU awards are valued at the market price of the Company’s common stock on the grant date and the employees must be employed by the Company on the vesting dates to receive the RSU awards. The Company granted 335 thousand and 204 thousand RSU awards during the year ended December 31, 2018 and 2017, with a grant date fair value of $6 million and $4 million, respectively, which will be recognized as compensation expense on a straight-line basis over the three year vesting period.
During the year ended December 31, 2018 and 2017, the Company granted certain employees and directors 133 thousand and 144 thousand Performance Share Units, or PSU awards, respectively. PSU awards are designed to align compensation with the Company’s future performance. The PSU awards include a three year performance period ending on December 31, 2020 and December 31, 2019, respectively. The final number of shares that will vest will be between 0% to 150% of the total PSU awards granted based on the total shareholder return of the Company as compared to an index of comparable financial institutions and will cliff vest at the end of the performance period. The PSU awards are measured at fair value on the grant date which will be recognized as compensation expense ratably over the three-year vesting period. Fair value is determined using a Monte Carlo valuation model developed to value the specific features of the PSU awards, including market based conditions. Inputs into the model include the Company’s historical volatility, the peer average historical volatility, and the correlation coefficient of the volatility. In addition, inputs also included the share price at the beginning of the measurement period and an estimated total shareholder return for both the Company and the peer group of comparable financial institutions. Based on the model results, the 133 thousand PSU awards granted during 2018 had a grant date value of $2 million that will cliff vest on December 31, 2020. The 144 thousand PSU awards granted during 2017 had a grant date value of $3 million which will cliff vest on December 31, 2019.
The following table presents information with respect to the Company's stock awards during the years ended December 31, 2018 and 2017.
For the Year Ended |
||||||||
December 31, 2018 |
December 31, 2017 |
|||||||
Number of Shares |
Weighted Average Grant Date Fair Value |
Number of Shares |
Weighted Average Grant Date Fair Value |
|||||
Unvested shares outstanding - beginning of period |
769,815 |
25.58 |
577,547 |
14.53 |
||||
Granted |
467,657 |
17.90 |
348,244 |
18.68 |
||||
Vested |
(69,303 |
) |
15.99 |
(155,976 |
) |
30.74 |
||
Forfeited |
(8,986 |
) |
18.40 |
— |
— |
|||
Unvested shares outstanding - end of period |
1,159,183 |
16.51 |
769,815 |
25.58 |
||||
The Company recognized stock based compensation expenses of $8 million and $4 million, for the years ended December 31, 2018 and 2017, respectively.
The Company also maintains a qualified 401(k) plan. The plan is a retirement savings plan that allows eligible employees to contribute a portion of their wages on a tax-deferred basis under Section 401(k) of the Code. Employees may contribute, through payroll deductions, up to $18,500 if under the age of 50 years and an additional $6,000 “catch-up” contribution for employees 50 years or older. The Company matches 100% of the first 6% of the eligible compensation deferred by employee contributions. The employer funds the 401(k) matching contributions in the form of cash, and participants may direct the Company match to an investment of their choice. The benefit of the Company’s contributions vests immediately. Generally, a participating employee is entitled to distributions from the plans upon termination of employment, retirement, death or disability. The 401(k) expenses related to the Company’s qualified plan for the years ended December 31, 2018 and 2017, were $434 thousand and $376 thousand, respectively.
13. Income Taxes
For the years ended December 31, 2018 and December 31, 2017, the Company qualified to be taxed as a REIT under Code Sections 856 through 860. As a REIT, the Company is not subject to U.S. federal income tax to the extent that it makes qualifying distributions of taxable income to its stockholders. To maintain qualification as a REIT, the Company must distribute
116
at least 90% of its annual REIT taxable income (subject to certain adjustments) to its shareholders and meet certain other requirements such as assets it may hold, income it may generate and its shareholder composition. It is generally the Company’s policy to distribute to its shareholders all of the Company’s taxable income.
The state and local tax jurisdictions in which the Company is subject to tax-filing obligations recognize the Company’s status as a REIT and therefore the Company generally does not pay income tax in such jurisdictions. The Company may, however, be subject to certain minimum state and local tax filing fees and its TRSs are subject to U.S. federal, state and local taxes. There were no significant income tax expenses for the years ended December 31, 2018, 2017 and 2016. The Company recorded a deferred tax asset of $7 million and $4 million for the years ended December 31, 2018 and 2017, respectively, relating to the activities of its TRSs. Of these amounts, the amount related to cumulative net operating losses was $550 thousand and $1 million as of December 31, 2018 and 2017, respectively, and the amount related to losses which were disallowed under Code Section 267(a) was $7 million and $3 million as of December 31, 2018 and 2017. The Company evaluates, based on both positive and negative evidence, the likelihood of realizing its deferred tax assets and established a valuation allowance of $7 million and $4 million for the years ended December 31, 2018 and 2017.
In general, cash dividends declared by the Company will be considered ordinary income to stockholders for income tax purposes. From time to time, a portion of the Company’s dividends may be characterized as capital gains or return of capital distributions.
The Company’s effective tax rate differs from its combined U.S. federal, state and city corporate statutory tax rate primarily due to the deduction of dividend distributions required to be paid under Code Section 857(a).
The Company’s 2017, 2016 and 2015 U.S. federal, state and local tax returns remain open for examination.
14. Credit Risk and Interest Rate Risk
The Company’s primary components of market risk are credit risk and interest rate risk. The Company is subject to interest rate risk in connection with its investments in Agency MBS and Non-Agency RMBS, residential mortgage loans, borrowings under repurchase agreements and securitized debt. When the Company assumes interest rate risk, it attempts to minimize interest rate risk through asset selection, hedging and matching the income earned on mortgage assets with the cost of related financing.
The Company attempts to minimize credit risk through due diligence, asset selection and portfolio monitoring. The Company has established a whole loan target market including prime and subprime borrowers, Alt-A documentation, geographic diversification, owner-occupied property, and moderate loan-to-value ratios. These factors are considered to be important indicators of credit risk.
By using derivative instruments and repurchase agreements, the Company is exposed to counterparty credit risk if counterparties to the contracts do not perform as expected. If a counterparty fails to perform on a derivative hedging instrument, the Company’s counterparty credit risk is equal to the amount reported as a derivative asset on its balance sheet to the extent that amount exceeds collateral obtained from the counterparty or, if in a net liability position, the extent to which collateral posted exceeds the liability to the counterparty. The amounts reported as a derivative asset/(liability) are derivative contracts in a gain/(loss) position, and to the extent subject to master netting arrangements, net of derivatives in a loss/(gain) position with the same counterparty and collateral received/(pledged). If the counterparty fails to perform on a repurchase agreement, the Company is exposed to a loss to the extent that the fair value of collateral pledged exceeds the liability to the counterparty. The Company attempts to minimize counterparty credit risk by evaluating and monitoring the counterparty’s credit, executing master netting arrangements and obtaining collateral, and executing contracts and agreements with multiple counterparties to reduce exposure to a single counterparty.
Our repurchase agreements and derivative transactions are governed by underlying agreements that provide for a right of setoff under master netting arrangements, including in the event of default or in the event of bankruptcy of either party to the transactions. The Company presents its assets and liabilities subject to such arrangements on a net basis in our consolidated statements of financial condition. The following table presents information about our liabilities that are subject to such arrangements and can potentially be offset on our consolidated statements of financial condition as of December 31, 2018 and December 31, 2017.
117
December 31, 2018 |
||||||||||||||||||
(dollars in thousands) |
||||||||||||||||||
Gross Amounts of Recognized Assets (Liabilities) |
Gross Amounts Offset in the Consolidated Statements of Financial Position |
Net Amounts Offset in the Consolidated Statements of Financial Position |
Gross Amounts Not Offset with Financial Assets (Liabilities) in the Consolidated Statements of Financial Position |
|||||||||||||||
|
Financial
Instruments
|
Cash Collateral (Received) Pledged (1)
|
Net Amount |
||||||||||||||||
Repurchase Agreements |
$ |
(14,030,465 |
) |
$ |
— |
$ |
(14,030,465 |
) |
$ |
15,831,008 |
$ |
— |
$ |
1,800,543 |
||||
Interest Rate Swaps - Gross Assets |
87,451 |
(51,653 |
) |
35,798 |
— |
198,112 |
233,910 |
|||||||||||
Interest Rate Swaps - Gross Liabilities |
(169,790 |
) |
169,790 |
— |
— |
— |
— |
|||||||||||
Treasury Futures - Gross Assets |
— |
— |
— |
— |
3,220 |
3,220 |
||||||||||||
Treasury Futures - Gross Liabilities |
(13,375 |
) |
13,375 |
— |
— |
— |
— |
|||||||||||
Swaptions - Gross Assets |
1,670 |
— |
1,670 |
— |
— |
1,670 |
||||||||||||
Swaptions - Gross Liabilities |
— |
— |
— |
— |
— |
— |
||||||||||||
Total Liabilities |
$ |
(14,124,509 |
) |
$ |
131,512 |
$ |
(13,992,997 |
) |
$ |
15,831,008 |
$ |
201,332 |
$ |
2,039,343 |
||||
(1) Included in other assets
December 31, 2017 |
||||||||||||||||||
(dollars in thousands) |
||||||||||||||||||
Gross Amounts of Recognized Assets (Liabilities) |
Gross Amounts Offset in the Consolidated Statements of Financial Position |
Net Amounts Offset in the Consolidated Statements of Financial Position |
Gross Amounts Not Offset with Financial Assets (Liabilities) in the Consolidated Statements of Financial Position |
|||||||||||||||
|
Financial
Instruments
|
Cash Collateral (Received) Pledged (1)
|
Net Amount |
||||||||||||||||
Repurchase Agreements |
$ |
(7,250,452 |
) |
$ |
— |
$ |
(7,250,452 |
) |
$ |
8,788,680 |
$ |
1,156 |
$ |
1,539,384 |
||||
Interest Rate Swaps - Gross Assets |
44,874 |
(1,617 |
) |
43,257 |
— |
11,570 |
54,827 |
|||||||||||
Interest Rate Swaps - Gross Liabilities |
(1,617 |
) |
1,617 |
— |
— |
— |
— |
|||||||||||
Treasury Futures - Gross Assets |
3,552 |
— |
3,552 |
— |
376 |
3,928 |
||||||||||||
Treasury Futures - Gross Liabilities |
— |
— |
— |
— |
— |
— |
||||||||||||
Swaptions - Gross Assets |
2,105 |
— |
2,105 |
— |
— |
2,105 |
||||||||||||
Swaptions - Gross Liabilities |
(320 |
) |
— |
(320 |
) |
— |
— |
(320 |
) |
|||||||||
Total Liabilities |
$ |
(7,201,858 |
) |
$ |
— |
$ |
(7,201,858 |
) |
$ |
8,788,680 |
$ |
13,102 |
$ |
1,599,924 |
||||
(1) Included in other assets
15. Commitments and Contingencies
From time to time, the Company may become involved in various claims and legal actions arising in the ordinary course of business. In connection with certain re-securitization transactions engaged in by the Company, it has the obligation under certain circumstances to repurchase assets from the VIE upon breach of certain representations and warranties.
During the third quarter of 2018, Anacostia LLC, a TRS, acquired a 24.9% ownership interest in Kah Capital Management LLC, or KAH Capital, for $25 thousand. KAH Capital was formed to sponsor and manage one or more funds or accounts that focus on investments in U.S. housing related assets including reperforming and distressed loans, structured transactions and securities sourced from Government Sponsored Enterprises (GSEs) and private sellers, as well as other investments related to U.S. mortgage finance. KAH Capital will generate advisory and fee income and accordingly our investment is indirectly held through Anacostia LLC, a taxable REIT subsidiary.
In addition to the investment in KAH Capital, the Company has made a $150 million capital commitment to Hains Point (Hains Point), which is KAH Capital’s initial fund for which Chimera is the sole investor. As of December 31, 2018, the Company has funded $2 million towards that commitment. KAH Capital will manage the investments in Hains Point including asset selection, repurchase and other financing arrangements as well as hedging transactions. Capital calls for investments made in Hains Point are subject to our consent and approval. KAH Capital will earn $6.5 million over approximately 3 years for its investment advisory services.
KAH Capital is a registered investment advisor with the Securities and Exchange Commission (SEC). We do not believe we are a “control person” of KAH Capital given the structure of our investment. If we were deemed a control person by a court, the SEC or other regulatory body, under certain circumstances we could have liability for misconduct by KAH Capital.
118
16. Subsequent Events
Subsequent to December 31, 2018, the Company sold 8,000,000 shares of 8.00% Series D Cumulative Redeemable Preferred Stock, par value $0.01 per share, or the Series D Preferred Stock, at a public offering price of $25.00 per share. The Series D Preferred Stock is redeemable at $25.00 per share plus accrued and unpaid dividends (whether or not authorized or declared) exclusively at the Company’s option commencing in March 30, 2024, subject to the Company’s right, under limited circumstances, to redeem the Series D Preferred Stock prior to that date. The Series D Preferred Stock is entitled to receive a dividend at a rate of 8.00% per year on the $25.00 liquidation preference before the common stock is paid any dividends and is senior to the common stock with respect to distributions upon liquidation, dissolution or winding up. This transaction was completed in January 2019, pursuant to which the company received net proceeds of $194 million.
119
17. Summarized Quarterly Results (Unaudited)
The following is a presentation of the results of operations for the quarters ended December 31, 2018, September 30, 2018, June 30, 2018 and March 31, 2018.
For the Quarter Ended |
||||||||||||
December 31, 2018 |
September 30, 2018 |
June 30, 2018 |
March 31, 2018 |
|||||||||
(dollars in thousands, except per share data) |
||||||||||||
Net Interest Income: |
||||||||||||
Interest income |
$ |
348,033 |
$ |
321,715 |
$ |
306,436 |
$ |
297,132 |
||||
Interest expense |
193,920 |
174,671 |
161,266 |
149,251 |
||||||||
Net interest income |
154,113 |
147,044 |
145,170 |
147,881 |
||||||||
Net other-than-temporary credit impairment losses |
(4,269 |
) |
(7,233 |
) |
(9,131 |
) |
(1,158 |
) |
||||
Net gains (losses) on derivatives |
(315,877 |
) |
74,078 |
24,502 |
94,504 |
|||||||
Net unrealized gains (losses) on financial instruments at fair value |
84,836 |
(34,306 |
) |
(18,364 |
) |
14,466 |
||||||
Net realized gains (losses) on sales of investments |
1,213 |
(6,123 |
) |
2,167 |
— |
|||||||
Gain (loss) on Extinguishment of Debt |
7,055 |
9,263 |
387 |
9,670 |
||||||||
Total other expenses |
29,855 |
25,395 |
26,587 |
26,322 |
||||||||
Net income (loss) |
$ |
(102,798 |
) |
$ |
157,321 |
$ |
118,108 |
$ |
239,007 |
|||
Dividend on preferred stock |
$ |
14,437 |
$ |
9,960 |
$ |
9,400 |
$ |
9,400 |
||||
Net income (loss) available to common shareholders |
$ |
(117,235 |
) |
$ |
147,361 |
$ |
108,708 |
$ |
229,607 |
|||
Net income per common share-basic |
$ |
(0.63 |
) |
$ |
0.79 |
$ |
0.58 |
$ |
1.22 |
|||
The following is a presentation of the results of operations for the quarters ended December 31, 2017, September 30, 2017, June 30, 2017 and March 31, 2017.
For the Quarter Ended |
||||||||||||
December 31, 2017 |
September 30, 2017 |
June 30, 2017 |
March 31, 2017 |
|||||||||
(dollars in thousands, except per share data) |
||||||||||||
Net Interest Income: |
||||||||||||
Interest income |
$ |
301,957 |
$ |
296,813 |
$ |
288,644 |
$ |
251,344 |
||||
Interest expense |
144,204 |
140,358 |
137,955 |
110,231 |
||||||||
Net interest income |
157,753 |
156,455 |
150,689 |
141,113 |
||||||||
Net other-than-temporary credit impairment losses |
(18,179 |
) |
(11,468 |
) |
(13,509 |
) |
(18,701 |
) |
||||
Net gains (losses) on derivatives |
31,108 |
1,363 |
(21,822 |
) |
(4,462 |
) |
||||||
Net unrealized gains (losses) on financial instruments at fair value |
(47,637 |
) |
19,042 |
67,762 |
72,243 |
|||||||
Net realized gains (losses) on sales of investments |
(586 |
) |
1 |
4,541 |
5,167 |
|||||||
Gain (loss) on Extinguishment of Debt |
12,742 |
(1 |
) |
(48,014 |
) |
— |
||||||
Total other expenses |
27,657 |
26,142 |
24,491 |
32,537 |
||||||||
Net income (loss) |
$ |
107,608 |
$ |
139,232 |
$ |
115,017 |
$ |
162,807 |
||||
Dividend on preferred stock |
$ |
9,400 |
$ |
9,400 |
$ |
9,400 |
$ |
5,283 |
||||
Net income (loss) available to common shareholders |
$ |
98,208 |
$ |
129,832 |
$ |
105,617 |
$ |
157,524 |
||||
Net income per common share-basic |
$ |
0.52 |
$ |
0.69 |
$ |
0.56 |
$ |
0.84 |
||||
120
121
SIGNATURES
Pursuant to the requirements of Section 13 or 15(d) of the Securities Exchange Act of 1934, the registrant has duly caused this report to be signed on its behalf by the undersigned, thereunto duly authorized, in the city of New York, State of New York.
CHIMERA INVESTMENT CORPORATION |
|||
Date: February 21, 2019 |
By: |
/s/ Matthew Lambiase |
|
Matthew Lambiase Chief Executive Officer and President |
|||
Pursuant to the requirements of the Securities Exchange Act of 1934, this report has been signed below by the following persons on behalf of the registrant and in the capacities and on the date indicated.
Signatures |
Title |
Date |
|
/s/ Matthew Lambiase |
Chief Executive Officer, President, and
Director (Principal Executive Officer)
|
February 21, 2019 |
|
Matthew Lambiase |
|||
/s/ Rob Colligan |
Chief Financial Officer (Principal Financial
and Accounting Officer)
|
February 21, 2019 |
|
Rob Colligan |
|||
/s/ Mark Abrams |
Director |
February 21, 2019 |
|
Mark Abrams |
|||
/s/ Paul Donlin |
Director |
February 21, 2019 |
|
Paul Donlin |
|||
/s/ Gerard Creagh |
Director |
February 21, 2019 |
|
Gerard Creagh |
|||
/s/ Dennis Mahoney |
Director |
February 21, 2019 |
|
Dennis Mahoney |
|||
/s/ John P. Reilly |
Director |
February 21, 2019 |
|
John P. Reilly |
|||
/s/ Teresa Bryce Bazemore |
Director |
February 21, 2019 |
|
Teresa Bryce Bazemore |
|||
/s/ Debra Still |
Director |
February 21, 2019 |
|
Debra Still |
|||
122